• Note d'application

A Novel Approach for Reducing Fraction Drydown Time

A Novel Approach for Reducing Fraction Drydown Time

  • Paul Lefebvre
  • Ronan Cleary
  • Warren B. Potts
  • Robert S. Plumb
  • Waters Corporation
Statins, beta blockers, or generic tablets

Abstract

This application note shows the development and optimization of a method that removes the water and reduces the overall volume of the collected fraction. This method works by injecting and trapping the previously collected fraction onto a preparative column.  

Introduction

Recent advances in purification technology have shifted the throughput bottleneck from purifying samples to fraction drying. Some of the technologies employed for sample drying include vacuum centrifugation, heated nitrogen blow-down, and lyophilization. However, each one has the same rate limiting factor – the quantity of water present. This quantity is dependant on the separation technique used to generate the fractions. The most commonly used technique is reverse phase- (RP-) HPLC, which can generate fractions with the water content as great as 95%. 

One experimental approach is to collect fractions directly onto solid phase extraction (SPE) cartridges. In theory, this method is perfect, but making it automated and rugged has continued to be a challenge. A drawback to this approach is that a very high flow dilution pump is required to trap the compound on the cartridge. This high flow rate requires a large quantity of sorbent with large volume cartridges, and generates large volume fractions. Another problem with collection onto SPE cartridges is the possible change in selectivity that could result in poor trapping or breakthrough of the analyte. 

This application note shows the development and optimization of a method that removes the water and reduces the overall volume of the collected fraction. This method works by injecting and trapping the previously collected fraction onto a preparative column. The fraction is trapped by diluting the loading flow with 100% aqueous mobile phase. After the trapping has been completed, 100% organic mobile phase is passed through the column to elute the sample. Collection of the target is triggered by the MS detector and the collected fraction is now in 100% organic mobile. 

Experimental

Method Conditions

The standard components of the Waters AutoPurification System were used to perform the fraction concentration. In the plumbing diagram shown in Figure 1, the aqueous flow out of the gradient pump is directed into the first tee (T1). This tee acts as a mixer, diluting the organic concentration of the injected fraction, so that it will not break through the trapping column. The organic flow out of the gradient pump is directed to a second tee (T2) and is used to elute sample from the column. 

Plumbing diagram for the concentration system. Both fraction collection and concentration was performed on the same mass-directed AutoPurification System
Figure 1. Plumbing diagram for the concentration system. Both fraction collection and concentration was performed on the same mass-directed AutoPurification System. Fraction collection was triggered by MS. 

Proof of Principle

To establish a baseline performance of the method parameters, 10 drug-like compounds were initially purified. These purified fractions were collected in different concentrations of organic solvent and then used as the samples to evaluate the concentration method. The samples were loaded onto a trapping column and eluted in 100% organic solvent. Once it was determined that the initial method was successful, the process was optimized for minimum fraction volume and maximum throughput. The examples shown have initial fraction volumes as great as 30 mL of aqueous/ organic and are reduced to as little as 1.5 mL of organic solvent. 

Purification Method

  • 10 mg sample load 
  • Generic 5% to 95% gradient with water/ACN/formic acid 
  • Fraction volume of 5 to 8 mL with recoveries of greater than 95% 
Generic 5% to 95% gradient
Figure 2. Generic 5% to 95% gradient. 

Concentration Method

The collected fractions were injected onto the same column as was used for purification. The samples were loaded onto the column with a loading pump at 6 mL/min 100% A, and 29 mL/min aqueous from a dilution pump. After 6.5 min, the loading and dilution flow is stopped. Now that the sample is retained on the column, the elution is started at 29 mL/min of 100% B. 

Results and Discussion

Although the remaining sample was purified using the SunFire Column, it was not retained on the column during the concentration process. However, because fraction collection was triggered by MS, no sample was lost. Additional work is required to determine why it was not retained. 

Seven of the 10 were successfully concentrated in the acidic mobile phase in which they were collected
Figure 3. Seven of the 10 were successfully concentrated in the acidic mobile phase in which they were collected. All recoveries were greater than 85%. 

Method Optimization

Once the trapping method was determined to be successful, we looked into optimizing the conditions. The parameters evaluated included the column dimension and packing, the dilution ratio, and the elution flow rate. An initial fraction of 10 mg of diphenhydramine collected in 8 mL of 60% water was the concentration test sample. 

Column Dimensions

The column must be able to trap the target fraction and yet give a minimum elution volume for the concentrated fraction. 

The maximum flow rate and the minimum loading time were determined to establish a minimum run time. These factors are dependant upon the column I.D., particle size, and injection loop. 

Two of the remaining three were successful after adding base to fraction
Figure 4. Two of the remaining three were successful after adding base to fraction. This indicates that these samples should have been purified at a basic pH to keep the target neutral. 

19 x 50 mm Trap Column

5 and 10 μm packing gave the same fraction volume. The only difference was the system back pressure. 

Concentration of the test fraction on a 19 x 50 mm column
Figure 5. Concentration of the test fraction on a 19 x 50 mm column. 

10 x 50 5-μm Trap Column

The overall flow rate was reduced when the method was transferred to the 10-mm column. By reducing the elution flow rate from 24 to 12 mL/min, the concentrated fraction volume was reduced from 8 mL to 2.9 mL. By reducing the flow rate even further to 8 mL/min, the original 8 mL of 60% water was reduced to 1.6 mL of 100% organic solvent. There is minimal loss of the overall speed of the analysis with the reduced elution flow rate. The loading and dilution pumps operate at 24 and 4 mL/min, respectively, until 6.5 min. The flow rate was then reduced to the lower elution flow, accounting for the smaller volume, concentrated fractions. 

Improving Throughput

Sample loading rules 

  • The injection volume must be less than half the volume of the sample loop. Because the injection volume was 8 mL, the minimum loop volume was found to be 15 mL.
  • Three- to five-times the loop volume is required to clear the sample from the sample loop. The minimum volume found to clear all the sample was 45 mL. 
Elution flow was reduced with minimal adjustment to peak width
Figures 6 and 7. Elution flow was reduced with minimal adjustment to peak width. 

Dilution Ratio

The dilution ratio (dilution flow/loading flow) is a critical factor in this method. The dilution ratio is a measure of the amount of aqueous solvent used to dilute the fraction’s organic content to allow it to be trapped onto the column. If the dilution ratio is too small, it will cause breakthrough. If it is too large, it will decrease the throughput because of the additional time required to load the sample. Figure 9 shows the effect of the concentration with varying dilution ratios. The results show that, at a ratio of 4.5, there is a jagged breakthrough of the target compound that is not present at a ratio of 5 or higher. 

Concentration of the test fraction on a 10 x 50 mm 5 μm column at an elution flow rate of 8 mL/min
Figure 8. Concentration of the test fraction on a 10 x 50 mm 5 μm column at an elution flow rate of 8 mL/min. 
Concentration of test fraction with varying dilution ratios
Figure 9 A-C. Concentration of test fraction with varying dilution ratios.

Scaling the Method

Based on the minimum loading time and dilution ratio, it is possible to establish the relationship between the loading time and the total flow rate (Table 1). 

To reduce the loading time to less than 5 min, the table shows that a loading and dilution flow of 10 and 50 mL/min, respectively, are required. This gives a total flow of 60 mL/min across the column. 

Relationship between loading time and total flow
Table 1. Relationship between loading time and total flow. 

Handling Increased Back Pressure

  • Increase the particle size: a 2x increase equals a quarter of the back pressure 
  • Waters SunFire Column, 10 x 50 mm, 10 μm 
  • 60 mL/min only generated 2300 psi 
Results from the optimized method
Figure 10. Results from the optimized method. 

Mass Load

One concern with these optimized parameters is the mass load on the smaller trapping column. To evaluate this, the compounds were purified with increasing mass load on the preparative column until overload conditions were achieved. The collected fractions were concentrated using the optimized method. Two examples are shown. 

 Example 1: 60 mg of Ketoprofen 

The initial purification generated a 10 mL fraction containing about 50% water. The concentration method successfully reduced the volume to 3.6 mL of organic solvent with a recovery greater than 95%.

The purification and concentration of 60 mg of ketoprofen
Figure 11 A-B. The purification and concentration of 60 mg of ketoprofen. 

Example 2: 20 mg Phenyl-tetrazole 

The purification generated two fractions with a total volume of 18 mL containing about 60% water. The concentration successfully reduced the volume to 3.2 mL of organic solvent with the recovery greater than 95%. When the chromatography begins to overload for the purification on a 19 x 50 mm column, the fraction will not be completely trapped on the 10 x 50 mm column.

The purification and concentration of 20 mg of phenyl-tetrazole
Figure 12 A-B. The purification and concentration of 20 mg of phenyl-tetrazole. 

Automatic pooling

Fraction pooling on the trapping column can also increase throughput. In Figure 13, a 3-mL fraction was collected for each of the 10 injections. The fractions were then individually loaded onto the trap column and concentrated. A single 1.5 mL fraction was collected. 

An example of automatic pooling of 10 fraction tubes into a single concentrated fraction
Figure 13. An example of automatic pooling of 10 fraction tubes into a single concentrated fraction. 

Conclusion

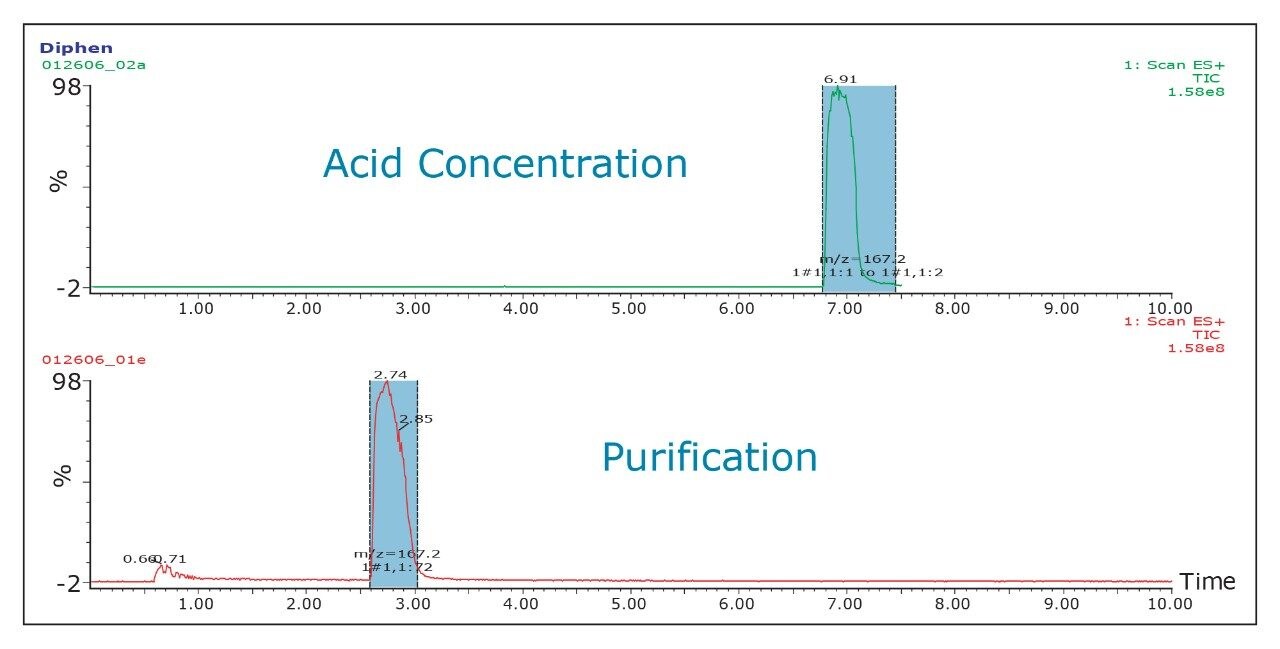
The pKa of the target compound should be considered when performing purification. The target compound should be neutral during the purification. This means that a basic compound should be run in a basic mobile phase and, conversely, an acidic target should be run in an acidic mobile phase. 

This will result in better loading and chromatography1 and will also ensure that the collected fraction is not ionized in solution. By being neutral, it is more likely to be successfully trapped during the concentration process. 

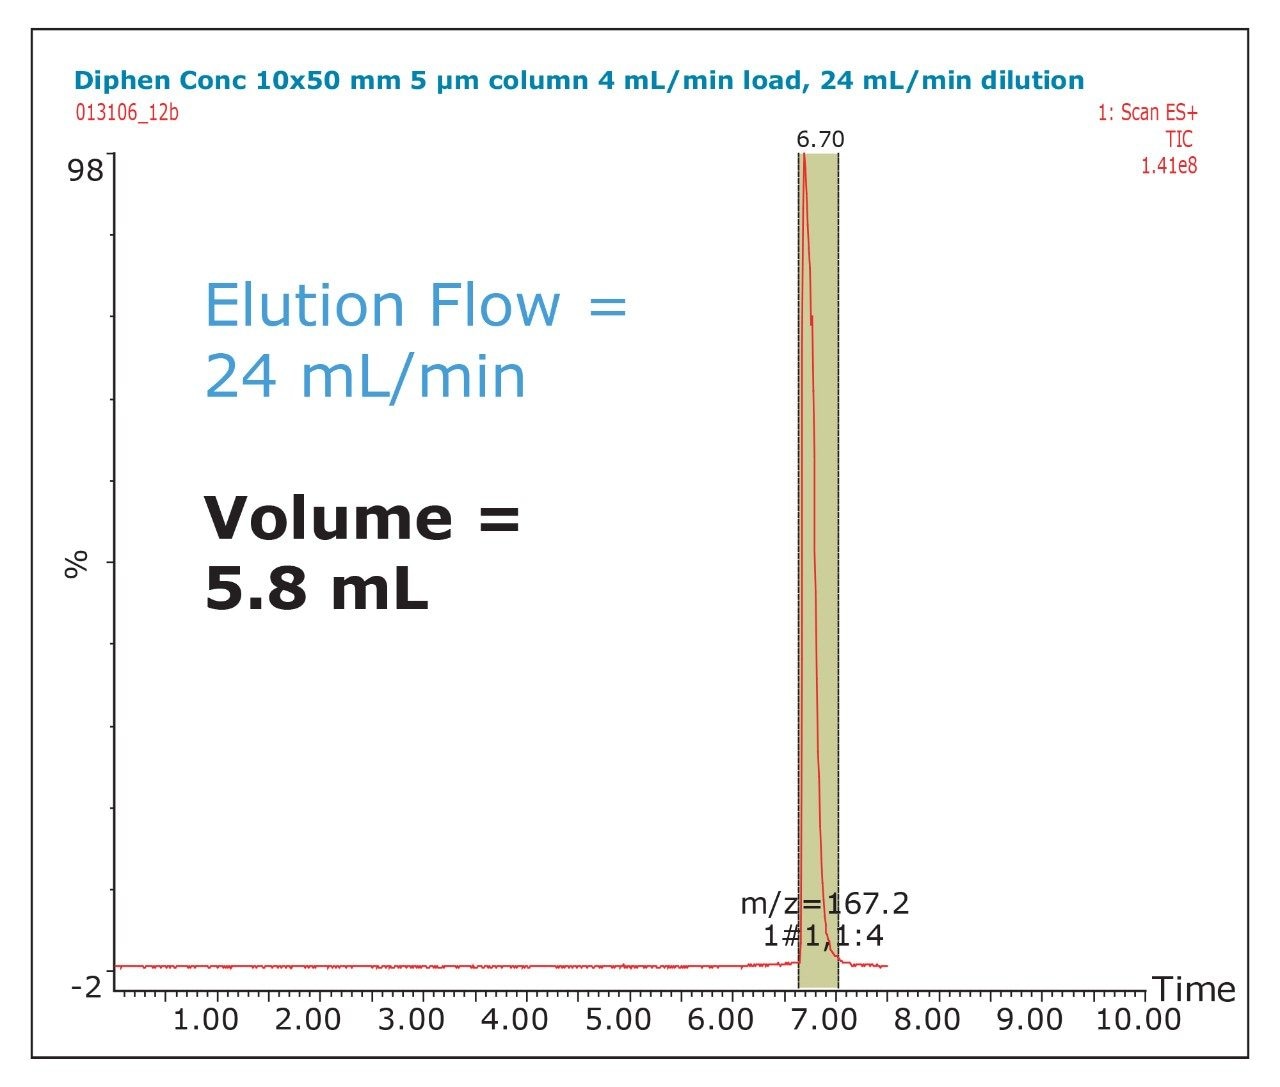
The amount of collected material, in both mass and volume, will dictate the required system configuration. The volume of the fraction will determine the size loop required. The mass of collected material will determine the column size. Both the loop and column size will determine the overall throughput of the system. 

In the examples shown, all of the concentrated fractions were triggered by MS. However, this was done only for method development purposes. It is possible to collect these fractions by UV or just by time. When collecting by time, each tube has the same volume and organic concentration, so the time required for drying is constant. With typical fractionation, each tube can have a different volume and organic concentration, so the time required for drying is variable. This variability can lead to inefficiency, by either drying too long, or by stopping too early then checking multiple tubes to find that you need to restart for only a few of the tubes. 

Dry-Down Time

Composition

Volume

Dry Down

Aqueous/Organic

5 to 30 mL

5 to 15 hours

100% organic 

1 to 3 mL

less than 30 min


Process enhancements

  • Shorter drying times equals more efficient use of the driers. 
  • Automatic pooling of multiple fraction tubes reduces the post-purification sample handling. 

References

  1. Neue UD, Wheat TE, Mazzeo JR, Mazza CB, Cavanaugh JY, Xia F, Diehl DM. J. Chrom. A. 2004; 1030: 123-134. 

Acknowledgements

  • Ian Sinclair, AstraZeneca 
  • Giovanni Gallo, Waters, Manchester, UK 
  • Paul Rainville, Waters, Milford, MA 

Featured Products

720002097, June 2007

Haut de la page Haut de la page