For research use only. Not for use in diagnostic procedures.
- Main
-
For research use only. Not for use in diagnostic procedures.
Margaret Maziarz, Stephanie Harden, Paul Rainville
Waters Corporation, United States
Published on May 06, 2026
For research use only. Not for use in diagnostic procedures.
Polysorbate 80 is a widely used surfactant and emulsifier in pharmaceutical, food, and cosmetic products. To ensure the safety and quality of finished products, its raw materials must undergo rigorous testing. In this study, a high-performance liquid chromatography (HPLC) method coupled with a Charged Aerosol Detector (CAD) was developed for the analysis of fatty acids in polysorbate 80. The chromatographic separation was performed on an XBridge™ BEH™ C18 Column using a mobile phase consisting of 0.05% formic acid in water and acetonitrile solvent, run on an Arc™ HPLC System. The detector settings, including the evaporator temperature, filter time constant and power function value, were investigated during the study to optimize method sensitivity and performance. Linearity was demonstrated using a linear fit with 1/x weighting over a 0.05 to 25 µg/mL concentration range. The quantification limits ranged from 0.9 to 3.5 ng on column. A relative standard deviation (RSD) of ≤ 0.48% for peak areas was achieved for fatty acids. Different batches of the polysorbate 80 samples were analyzed through a saponification with potassium hydroxide to release fatty acids, followed by an extraction, drying, and reconstitution prior to analysis. The composition of fatty acids was determined by comparing peak area of each acid to the total peak area of all the fatty acids.
Polysorbate 80, also known as Tween® 80, is a common non-ionic surfactant widely used in the preparation of pharmaceutical, food and cosmetic products.1-4 As an excipient or inactive ingredient in drug products, liquid medications, injectable formulations and vaccines, it is used to enhance the solubility of poorly soluble drugs and protein-based therapeutics. In foods and cosmetic products, it functions as a solubilizer and emulsifier, enabling the efficient mixing of oils and water.
Polysorbate 80 is a mixture of saturated and unsaturated fatty acid esters and sorbitol anhydrides, copolymerized with approximately 20 moles of ethylene oxide.2-4 The complex heterogenous structure and lack of strong chromophore pose challenges for the quality control of polysorbate 80 raw materials. The U.S. Pharmacopoeia (USP) recommends a gas chromatography (GC) with flame ionization detection (FID) procedure for the composition of fatty acids and involves reflux reaction with boron trifluoride-methanol solution and heptane.5 This is a complex procedure that can limit throughput and efficiency in quality control. Several other techniques have been employed for the characterization and quantification of polysorbate 80 using liquid chromatography coupled with various detectors including refractive index (RI), evaporative light scattering detection (ELSD), and high-resolution mass spectrometry.2-3 However, these detectors have inherent limitations for chromatographic analysis, such as reduced linearity and poor reproducibility in ELSD, or low sensitivity and incompatibility with gradients in RI.6-8 The high-resolution mass spectrometry is complex to use, and the analysis of complex data is a time-consuming task.
CAD has become a valuable and reliable tool for analysis of a wide range of non-volatile and semi-volatile compounds with poor or no chromophore.6-9 Waters has developed a CAD designed to work with Waters LC systems and Empower Software for seamless integration into regulated workflows. In addition, detector response can be optimized through software-controlled parameters such as Power Function Value (PFV), that support optimization of detector response and dynamic range across complex sample matrices—an important consideration for quantitative analysis of heterogeneous excipients such as polysorbate 80. In this work, a reliable HPLC method integrated with CAD was developed for the analysis of fatty acids in polysorbate 80.
Fatty acids were purchased from Sigma and Nu-Chek Prep, Inc. Acetonitrile LC/MS grade, formic acid LC/MS grade, tert-butyl methyl ether (MTBE) 99.0+%, and potassium hydroxide 99.98% were obtained from Fisher Chemicals. Water from a Milli-Q® Purification System was used during the study. Polysorbate 80 raw materials were purchased from Sigma.
Fatty acid stock standard solutions were prepared in methanol at 1 mg/mL concentrations and stored in a freezer at -20 °C. Stock standard solutions were diluted with a mixture of water/acetonitrile (25:75, v/v) to make solutions for the system suitability test (10 µg/mL), linearity (0.05–25 µg/mL), and LOQ determination (0.025–0.05 µg/mL).
Sample preparation was carried out following a procedure described in a previously published study.4 Polysorbate 80 raw material samples were prepared in 90:10 of 1 M potassium hydroxide (KOH)/methanol at 1.5 mg/mL and incubated for 6 hours at 40 °C. After saponification, 250 µL of sample solution was transferred to a glass centrifuge tube, followed by an addition of 50 µL of 100% formic acid, and 500 µL of MTBE. The mixture was vortexed and centrifuged at 2700 rpm for 5 minutes. The organic layer was collected and dried under a gentle nitrogen gas. The residue was reconstituted with diluent (water/acetonitrile, 25/75). All test sample solutions were filtered through GHP syringe filters (Waters, p/n: WAT200556) prior to analysis.
|
LC system: |
Arc HPLC System with Column Heater/Cooler and Active Pre-heater |
|
Detection: |
Waters Charged Aerosol Detector10 |
|
Vials: |
LCMS Maximum Recovery 2 mL volume (Waters, p/n: 600000670CV) |
|
Column(s): |
XBridge BEH C18 Column, 4.6 x 100 mm, 3.5 µm (Waters, p/n:186003033) |
|
Column temperature.: |
60 °C |
|
Sample temperature.: |
10 °C |
|
Injection volume: |
35.0 µL |
|
Flow rate: |
1.5 mL/min |
|
Mobile phase: |
Solvent A: 0.05% formic acid in water Solvent B: 0.05% formic acid in acetonitrile |
|
Wash solvents: |
Purge/Sample Wash: 50:50 water/acetonitrile Seal Wash: 90:10 water/acetonitrile |
|
Power function value (PFV): |
1.00 |
|
Sampling rate: |
10 pts/sec |
|
Filter time constant: |
1.4 seconds |
|
Evaporator temperature.: |
25°C |
|
Ion trap voltage: |
20 V |
Data Analysis: Empower 3.6.0 was used for data acquisition, processing and reporting.
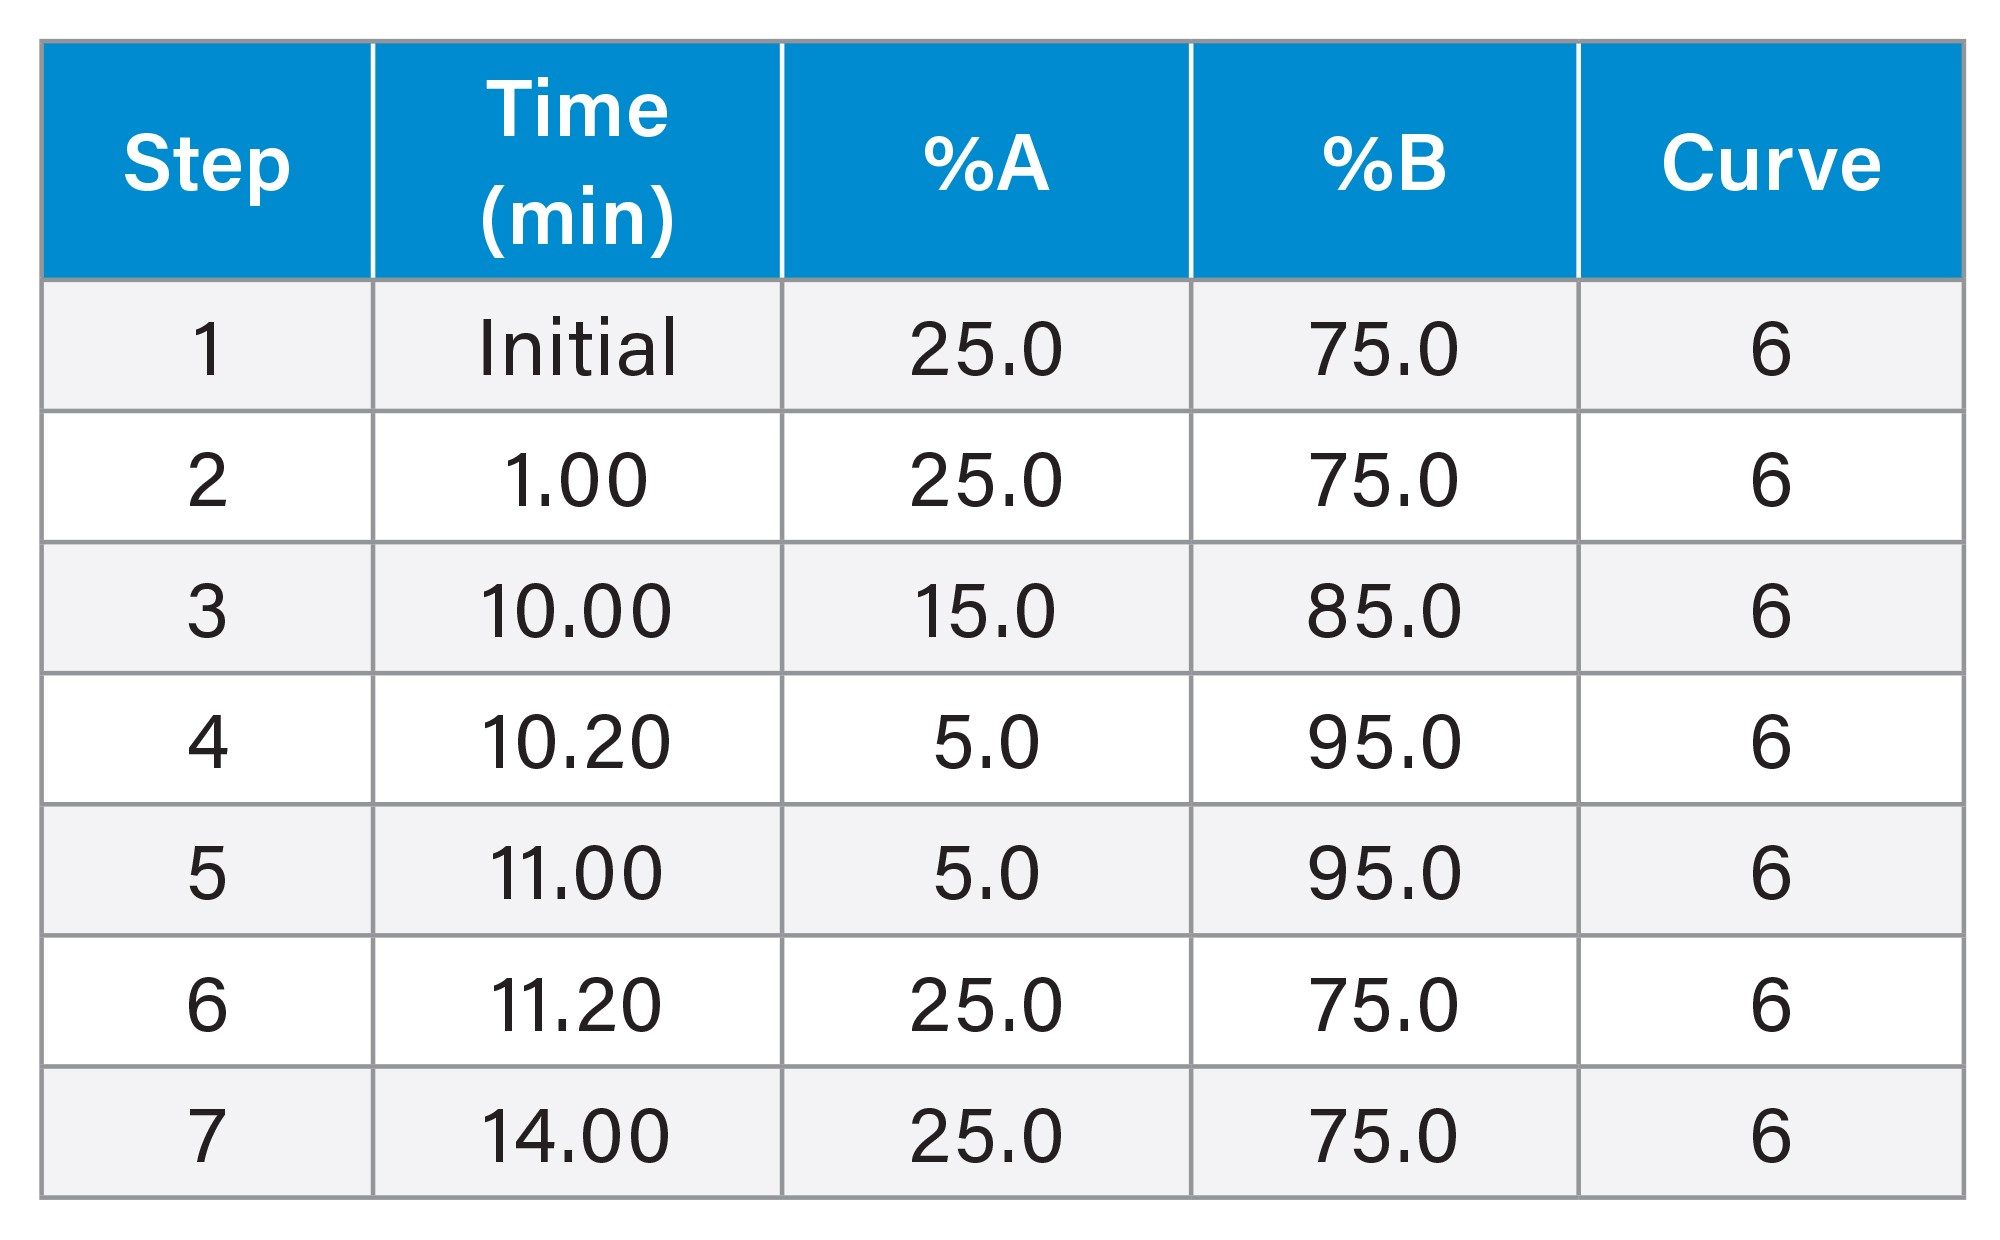
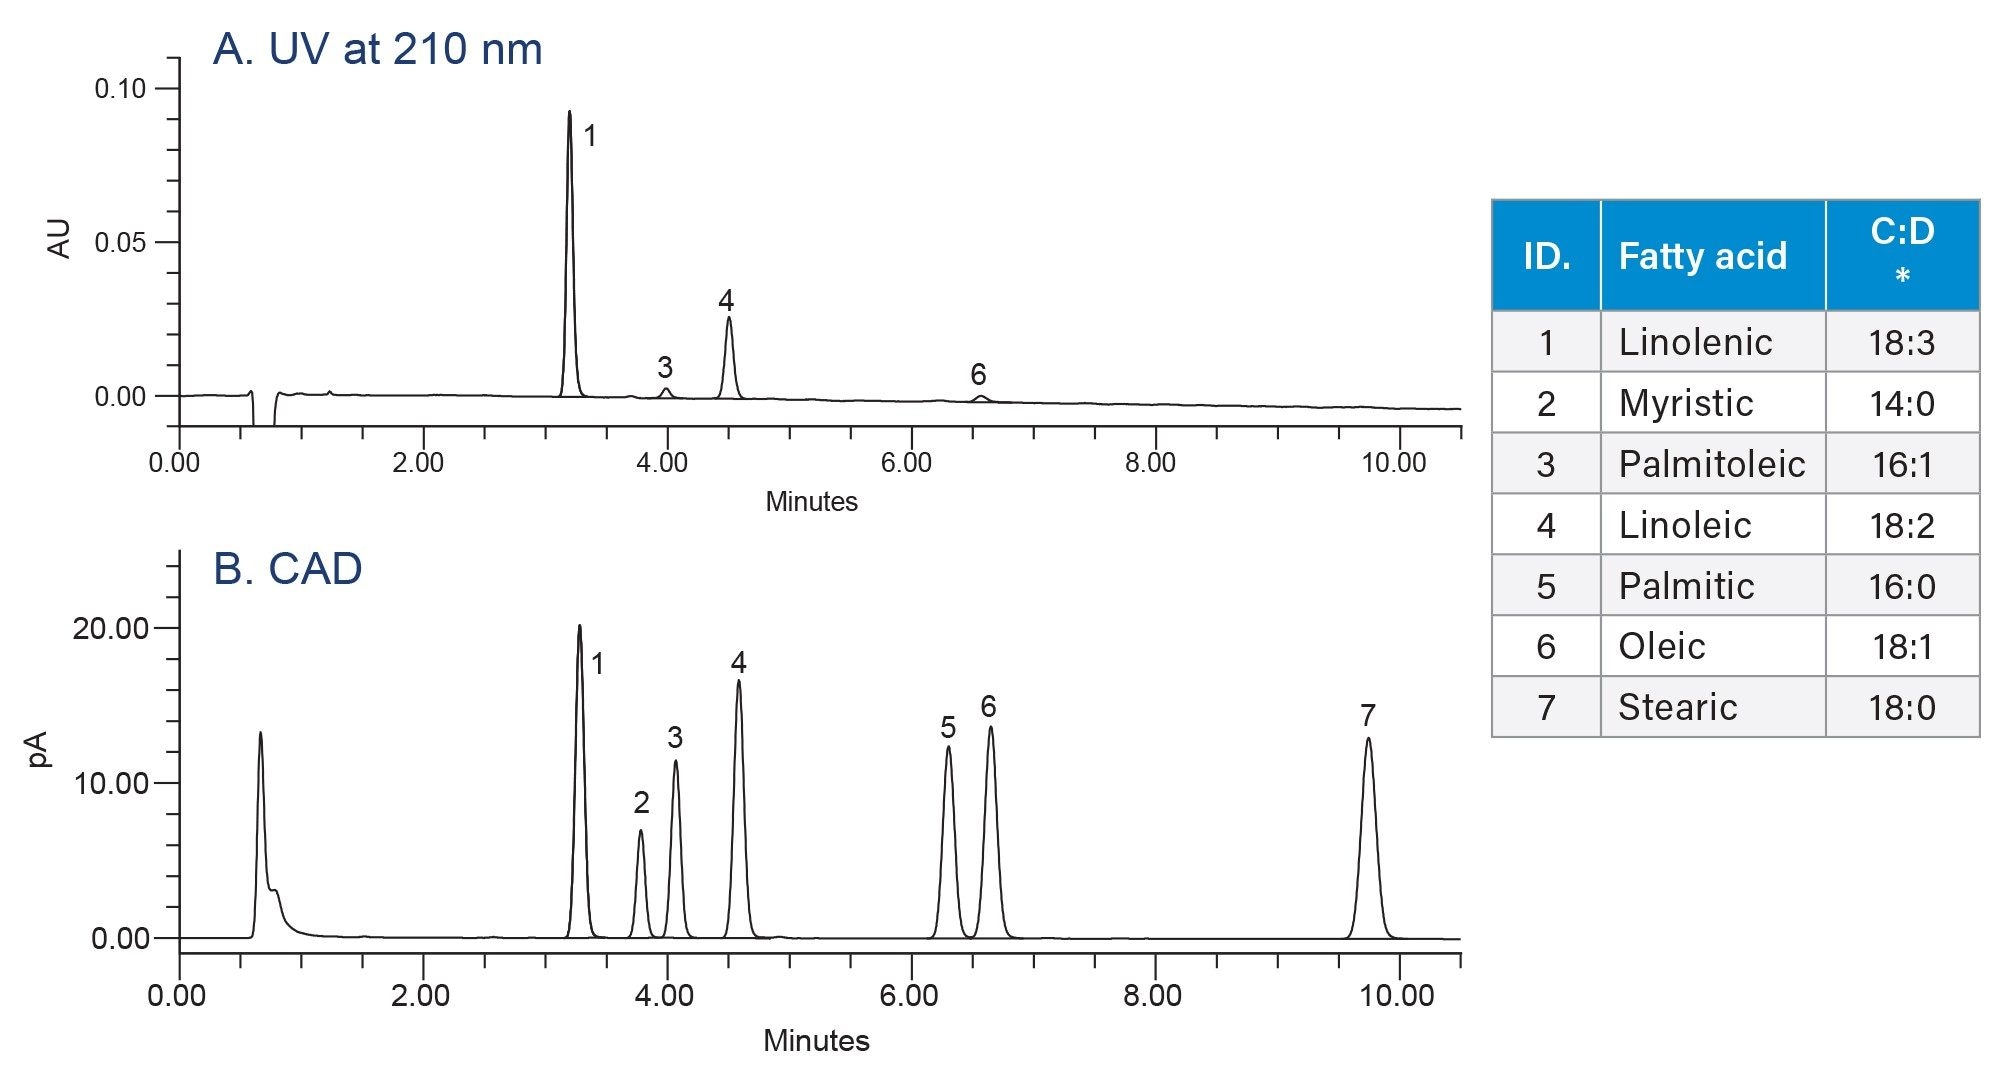
The XBridge BEH C18 Column with acidic mobile phase consisting of water and acetonitrile solvent successfully separated all fatty acids associated with the polysorbate 80 (Figure 1). Fatty acids lack a strong chromophore required for UV detection but produce a robust signal with CAD.
CAD works by measuring the total charge carried by dried analyte particles.6-8 Signal generation is a multi-step process that includes nebulization of the mobile phase, followed by removal of mobile phase and charging through interaction with ions generated by a corona discharge. The charge is then measured using an electrometer. The intensity of the signal is proportional to the dried particle size, with larger particles resulting in higher signal.
The detector parameters including evaporator temperature, time filter constant, and power function were evaluated during the method development to maximize sensitivity and method performance.
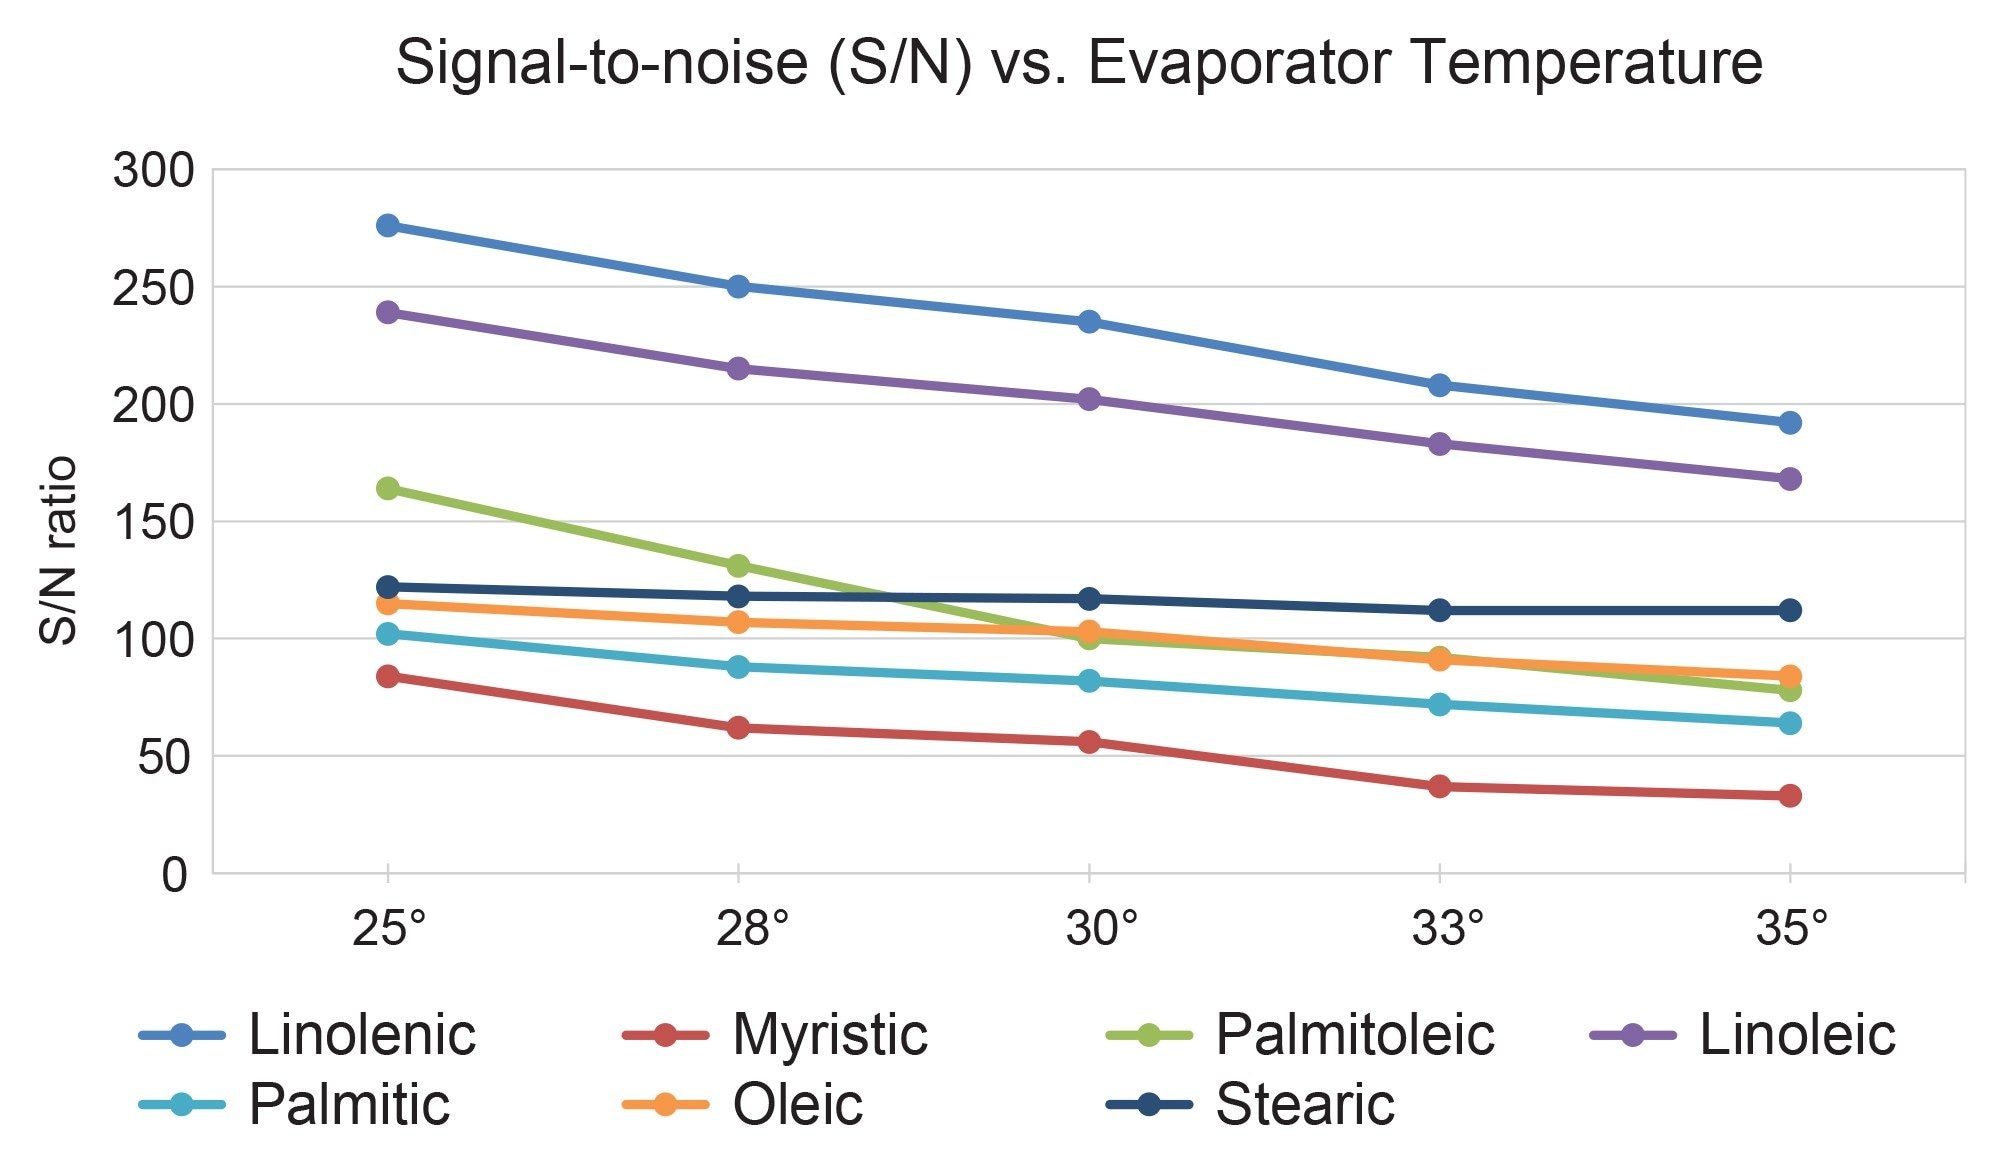
The evaporator temperature controls the temperature of the thermostatted evaporation tube in which the mobile phase is evaporated.6-8 After mobile phase evaporates, the analyte particles are charged and produce a signal in form of a current. Non-volatile compounds generally produce stronger signals compared to semi-volatile compounds. Higher evaporator temperatures can cause loss of semi-volatile compounds, such as fatty acids, producing weaker signals.
In this study, the effect of evaporator temperature on the fatty acids was investigated by calculating the signal-to-noise (S/N) ratios using a standard mixture at 0.5 µg/mL in 25:75 water/acetonitrile. The correlation of the S/N and the evaporator temperature settings of 25 to 35 °C range demonstrated that the signal decreased with increase of the evaporator temperature (Figure 2). An evaporator temperature of 25 °C produced the highest signal for all fatty acids.
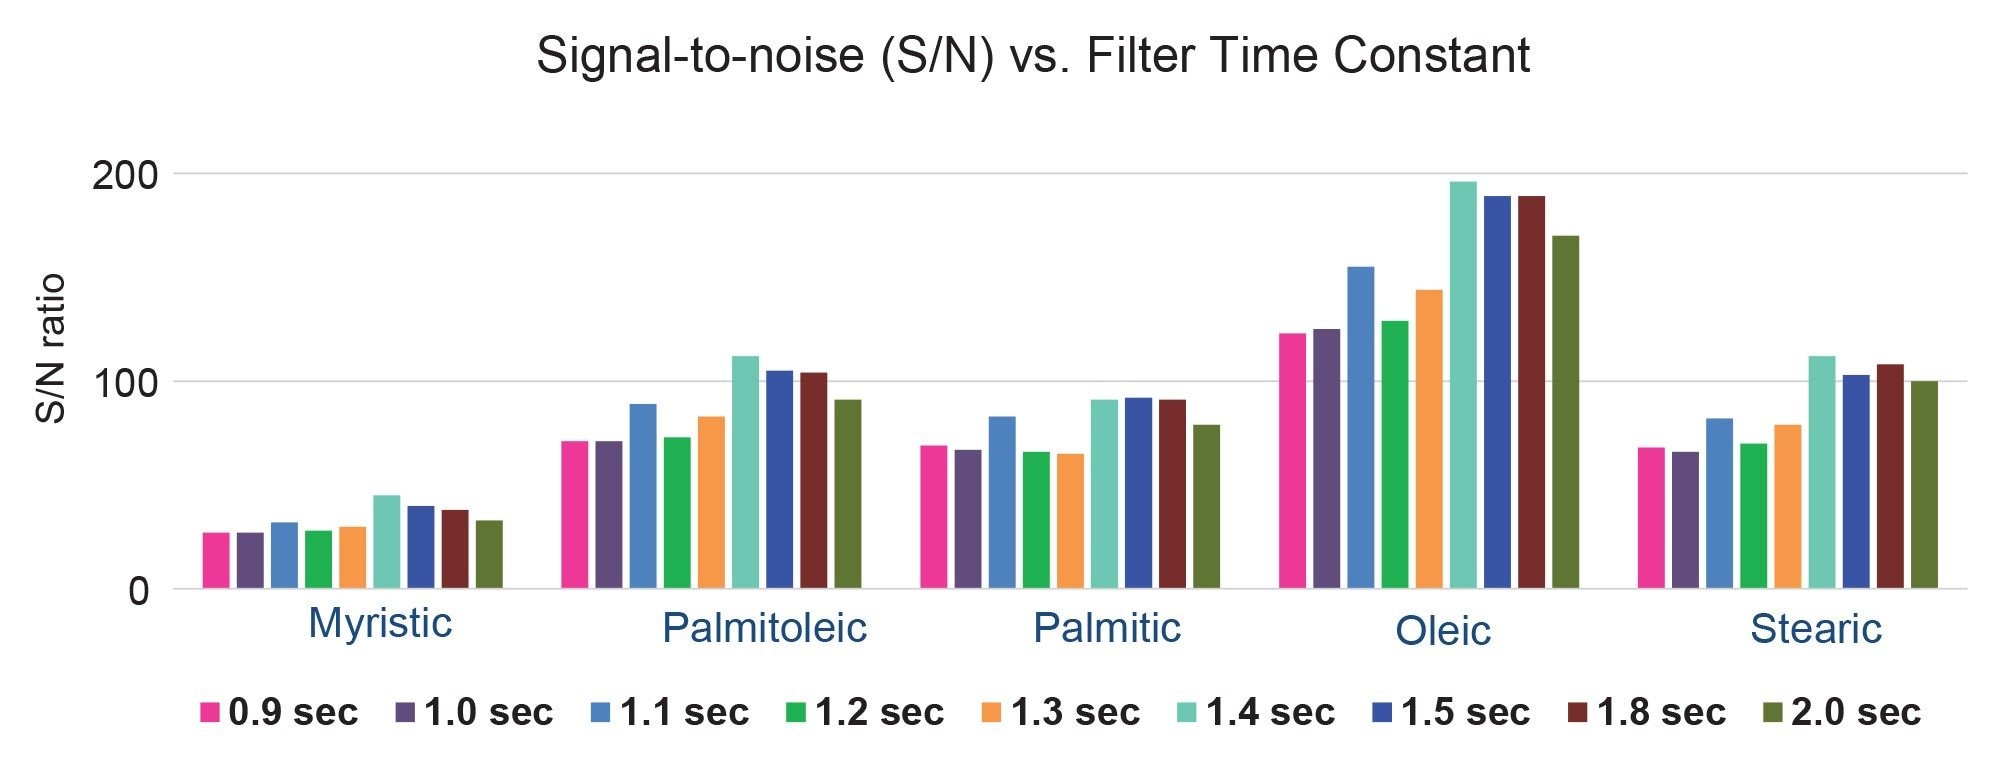
The filter time constant values investigated in this study ranged from 0.8 to 2.5 seconds. The S/N ratios were calculated to examine the impact of the time filter constant on the signal of fatty acids. An optimization of the filter time constant demonstrated for myristic, palmitoleic, palmitic, oleic and stearic acids showed that 1.4 seconds produced highest S/N ratio for fatty acids (Figure 3).
The power function value (PFV) is related to the signal output and can be used to optimize a non-linear CAD response through digital signal processing. 6-8
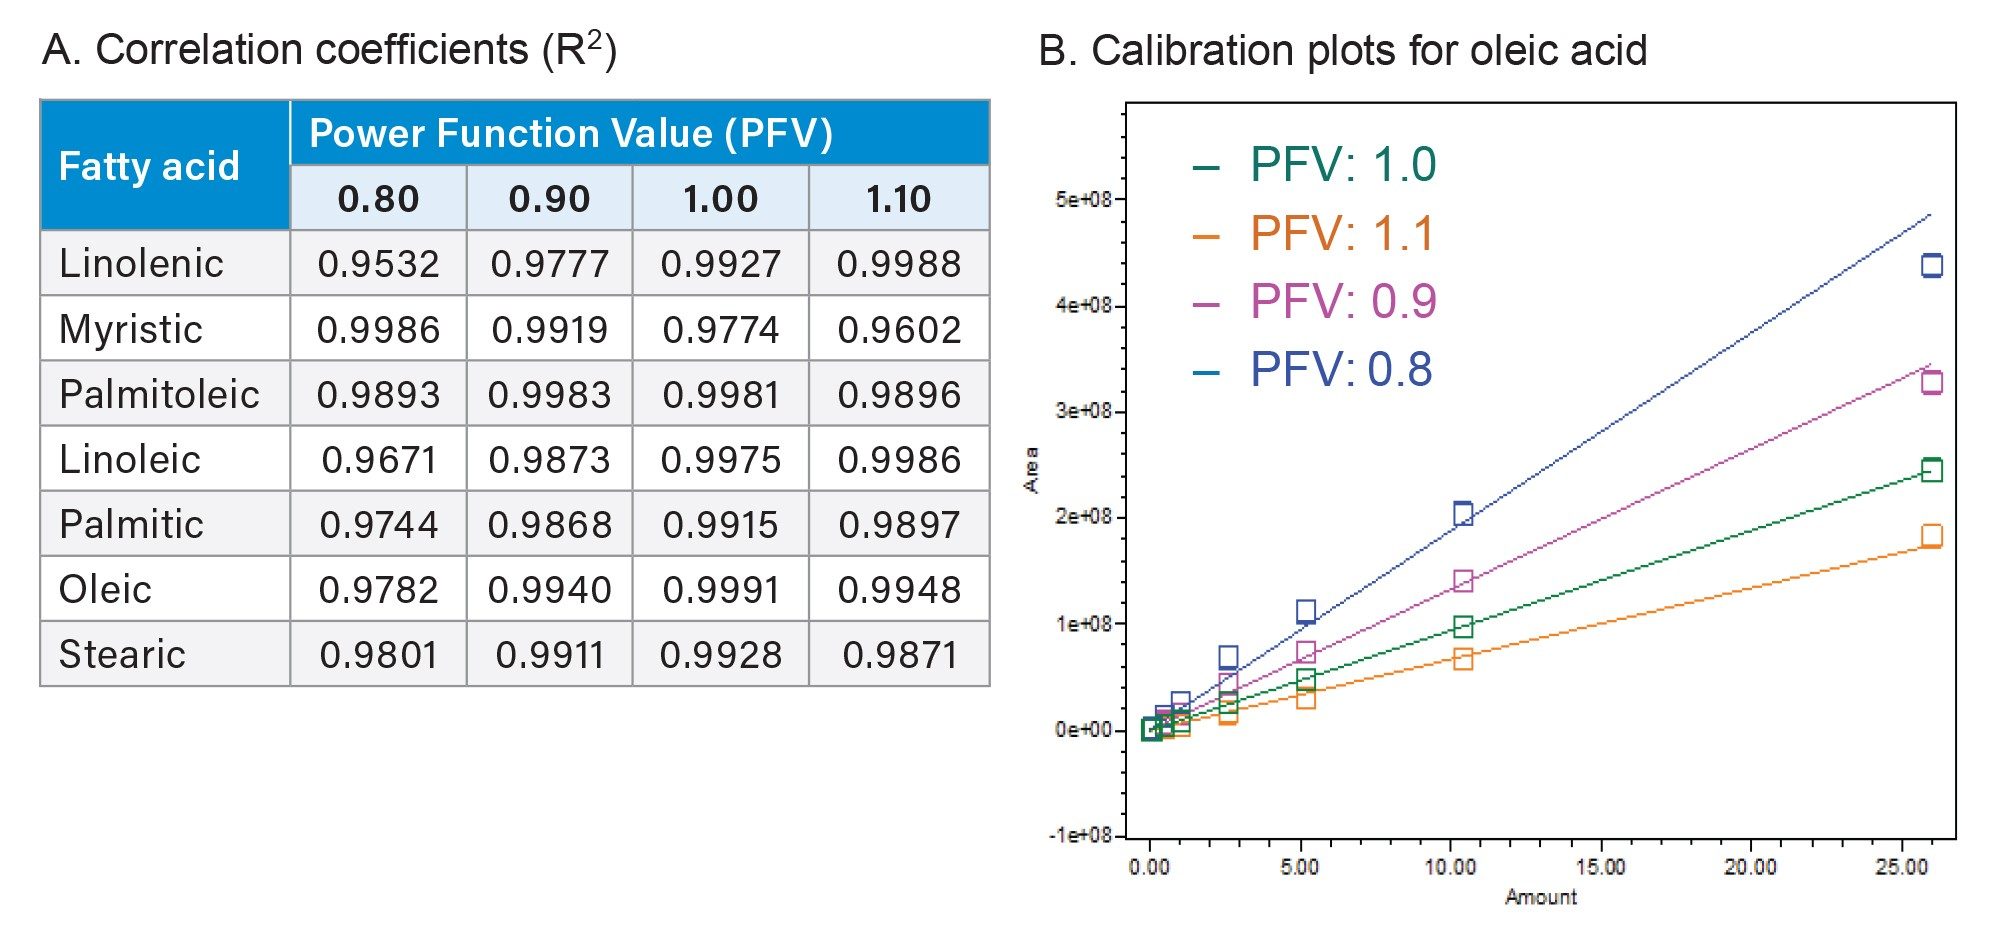
In this study, the impact of PFV on linearity of fatty acids was investigated experimentally by injecting standards ranging from 0.05 to 25 µg/mL concentration. Four different settings were configured in the Empower instrument method for a single injection including 0.80, 0.90, 1.00, and 1.10. Calibration curves were generated by processing data with each PFV using a linear fit with 1/x weighting (Figure 4). A PFV of 1.00 produced a correlation coefficient of (R2) ≥ 0.99 for most fatty acids, except for a myristic acid. A calibration plot for oleic acid demonstrated best linear response with PFV of 1.00.
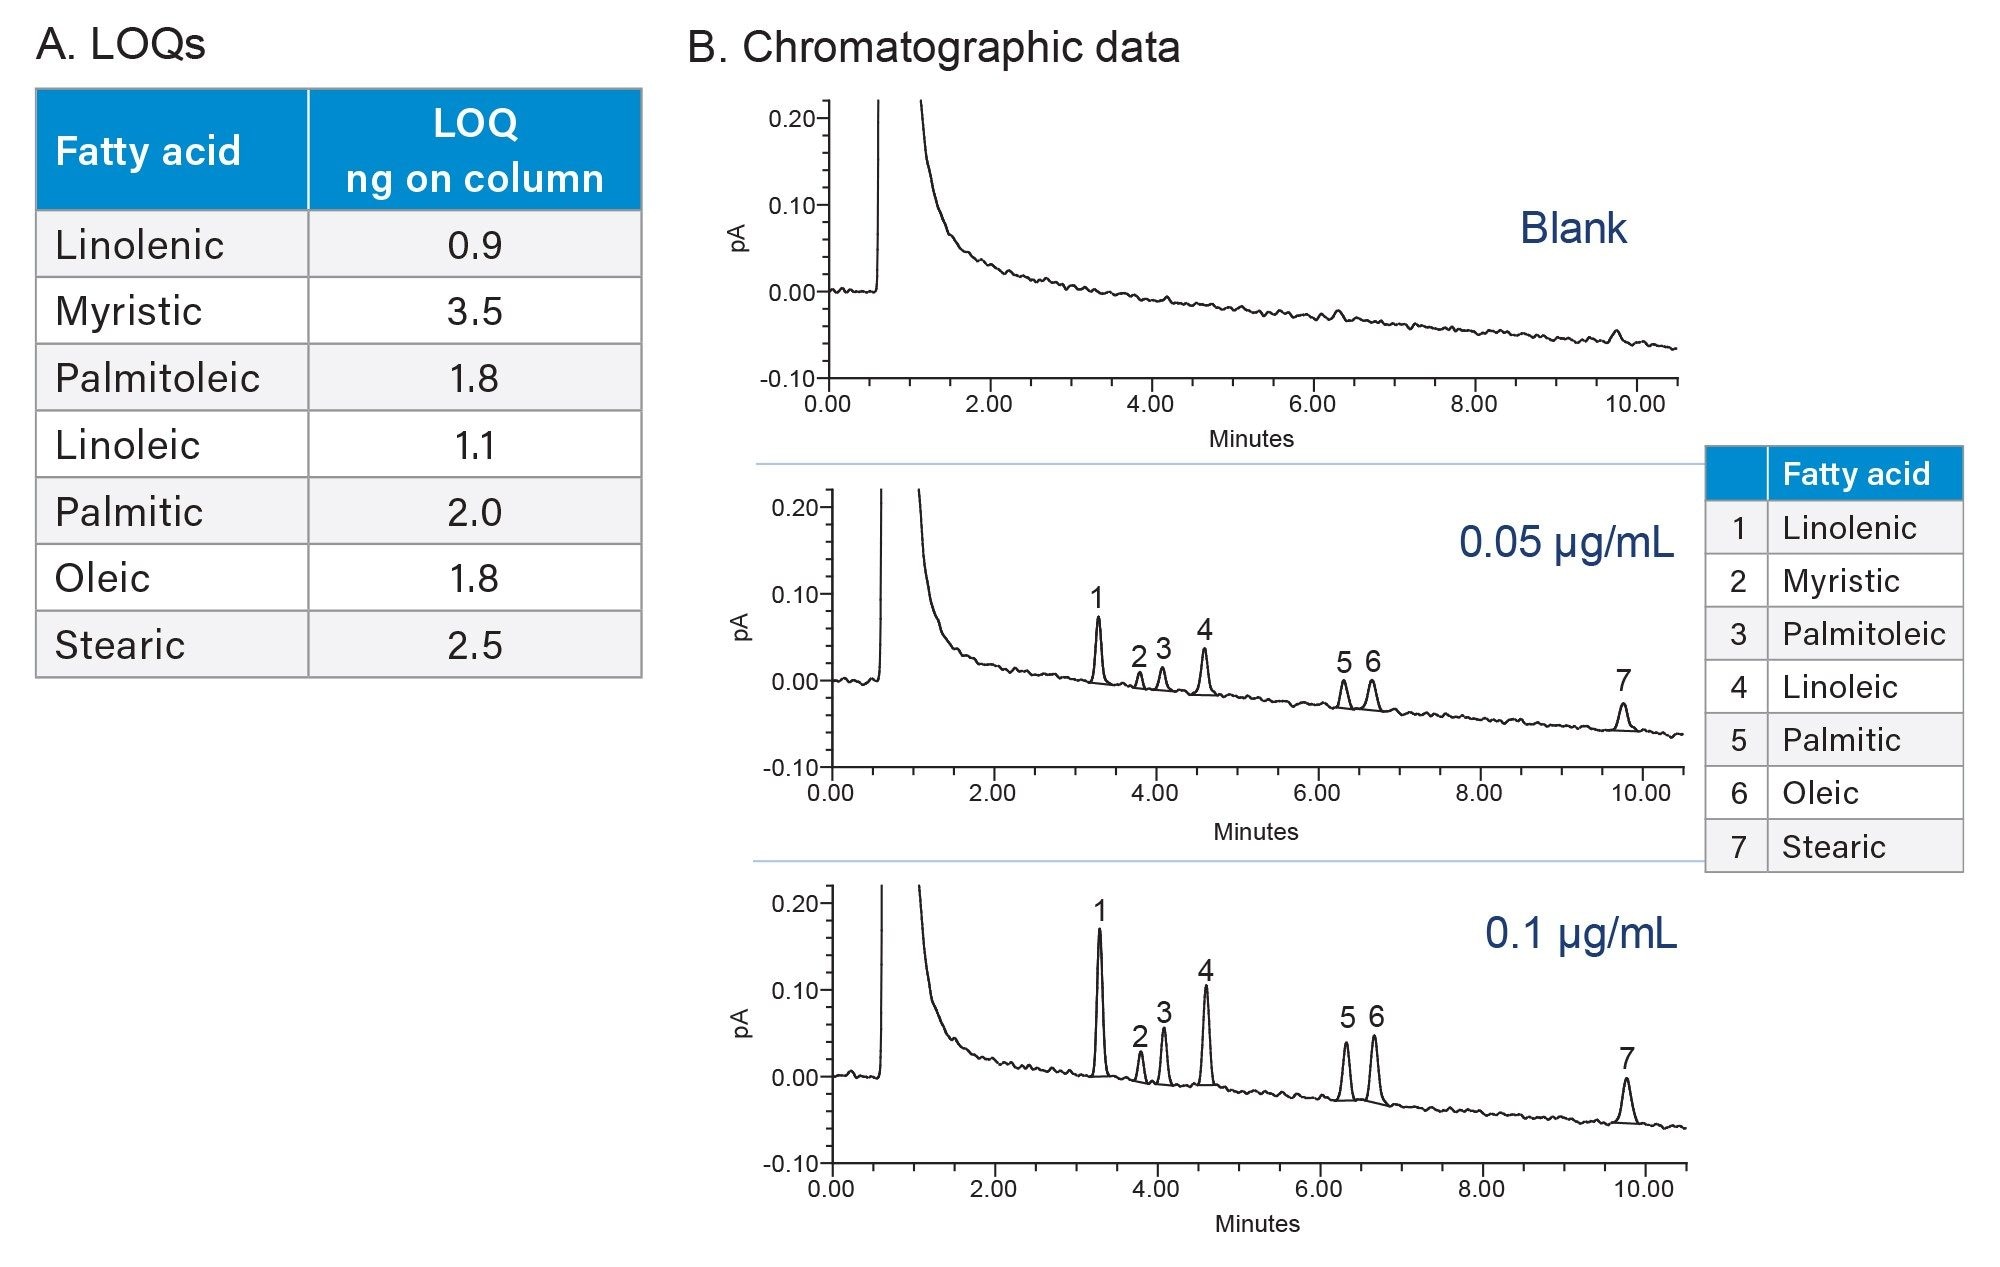
LOQ were determined using the S/N criteria of 10:1 based on data from six replicate injections, acquired using the optimized detection parameters. The LOQ for fatty acids ranged from 0.9 to 3.5 ng on column (Figure 5).
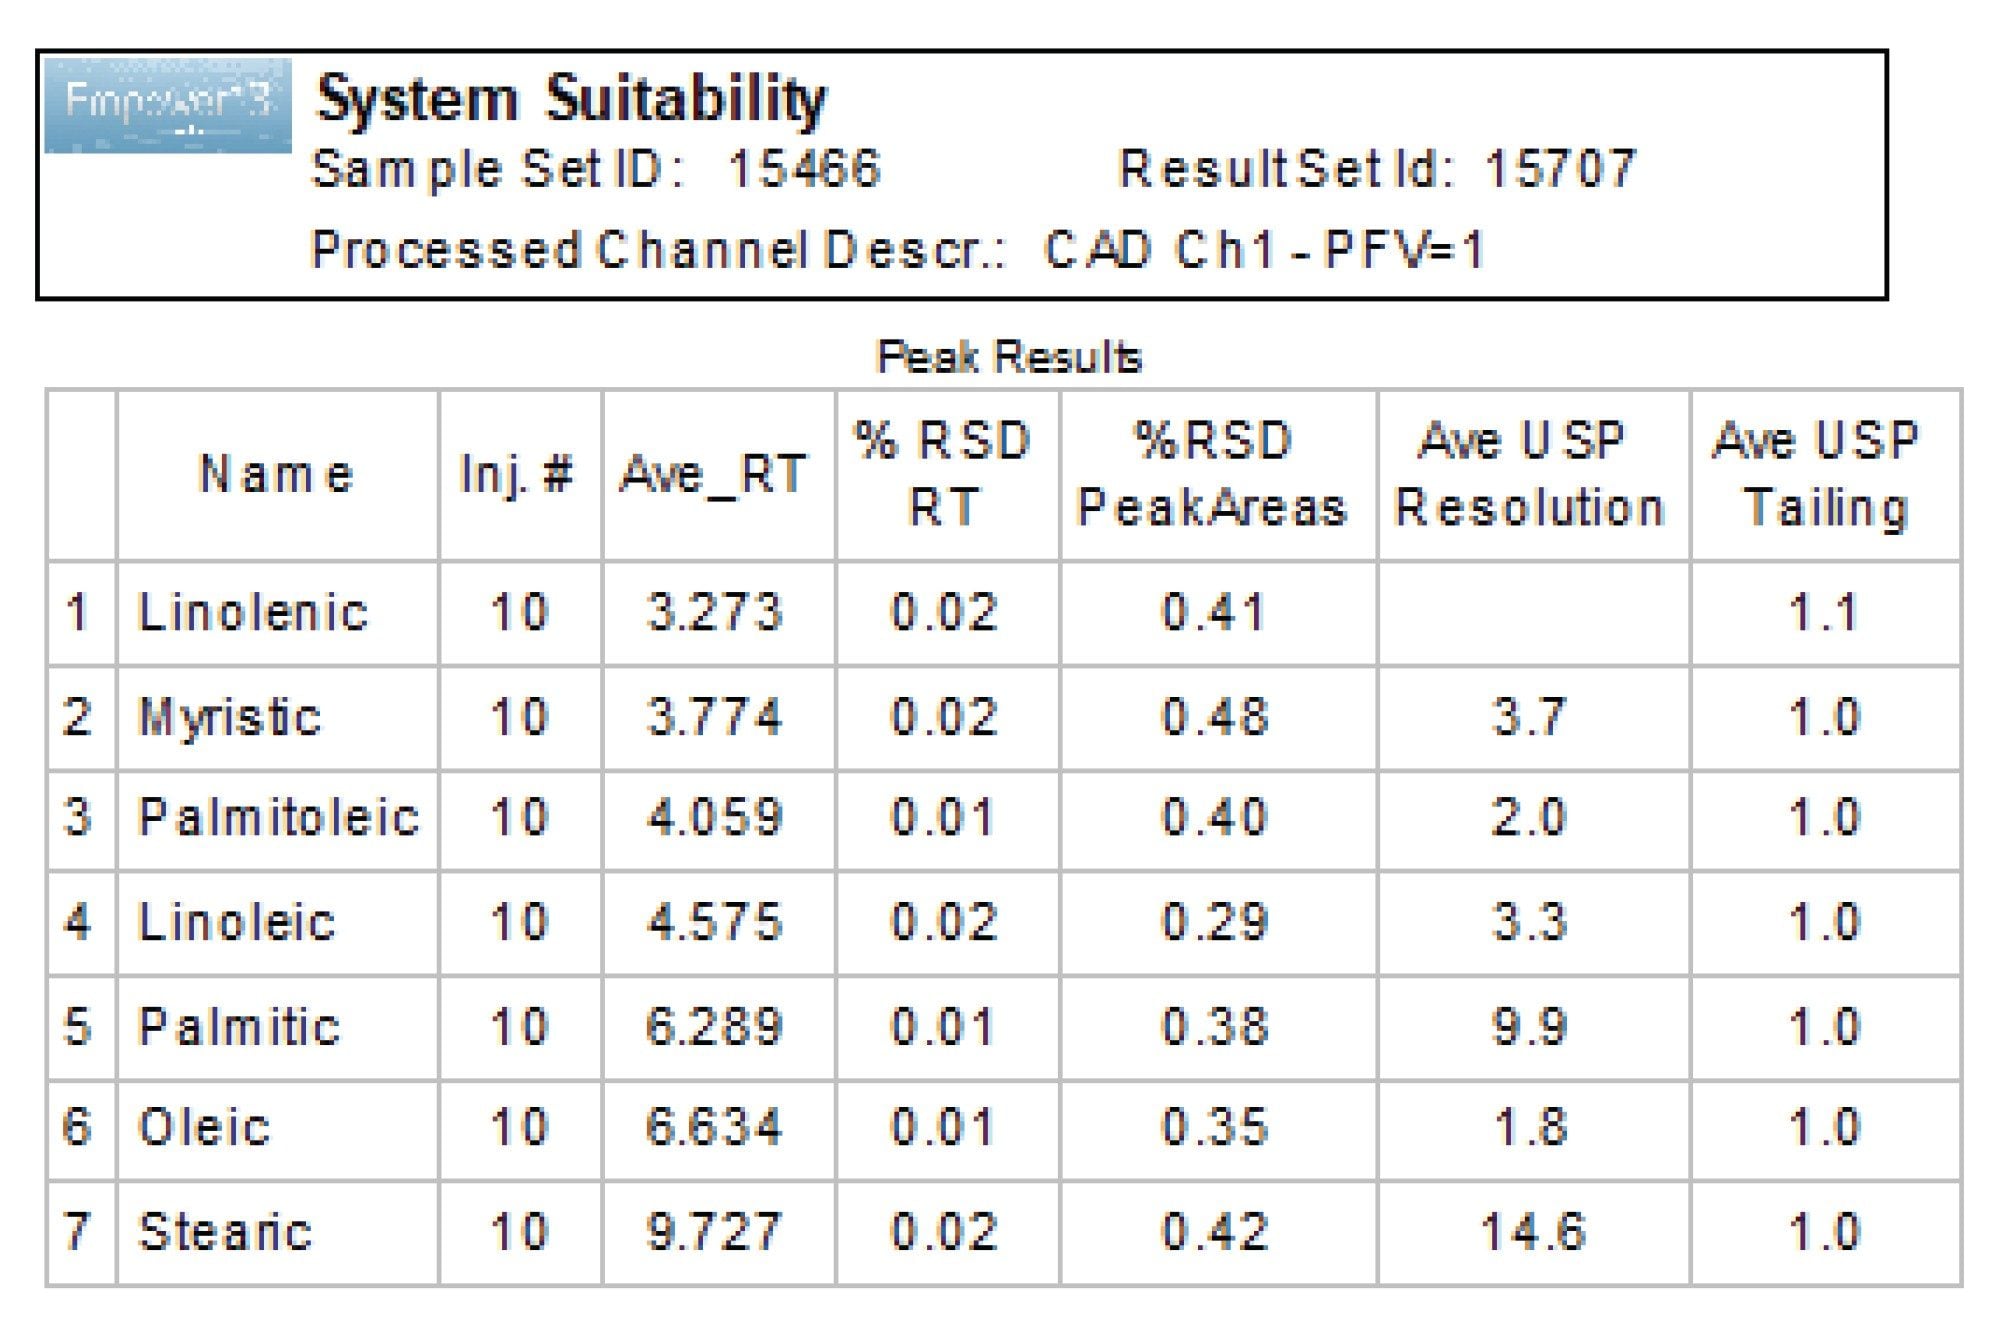
System suitability verifies performance and readiness of the chromatographic system and injection repeatability.
Ten replicate injections of a standard solution containing 10 µg/mL of each fatty acid were evaluated for repeatability of peak areas and retention times achieved with CAD (Figure 6). The %RSD of peak areas and retention times were ≤ 0.48% and ≤ 0.02%, respectively.
The polysorbate 80 samples were analyzed for composition of fatty acids. The preparation procedure involved a multi-step process including saponification with KOH to release fatty acids, neutralization with formic acid, extraction with MTBE and reconstitution of residue dried under stream of nitrogen.
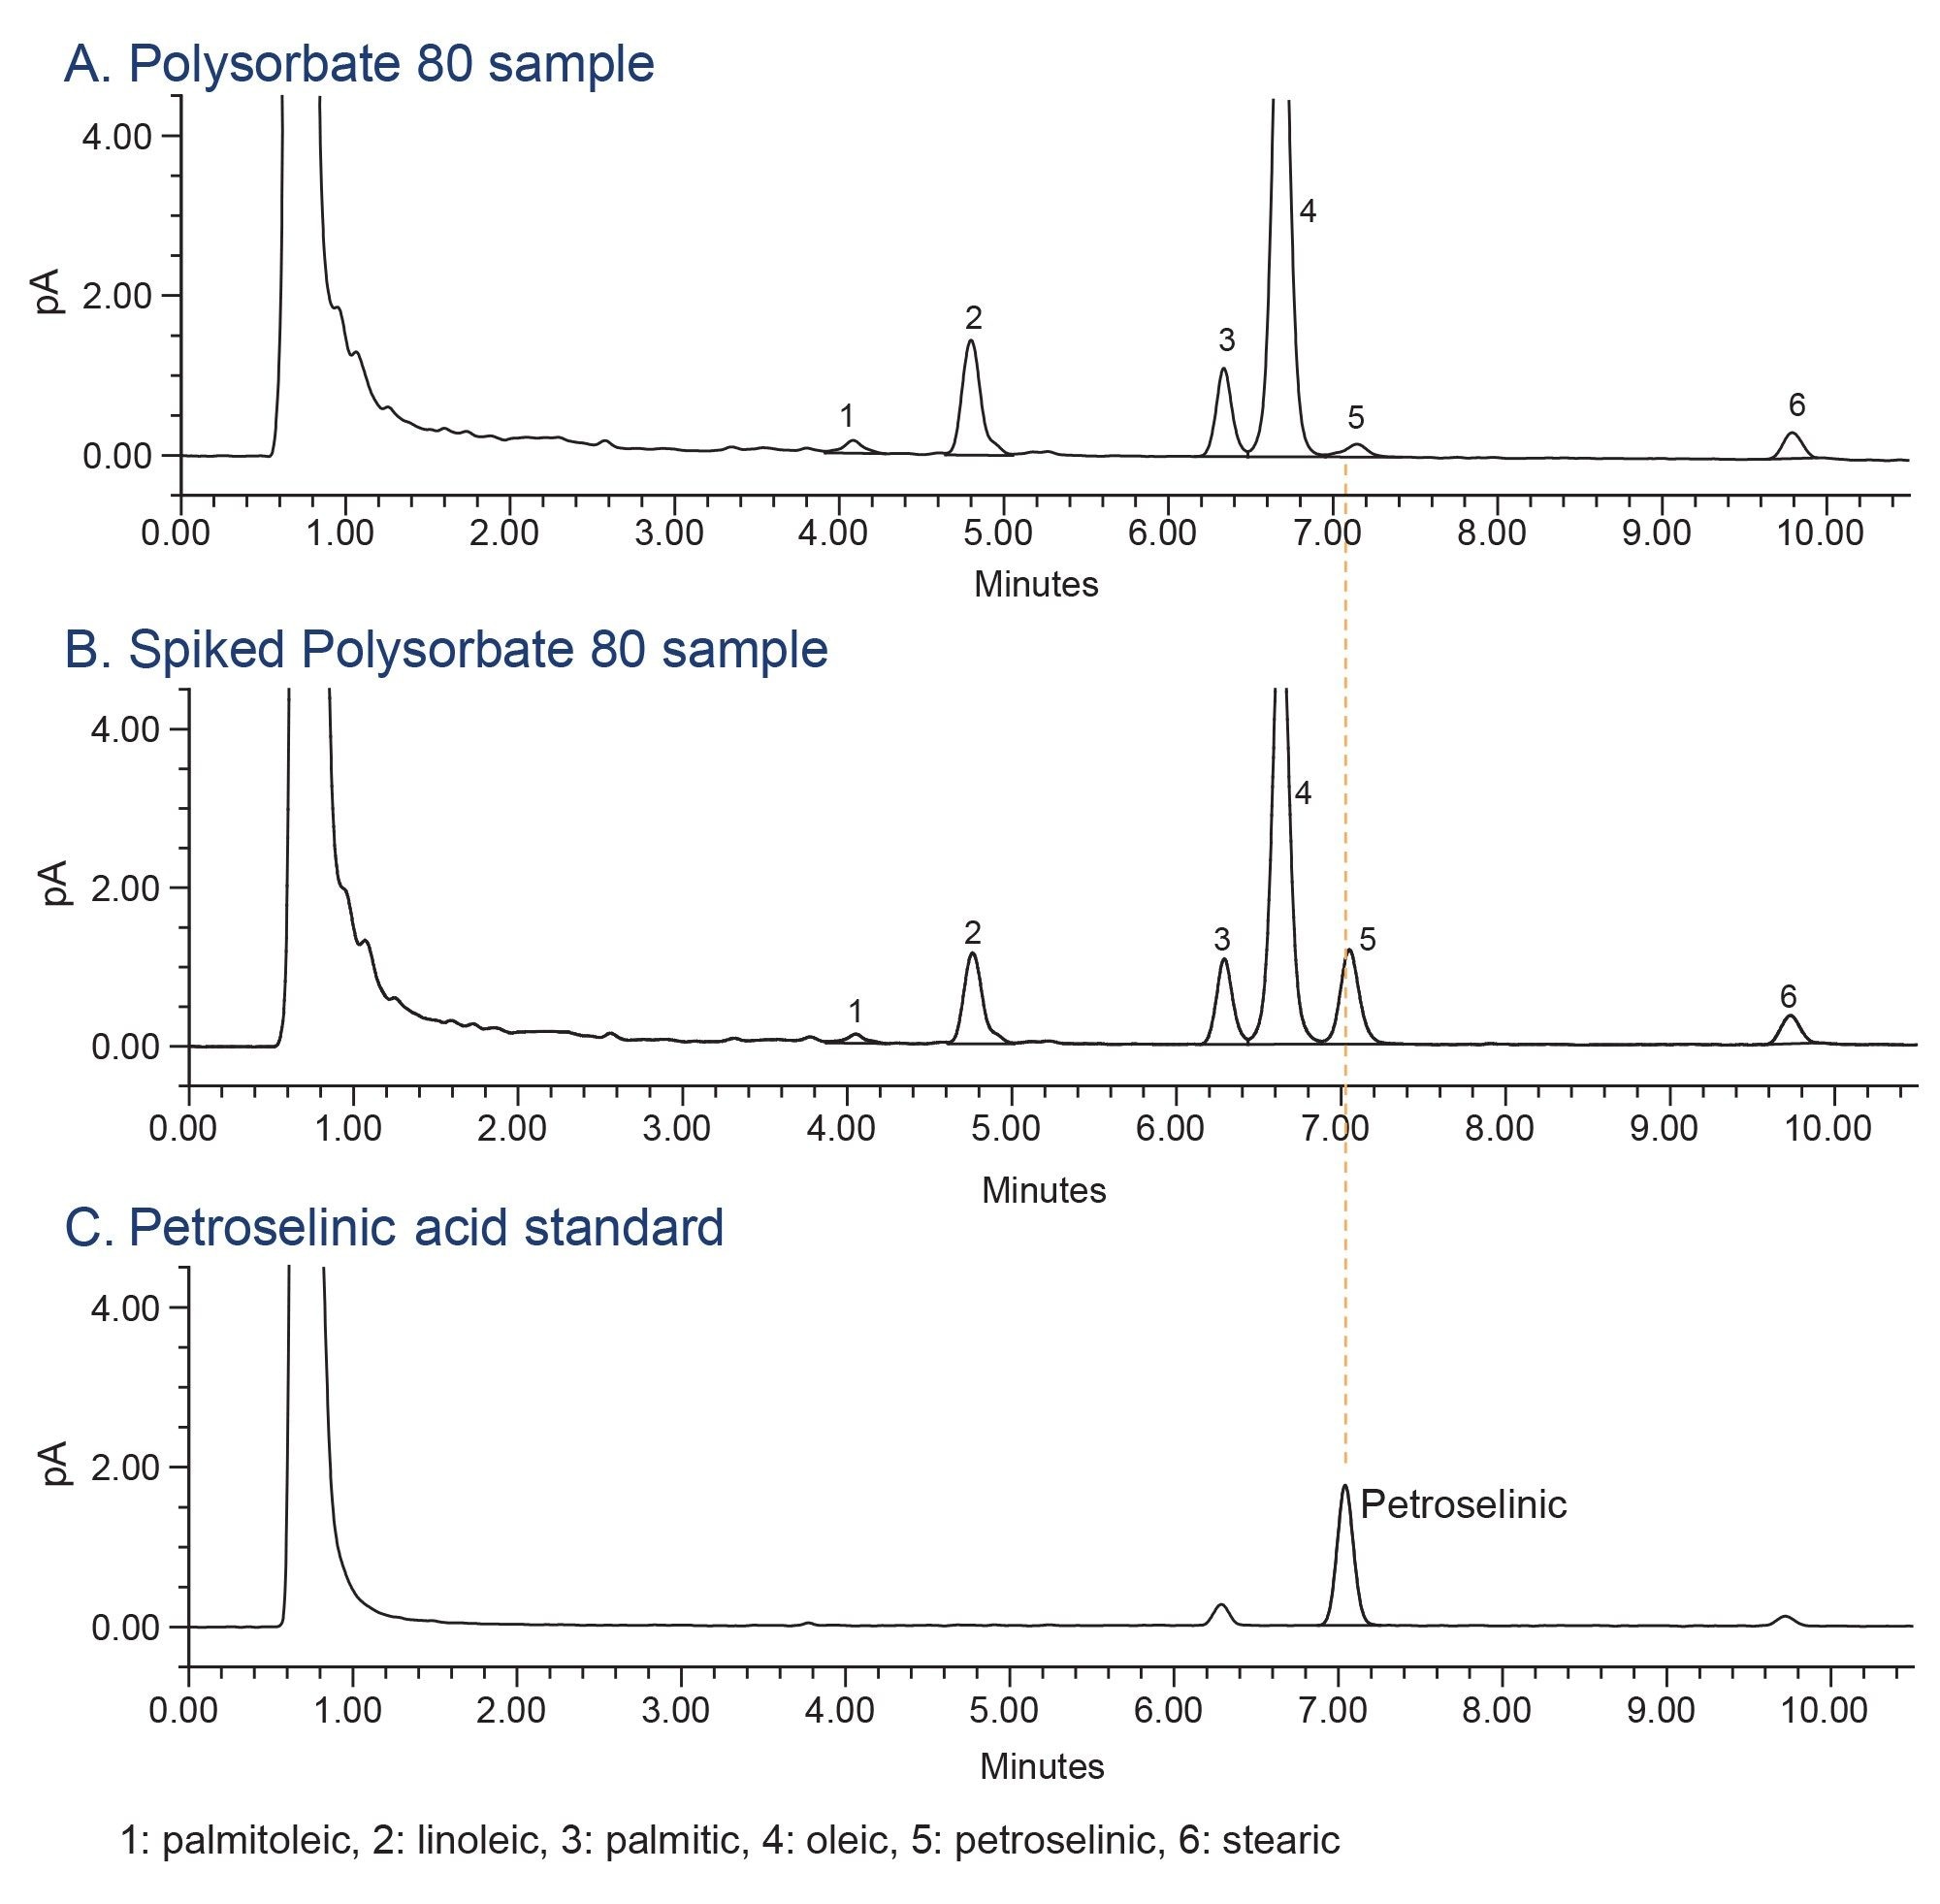
The analysis of different polysorbate 80 raw materials revealed presence of an additional peak eluting after oleic acid (Figure 7). A previously published study identified this peak as a petroselinic acid.4 To confirm the identity, a polysorbate sample solution was spiked with a petroselinic acid standard and compared with the injections of an un-spiked test sample and a standard solution (Figure 7). Based on the retention time and area increase in the spiked test sample, it was concluded that the addition peak is petroselinic acid.
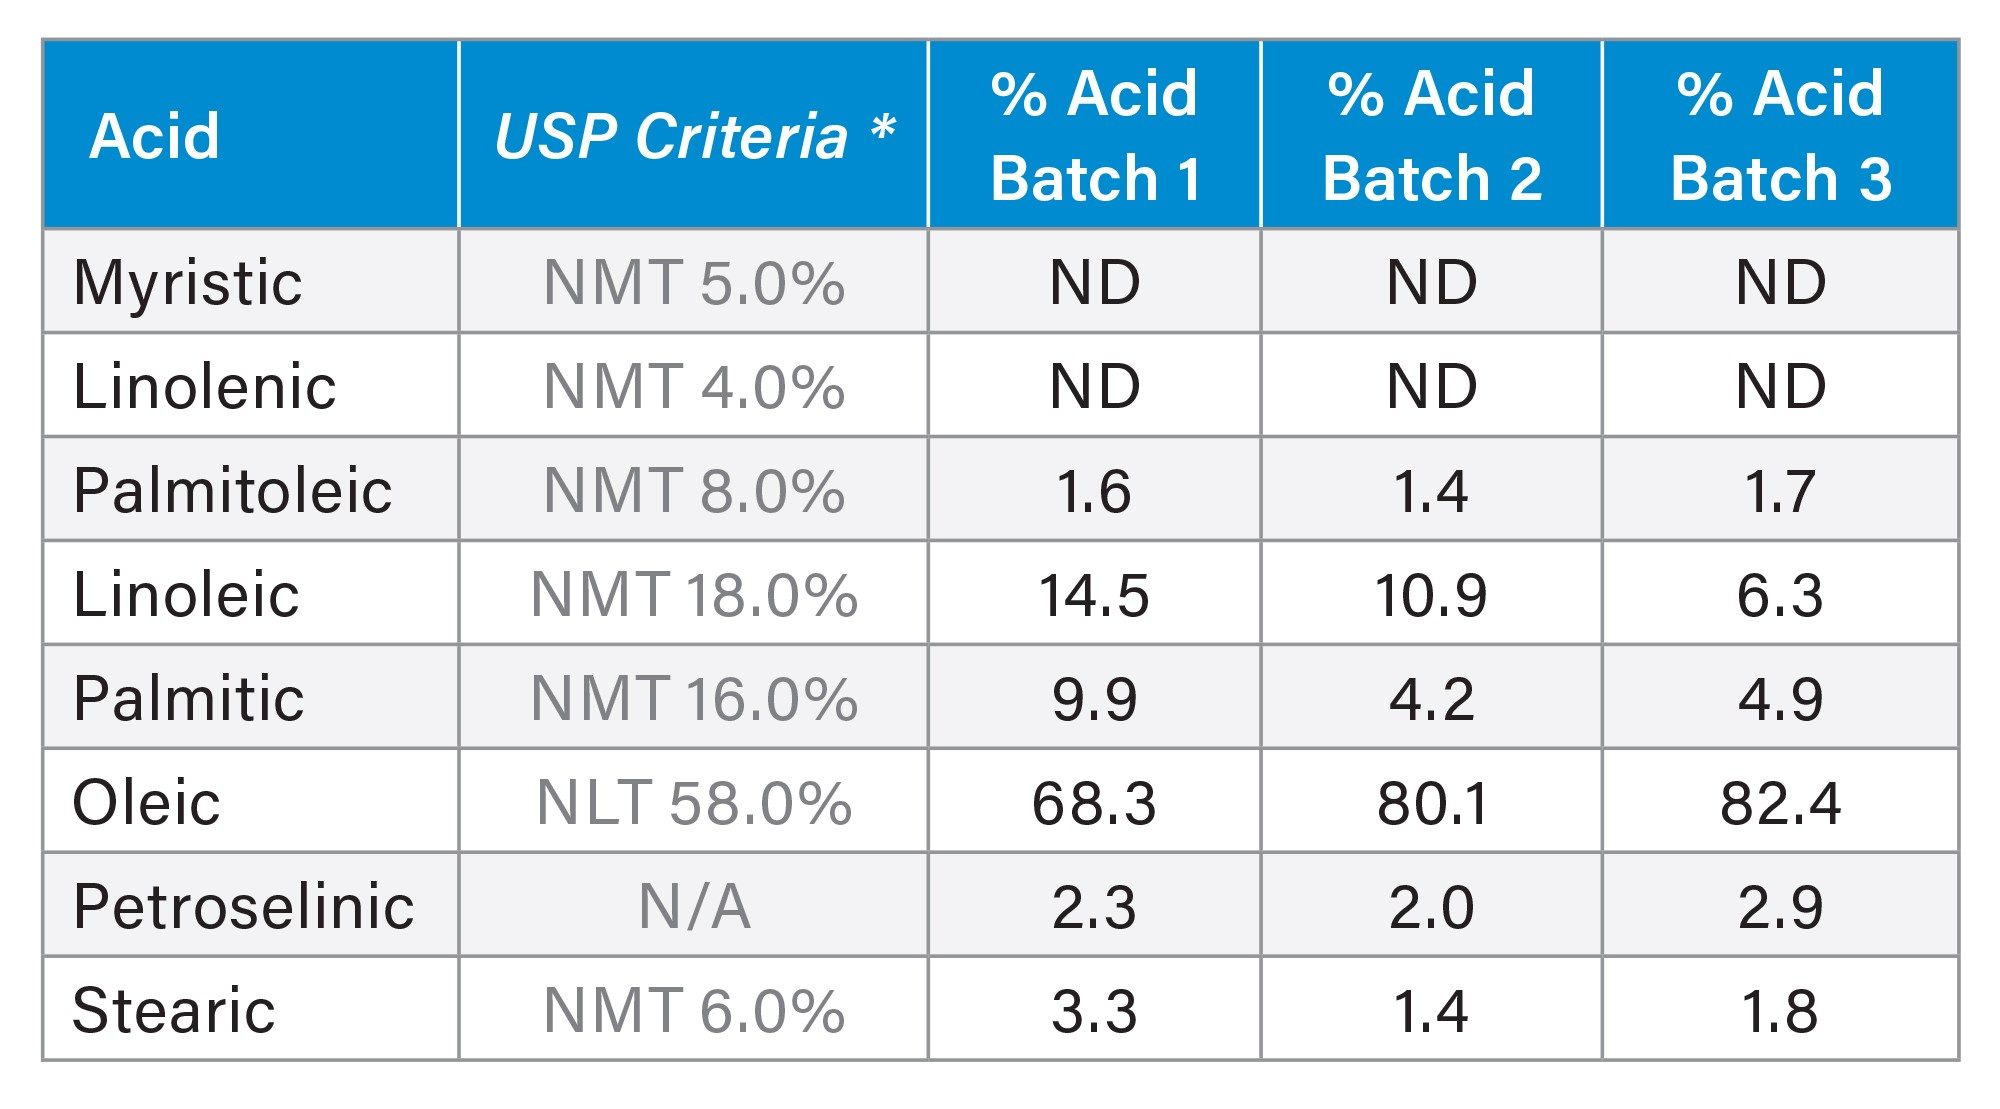
Composition of the fatty acids was determined by comparing peak area of each fatty acid to the total area of all peaks related to fatty acids, as detailed in the USP monograph for polysorbate 80.5 The calculations included petroselinic acid, all performed using Empower Software (Table 1). For all three batches tested, the amount of oleic acid ranged from 68.3% to 82.4%, meeting the USP criteria of not less than (NLT) 58.0%. Overall, the results met the USP acceptance criteria for composition of fatty acids.
An HPLC-CAD method was developed for the determination of fatty acid composition in polysorbate 80 raw materials. The analysis was performed using an Arc HPLC System with Waters CAD, controlled by Empower Software. The chromatographic separation was performed on an XBridge BEH C18 Column using a mobile phase consisting of 0.05% formic acid in water and acetonitrile solvent. Optimization of detector parameters including evaporator temperature, filter time constant, and power function value was critical to enhancing sensitivity, linearity, and repeatability. The developed method enabled reliable analysis of fatty acids for quality testing of raw materials, eliminating the need for a complex and time-consuming reflux reaction sample preparation procedure required for analysis by GC.
Fully integrated with Empower Software, CAD provides a compliant-ready, audit-strong workflow with streamlined documentation, reducing validation burden. By combining high analytical performance with simplified system integration, this approach minimizes operational complexity, maximizes uptime, and supports robust quality control of polysorbate 80 raw materials.
720009340, May 2026