Profiling the Lipidome of Adrenal Cancer Tissues using Fast Chromatography Coupled with the Xevo™ MRT Mass Spectrometer
Sheba Jarvisa, Lee A. Gethingsb, Elizabeth Wanta, Charlotte Bevana
a Imperial College, London, United Kingdom
b Waters Corporation, United States
Published on August 21, 2025
Abstract
- Demonstration of the Waters™ Xevo MRT Mass Spectrometer workflow for the analysis of tissue extracts related to adrenal cancer.
- Determine statistically significant differential lipids to enable benign and adrenal cancer tissues to be differentiated.
- High mass accuracy provides highly confident lipid identifications.
- Applying an MSE workflow provides qualitative and relative quantification within the same acquisition.
- Integration of data with third-party software for pathway analysis reveals additional biological insights related to adrenal cancer.
Introduction
Adrenocortical carcinoma (ACC) is a rare tumor with poor prognosis and paucity of targeted therapies. Although 5% of the adult population has adrenal nodules, the incidence of ACC is rare at 1-2 cases per million in adults, mainly occurring at ages 40-50 years and in young children.1 Surgical resection offers the only curative intervention, but many patients present with (inoperable) distant metastases, when prognosis is poor and 5-year survival is <50%.2 Altered tissue and intracellular lipid composition has been described in other cancer types where exploitation of lipid metabolism may pose a new therapeutic avenue.3,4 Comprehensive lipid profiling for benign and ACC tissues was conducted utilizing fast chromatographic separation combined with high resolution mass spectrometry, identifying major dysregulated lipid classes and demonstrating highly confident identifications.
Experimental
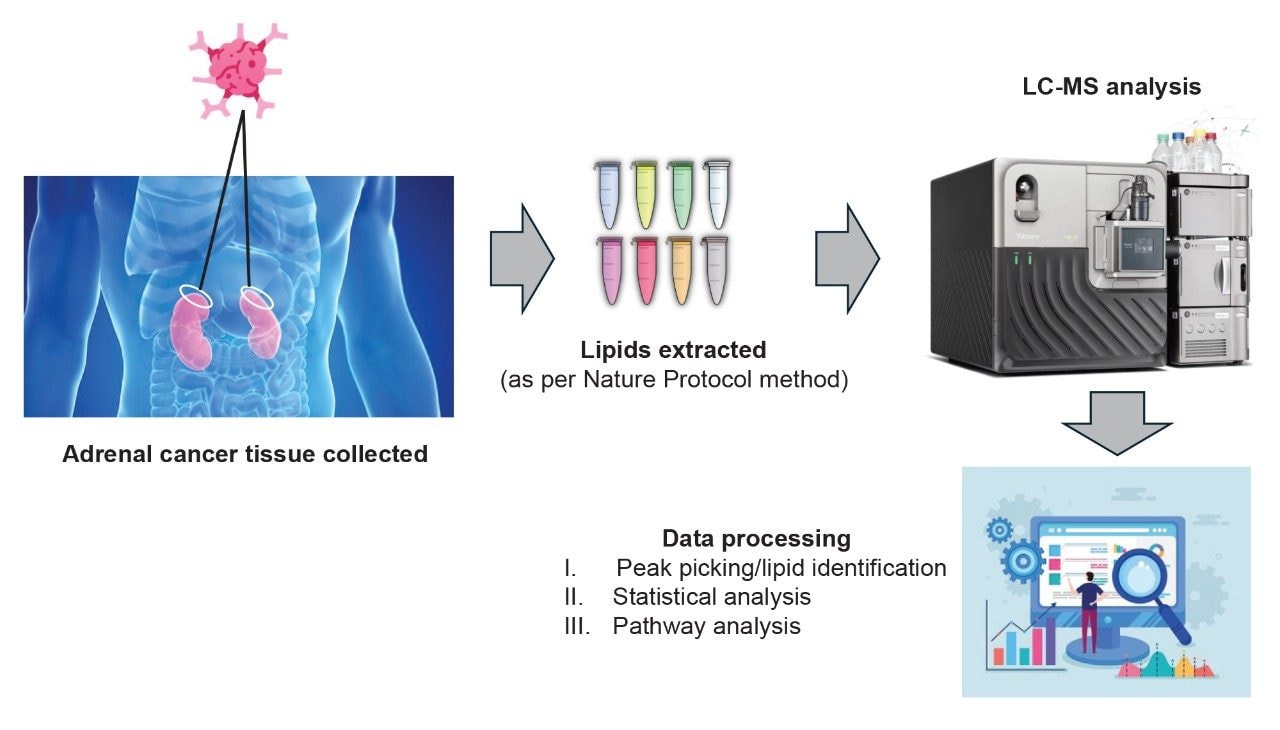
Lipids were extracted from tissue samples collected from benign and patients diagnosed with ACC. Lipids were extracted from the tissues using a previously published two-step solvent extraction method.5 Briefly, 1.5 mL of methanol:water (1:1, pre-chilled, -20 °C) was added to approximately 50 mg of tissue. The samples were then homogenized using a QIAGEN® TissueLyser (25 Hz, 5 minutes) prior to centrifugation at 16,000 g for 10 minutes. The supernatant was removed for future analysis of the aqueous extract, while the solid precipitate was homogenized (25 Hz, 5 minutes) with 1.6 mL dichloromethane/methanol (3:1, pre-chilled, -20 °C), centrifuged and the supernatant dried at room temperature in the fume hood. The dry residue was then reconstituted in 120 µL methanol:water (1:1). Particulates were removed by centrifugation prior to transferring the solution to LC-MS total recovery vials (p/n: 186002805).
LC-MS data were collected using an ACQUITY™ Premier UPLC™ System coupled to a Xevo MRT Mass Spectrometer. The chromatographic separation consisted of a 6.5 minutes method (injection to injection) using a charged surface hybrid (CSH) C18, 1.7 µm, 2.1 x 50 mm analytical column (p/n: 186009460). The gradient comprised of mobile phase B (90:10 IPA:acetonitrile, 10 mM ammonium formate, 0.1% formic acid) being ramped from 50% to 99% over 5 minutes using a flow rate of 0.4 mL/min. Mobile phase A consisted of 60:40 acetonitirle:water, 10 mM ammonium formate, 0.1% formic acid. MS data were acquired using the data independent acquisition (DIA) methodology, MSE, which utilized a scan rate of 20 Hz (10 Hz low energy, precursors; 10 Hz high energy, fragment ions) for positive and negative ion polarities. The data were converted to mzML format during the data acquisition process, providing the advantage of integrating with third-party application software, Lipostar2 (Mass Analytica, Spain), in addition to in-house tools (i.e., the UNIFI™ Application). Additional statistical analysis was conducted with MetaboAnalyst6 and pathway mapping via the lipid pathway enrichment analysis (LIPEA) connected to the kyoto encyclopedia of genes and genomes (KEGG) database (Figure 1).
Results and Discussion
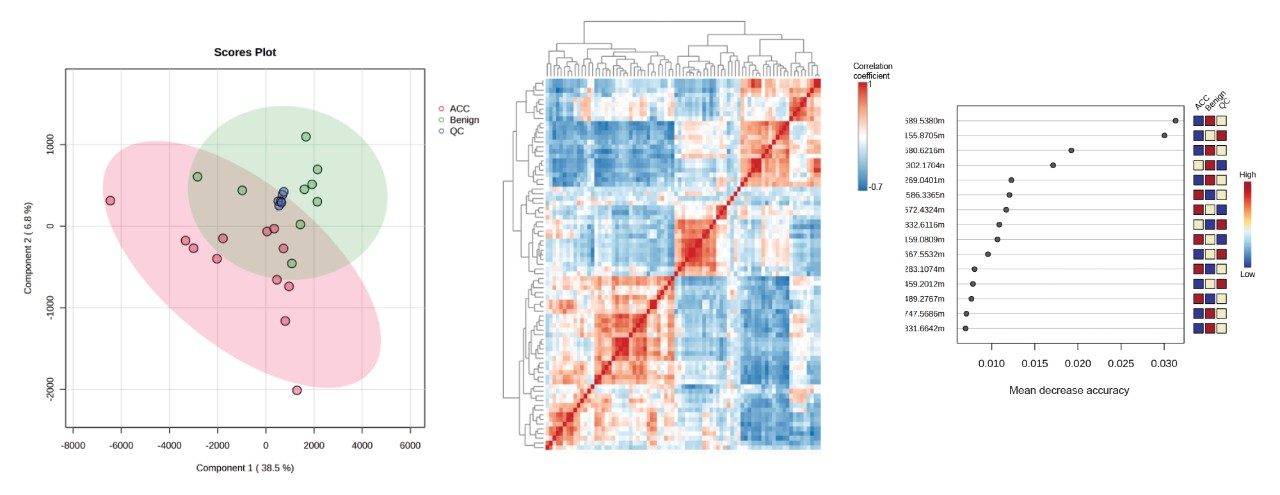
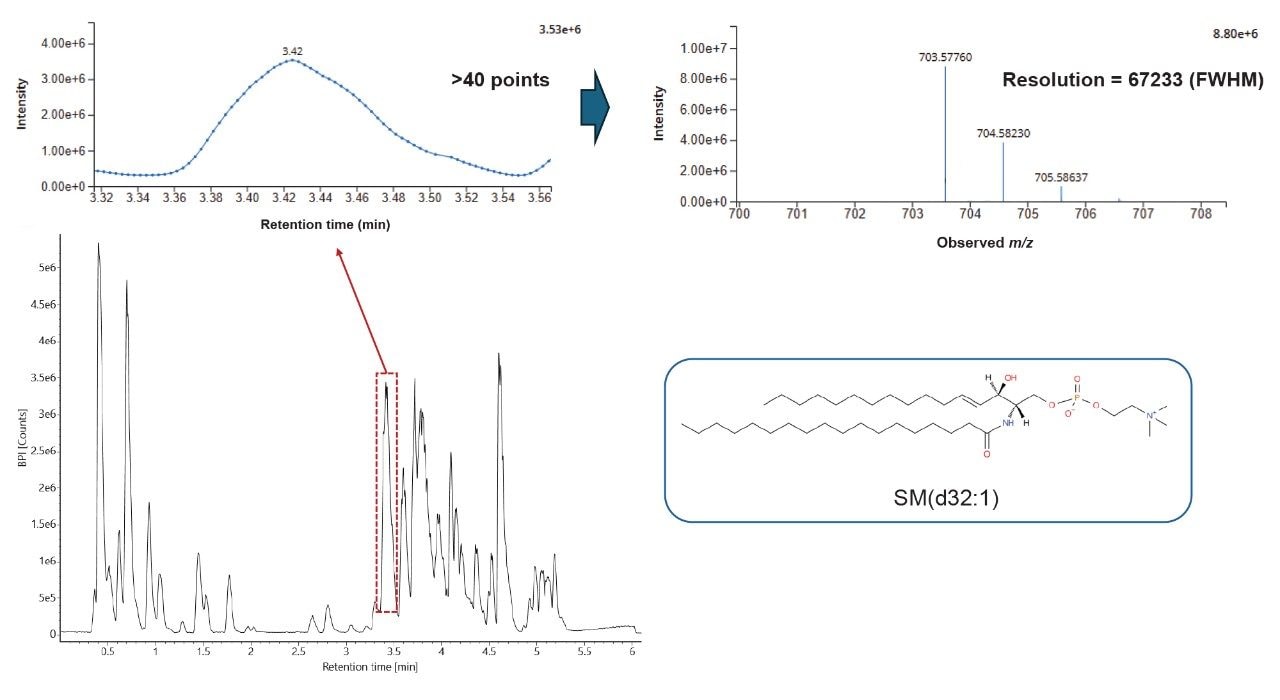
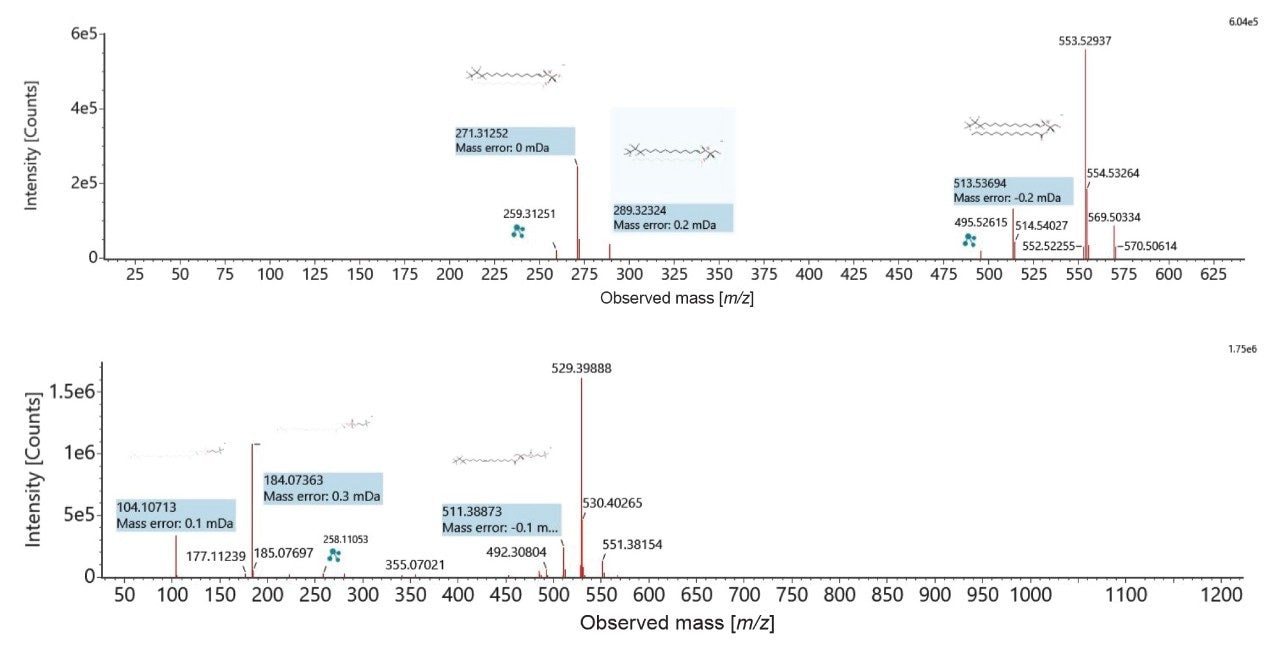
The peak picked data were statistically analyzed to determine data quality in addition to potential variances between the sample groups measured. Multi-variate statistics (MVA) were applied (Figure 2), consisting of principal component analysis (PCA), correlation analysis, and variable of importance (VIP) which provided features of statistically significant difference. The Xevo MRT Mass Spectrometer provides high quality data with fast acquisition rates, while maintaining high mass resolution and mass accuracy. Figure 3 is an example of data relating to SM (d32:1) highlighting the high number of data points achieved across the chromatographic peak (>40) while maintaining high mass resolution (>67,000 full width at half maximum ). The PCA highlights the high level of technical reproducibility with the study QC’s tightly clustered between the ACC and benign groups, indicating differentiation at the lipidome level. These differential features were subsequently database searched against the LipidMaps database and in-house library. These provided comprehensive identifications which were subsequently curated based on mass accuracy (<1 ppm precursor and fragment ions) and MS/MS spectral quality. Example fragmentation spectra are provided in Figure 4, representing the spiked internal standards.
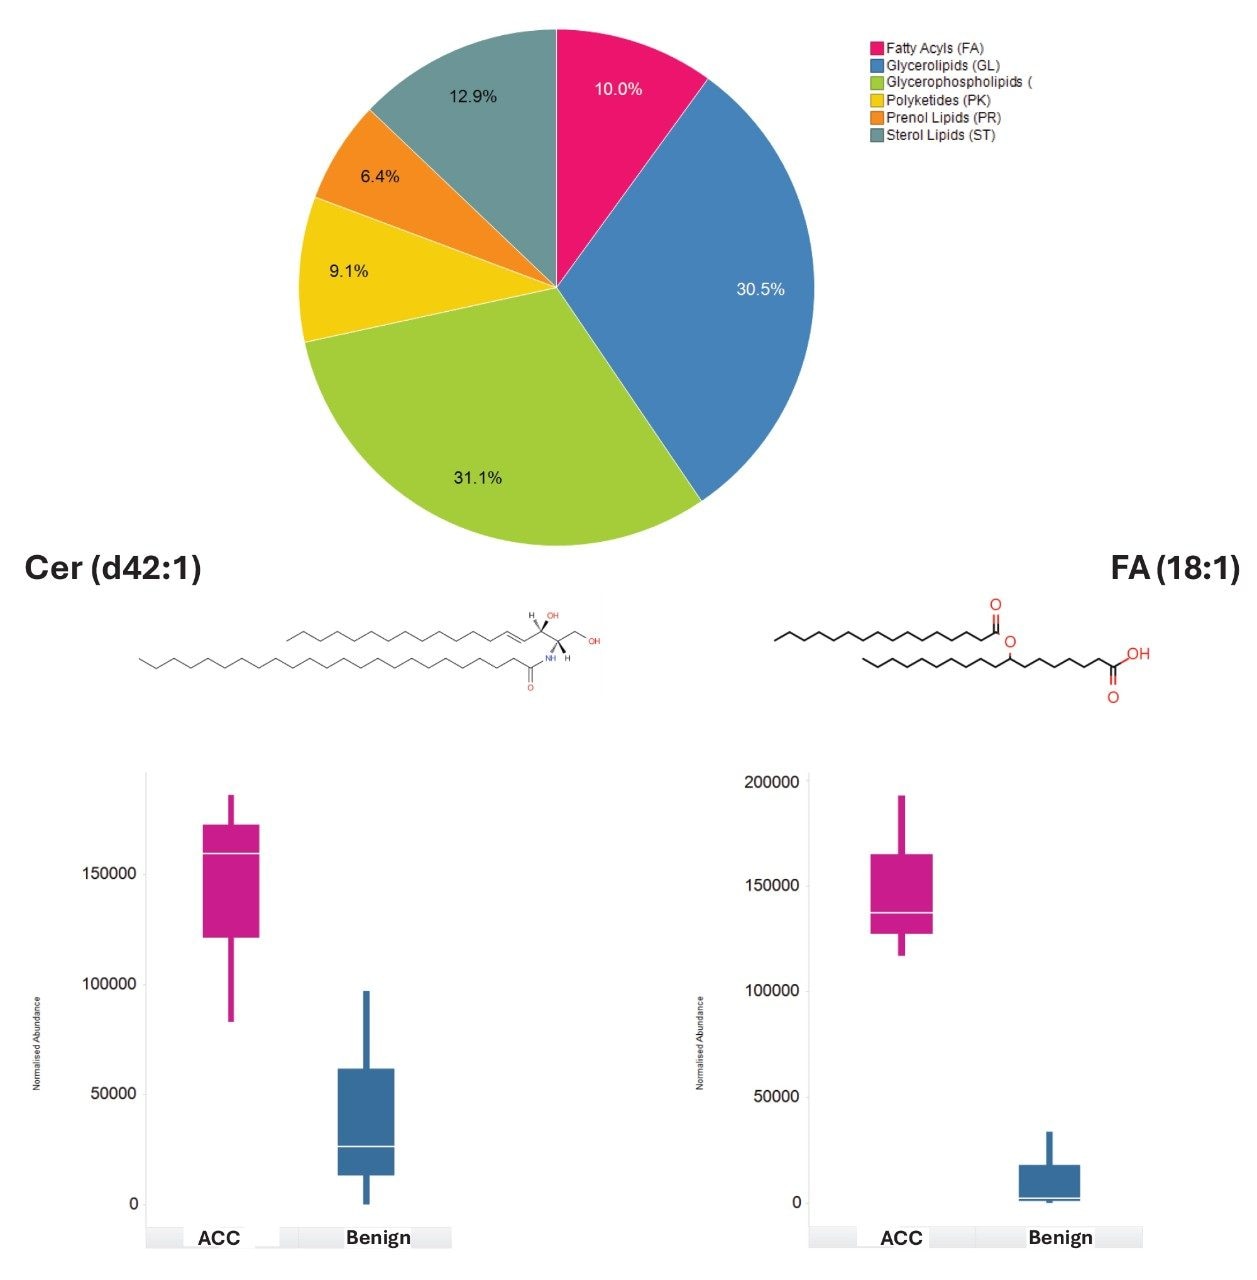
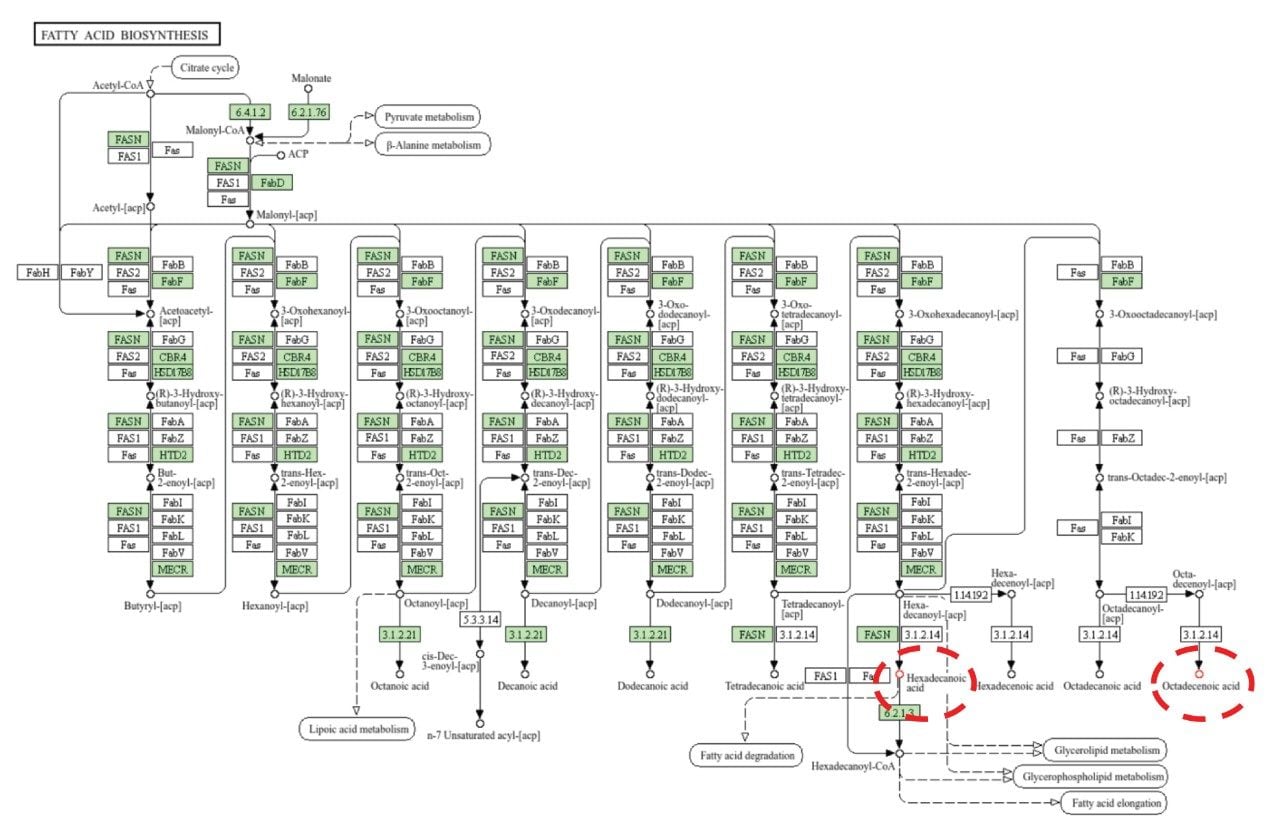
Lipids from all the major classes were identified, with significant dysregulation being shown for ceramides and fatty acids. Figure 5 indicates the lipid class distribution for those features identified and exemplar box-whisker plots, for example, lipids which were significantly dysregulated between benign and ACC patient groups. To provide additional biological insight, the curated lipids were subjected to pathway enrichment analysis. A variety of highly scoring pathways were identified as significant based on p-value and Benjamini correction, these included glycerophospholipid metabolism, choline metabolism, and fatty acid biosynthesis. All three pathways have associations with tumor development. Choline metabolism has been well documented as being associated with cancer and tumor progression due to changes in signaling processes.7 Fatty acid biosynthesis has been shown to be integral to cancer development with free fatty acids ( FFAs) being implicated as a food source but also as secondary messengers and involved in the structure of the membrane matrix8 (Figure 6). Similarly, glycerophospholipids are involved in similar biological roles as FFAs and are therefore, also highly dysregulated within the ACC population.9
Conclusion
The analysis of lipid extracts originating from ACC and benign tissues provides a range of lipid classes, some of which show significant dysregulation for ACC (i.e., ceramides and fatty acids) and therefore differentiation from benign tissues. Implementing a DIA workflow with the Xevo MRT Mass Spectrometer provides excellent quality data allowing for qualitative and relative quantification to be gained within a single acquisition. The high mass accuracy (sub 1 ppm) and excellent fragmentation spectra allow for highly confident identifications to be returned from database searches. Integration with third-party informatics packages allows for enrichment analysis to be performed, highlighting a variety of pathways, including fatty acid biosynthesis as being significant.
References
1. Adrenal tumors in children and adolescents (vs. 8.0) - European Society for Paediatric Oncology.
3. https://www.cancer.gov/types/adrenocortical/patient/adrenocortical-treatment-pdq
4. https://www.cancer.org/cancer/types/adrenal-cancer/treating.html
5. Want et al. Global metabolic profiling of animal and human tissues via UPLC-MS. Nature Protocols, 8, 17-32 (2013).
6. Pang et al. MetabAnalystR 4.0: a unified LC-MS workflow for global metabolomics. Nature Comms (doi: 10.1038/s41467-024-48009-6).
7. Glunde et al. Choline metabolism in malignant transformation. Nature Reviews Cancer, 11, 835-848 (2011).
8. Koundouros et al. Reprogramming of fatty acid metabolism in cancer. British Journal of Cancer, 122, 4-22 (2020).
9. Chen et al. PLA2G4A and ACHE modulate lipid profiles via glycerophospholipid metabolism in platinum-resistant gastric cancer, Journal of Translational Medicine, 22, 249 (2024).
720008959, August 2025