• Application Note

Analysis of Pharmaceuticals and Pesticides in Bottled, Tap, and Surface Water Using ACQUITY UPLC Systems with 2D-LC Technology

Analysis of Pharmaceuticals and Pesticides in Bottled, Tap, and Surface Water Using ACQUITY UPLC Systems with 2D-LC Technology

  • Claude R. Mallet
  • Waters Corporation
Filling glass with drinking water from kitchen tap

Abstract

This application demonstrated the disruptive nature of ACQUITY UPLC Systems with 2D-LC Technology with a Xevo TQD Mass Spectrometer. The application targeted the analysis of PPCP’s and pesticides in bottled, tap, and surface water. The limit of detection in this study was 1.0 ppt with a 10:1 enrichment from the extraction protocol (15 min total) and a 200:1 enrichment from the at-column dilution option, for a total of 2000:1. The recovery data for bottled, tap, and surface water samples using a micro extraction protocol shows comparable results to application with macro extraction protocols.

Benefits

Fast extraction protocol (15 min)

Introduction

LC-MS/MS and GC-MS/MS have been utilized for routine analysis since the introduction of hyphenated instrumentations in the 1970’s. Those platforms play a crucial role for analyses that require trace level part-per-billion (ppb) detection limits. In environmental analysis, government agencies around the world are vigilant for both regulated and emerging contaminants in bodies of water. The list of contaminants grows every year and, as a consequence, new analytical protocols need to be developed to meet those demands.

Both gas and liquid chromatography with mass spectrometry detection are without a doubt the most popular techniques utilized for trace level analysis. By improving the level of automation, the next generation of hyphenated solutions is even better equipped to bring a measurable cost reduction to the overall analytical process (time, resources, and consumables). The typical workflow process is accomplished in two parts. First, a target analyte must be isolated from the sample matrix. This is commonly known as the “extraction process,” during which a target analyte is isolated from a raw sample into an ideal format for analysis. The second phase of extraction deals with the separation and detection of a target analyte in a sample extract. The workflow for any extraction process is directly linked to the level of complexity of the sample matrix. For example, drinking water is considered to be a low-complexity matrix, meaning the level of difficulty of isolating a target analyte from that particular matrix is low. However, waste water sample is a high-complexity matrix, which means the level of interferences are at high concentration and will subsequently impact the analytical performance of the extraction protocol (recoveries, robustness, lifetime, accuracy, etc.).

Macro vs micro extraction protocol

When confronted with trace level analysis, it is often required to bring the concentration of the target analyte into the detectable range of the chosen analytical method (UV, MS, ELSD, etc.), meaning an enrichment step is required in the extraction protocol. Most applications targeting low part-per-trillion (ppt) will need to extract large sample volumes or masses. In the case of water applications, it is a common practice to extract between 500 mL to 1000 mL of sample volume. The enrichment factor is calculated from the initial volume before extraction and the final volume of the sample extract before analysis.

Most methods1-7 will opt for a final volume between 0.5 mL and 1.0 mL, which bring an enrichment factor range from 500x up to 1000x. Figure 1 shows a macro extraction protocol using a 1000 mL water volume with a double SPE cartridge configuration. This configuration is extremely useful during method development and provides crucial information regarding the retention behavior (breakthrough, retention strength, retention mechanism, etc.) of target analytes.

Workflow sequence using a macro extraction protocol
Figure 1. Workflow sequence using a macro extraction protocol.

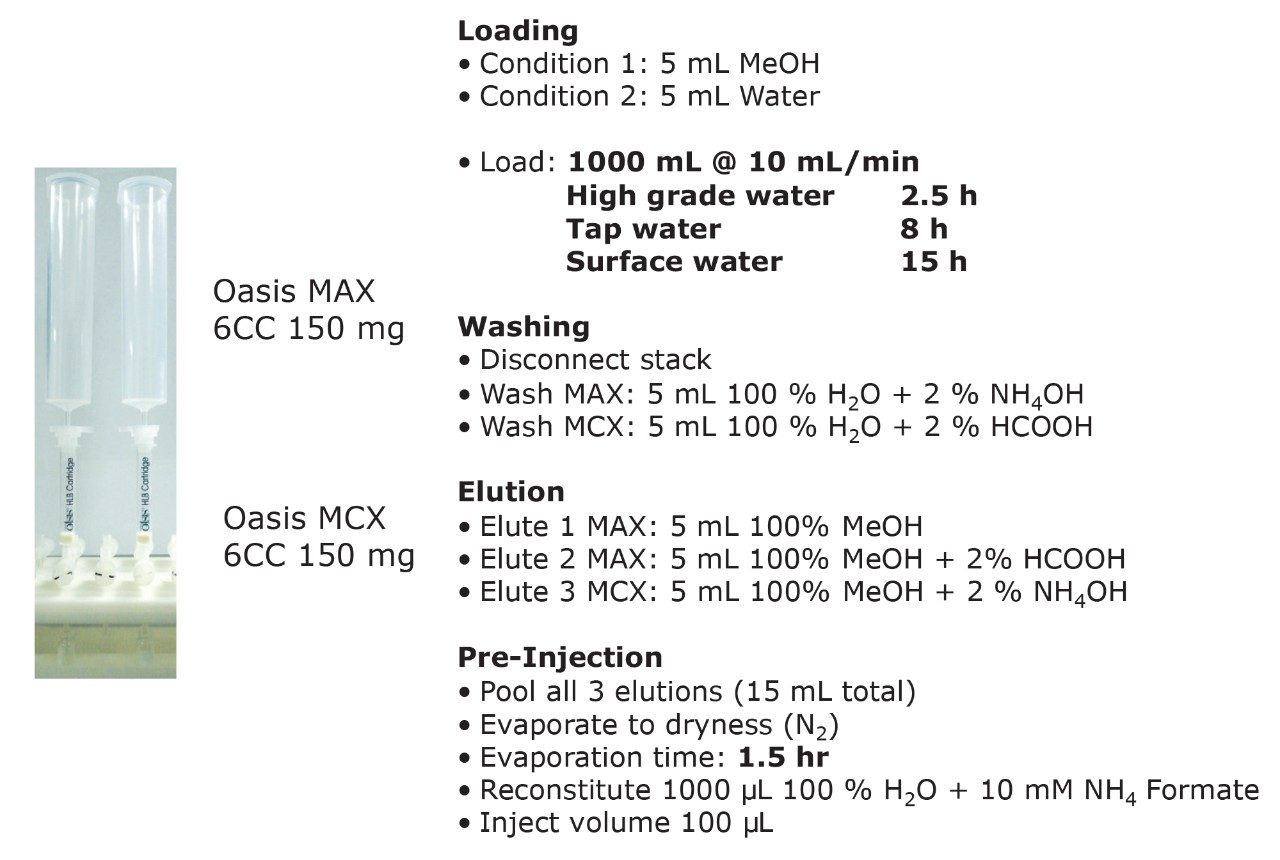
The extraction sequence starts with a sorbent conditioning step to remove potential interferences. The next step is sample loading, which extracts target analytes from the sample. Typical loading flow rate for large sample size range is between 5 mL/min and 10 mL/min. The loading flow rate is an optimized function derived from the SPE bed mass, sample contact time, and mass transfer onto the sorbent. With a loading flow rate set at 10 mL/min, the total loading time should take 1.6 hours before proceeding with the next step of the extraction protocol. However, as seen in Figure 1, the values for high-grade water (2.5 hours), tap water (8 hours), and surface water (15 hours) samples far exceed the expected 1.6 hours. The discrepancy comes from the fact that the loading flow rate is not at a constant value for the entire sample volume. In fact, the flow rate is linked to the quality of the sample and, therefore, the extended loading time is attributed to clogging issue from particulate matter in the sample. This is necessary to reach the desired target LOD or LOQ. In some instances, it may be necessary to extract a larger sample volume to increase the enrichment factor. Once the total volume is extracted, a wash step removes weak interferences without causing breakthrough for the target analyte. The elution step breaks the retention bonds of the target analyte from the SPE sorbent. At this point in the extraction process, the target analyte sustained a solvent exchange from aqueous to an organic solvent (aqueous or non-aqueous miscible). If the final extract is dissolved in a non-aqueous miscible solvent, this indicates that the analysis will be performed with a GC-MS platform. If the analysis is performed with an LC-MS and assuming a reversed-phase separation, the final extract must undergo a second solvent exchange. This is accomplished by using nitrogen stream evaporation to evaporate the sample to dryness and reconstitute with initial mobile phase conditions.

Nitrogen evaporation is linked to the properties of the organic solvent and any remaining percentage of water collected during the elution step. In some cases, the evaporation time can be decreased by applying mild heat. It is a well-known fact that evaporative loss is always a potential cause for poor recoveries. In some instances, the evaporation rate can be at extreme low settings, which requires adding an overnight time period for completion. Finally, once the sample is reduced to dryness, yet another cause of poor performance can occur by reconstitution solvent compatibility and solubility. The overall workflow is dependent of the analytical technique used for analysis and can be extremely time-consuming and laborious.

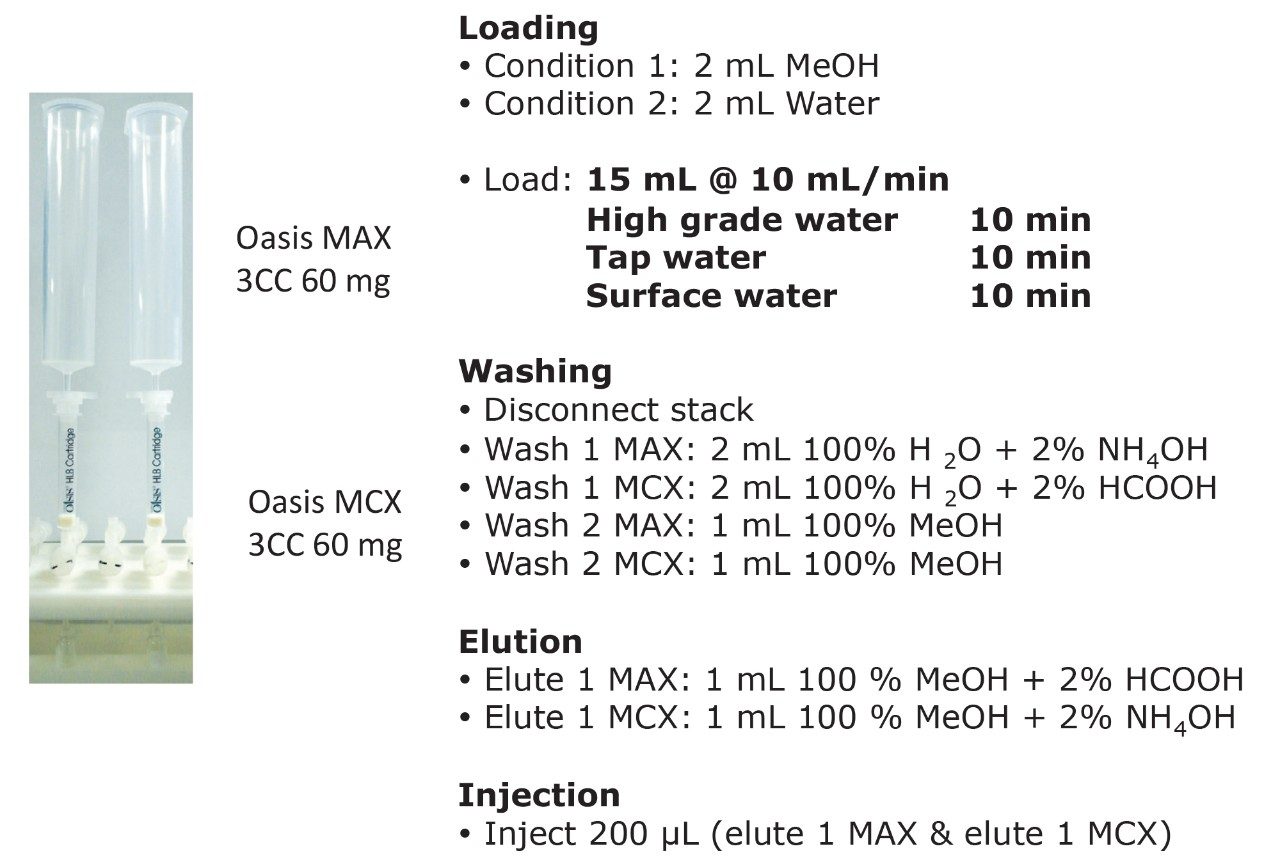
ACQUITY UPLC Systems with 2D-LC Technology offer the same analytical performances regarding recoveries, linearity, robustness, and lifetime, but at micro-extraction level. Figure 2 shows a micro extraction protocol using a 15-mL sample volume. The smaller sample volume allows faster loading time, on average less than 10 minutes. The final elution volume was optimized at 1 mL. The enrichment ratio for a micro extraction protocol is 15:1. With the option of a wider range of injection volume and extract composition, the evaporation and reconstitution step were eliminated. With 2D at-column dilution, aqueous and organic extracts can be loaded and captured on a trap column with high efficiencies. The injection volume for this configuration is not a limitation, which gives the option to inject as much as needed to reach target detection limits. For example, if the entire final sample (1 mL) is used for the analysis, it will give an additional 100:1 enrichment factor. Therefore, the overall enrichment from hardware and extraction protocol is now calculated at 1500:1, which is higher than those seen with a macro extraction protocol. Furthermore, the entire extraction protocol (loading, washing, and elution) was completed in less than 15 minutes for a high-grade, tap, and surface water sample.

Workflow sequence using a micro extraction protocol.
Figure 2. Workflow sequence using a micro extraction protocol.

Two MRM transitions (quantification and confirmation) for all pharmaceuticals and personal care products (PPCP’s ) and pesticides were selected and optimized. The MS conditions are listed in Table 1.

MRM conditions for pesticide and pharmaceutical.
Table 1. MRM conditions for pesticide and pharmaceutical.

For this application, finding the optimum chromatographic condition for this multiresidue analysis poses a difficult challenge due to the chemical diversity of PPCP’s and pesticides. The chromatographic conditions were tested on several trapping chemistries (Oasis HLB, XBridge C18, and XBridge C8 columns) and separation chemistries (BEH C18 and HSS T3). The loading (low pH, high pH, and neutral pH) and eluting mobile phase (MeOH + 0.5% Formic acid and ACN + 0.5% formic acid) were also optimized using an automated process.

The extraction process was performed using a tandem cartridge configuration with a 3 cc Oasis MAX and 3 cc Oasis MCX SPE barrel. Due to the mixed-mode nature of these sorbent, the multi-tier extraction mechanism ensures the retention of acidics, basics, and neutral entities in a control fashion. The MCX cartridge is connected below the MAX cartridge. The sorbents were conditioned by using 5 mL of methanol followed by 5 mL of water. The water samples (15 mL) were loaded at a flow rate of 10 mL/min. The cartridge stack was then disassembled and each cartridge followed specific wash and elution steps. The MAX cartridge was then washed with 2 mL water with 2% ammonium hydroxide (fraction discarded). The MCX cartridge was washed with 5 mL water with 2% formic acid (fraction discarded). The MAX elution was performed in two steps: the first elution was performed with 1 mL of methanol (neutrals and basics); the second elution with 1 mL of methanol with 2% formic acid (acidic). The MCX elution was performed in two steps: the first elution was performed with 1 mL of methanol (neutrals and acidics); the second elution with 1 mL of methanol with 2% ammonium hydroxide (basic).

Experimental

Chromatography and MS/MS conditions

Loading conditions

Column:

Oasis HLB 20 μm

Loading:

Water pH 7 no additives

Flow rate:

2 mL/min

At-column dilution:

5% (0.1 mL/min pump A and 2 mL/min pump B)

UPLC conditions

UPLC system:

ACQUITY UPLC 2D with at-column dilution

Runtime:

10 min

Column:

ACQUITY UPLC BEH C18, 2.1 x 50 mm, 1.7 μm

Column temp.:

60 °C

Mobile phase A:

Water + 0.5 % Formic acid

Mobile phase B:

Acetonitrile + 0.5 % Formic acid

Elution:

5 minute linear gradient from 5% (B) to 95% (B)

Flow rate:

0.500 mL/min (pump C)

Injection volume:

200 μL

MS conditions

MS system:

Xevo TQD

Ionization mode:

ESI positive

Capillary voltage:

3.0 kV

Cone voltage:

30.0 V

Source temp.:

150 °C

Desolvation temp.:

550 °C

Desolvation gas:

1100 L/hr

Cone gas:

50 L/hr

Results and Discussion

Automated method development

The starting point of any analytical protocol is the selection of chromatographic parameters to achieve well-resolved peaks for qualitative and/or quantitative analysis. Method development is typically performed with a trial-and-error approach, which ultimately leads to an optimized chromatographic method in a relatively short time. Another current practice is to select the most successful conditions in a systematic screening approach with the goal of quickly reaching optimized conditions. When utilizing multidimensional chromatography, the task of selecting optimized conditions can be quite difficult. However, with automation and a selection of key parameters, a large number of methods can be screened in a short time frame. For example, Figure 3a shows a 2D configuration with at-column dilution with typical loading conditions, elution conditions, trapping chemistries, and separation chemistries. As shown, several options are listed and, with a multiplication effect, can generate a staggering number of methods (Figure 3b). This represents a collection of conditions for the analysis of a basic analyte. Each condition selected will have a key effect on the chromatographic behavior of a target analyte. In this instance, the high pH, low pH, and neutral loading conditions were evaluated to monitor the trapping efficiency versus the ionized or neutral state of the target analyte. Figure 4 shows the retention behavior for cimetidine at low, neutral, and high pH. The low pH elution with methanol or acetonitrile were selected to monitor the polarity range of the target analyte. As seen in Figure 5, the elution profile for atrazine suggests a high affinity for methanol. The loading and eluting parameters work in tandem to ensure no breakthrough during loading and as well as minimize peak distortion during back-flush elution.

2D trap and elute configuration – loading and eluting conditions.
Figure 3a. 2D trap and elute configuration – loading and eluting conditions.
2D trap and elute configuration with at-column dilution.
Figure 3b. 2D trap and elute configuration with at-column dilution.
Trapping efficiency during loading phase.
Figure 4. Trapping efficiency during loading phase.
Elution strength during back flushing phase.
Figure 5. Elution strength during back flushing phase.

The chemistries selected for the trap also play a crucial role. The target analyte can often bind very strongly or be captured with a weak binding effect. In both cases, poor recovery can result. Figure 6 showcases the retention strength of carbamezapine with a very strong affinity for Oasis HLB.

Retention strength during loading phase.
Figure 6. Retention strength during loading phase.

On the other hand, Figure 7 displays the chromatographic behavior of corticosterone versus the hydrophobic selectivity of BEH C18 and HSS T3. Overall, the separation chemistries complement the system performance by fine tuning the level of hydrophobicity. By multiplication, a total of 36 permutations can be setup for method development. In this application, each method uses a 3 minute loading and a 5 minute back-flush gradient for a total run time of 10 minutes. With duplicate injection per method, 3 methods per hour were recorded, thus all 36 methods tested were completed in 12 hours. With the amount of results generated in a short amount of time, a color coded chart was constructed to visualize which operating conditions gave the best peak profile. Figure 8a shows the elution profile of trimethoprim for 3 selected methods. The chromatogram from method 1 shows no signal for the target analyte, and therefore method 1 was attributed a red tag. The chromatogram from method 25 shows an intense signal, however, and the peak shape is distorted by a peak tailing effect. Thus, method 25 was attributed a yellow tag. The chromatogram from method 28 shows a well resolved and gaussian peak shape, which received a green tag. With this screening criteria, each method was carefully identified and compiled for comparison. The comparison chart for trimethoprim (Figure 8b) shows an 83% success rate. Several pharmaceuticals and pesticides gave a 100% score, while two pesticides produce un-successful results at 0%. This is not a situation in which the hardware is at fault, but rather it points toward the expansion of operating conditions, such as flow rate, temperature, buffers, ion pairing, etc.

Retention efficiency during back flushing phase.
Figure 7. Retention efficiency during back flushing phase.
Typical results during method development.
Figure 8a. Typical results during method development.
Comparison chart
Figure 8b. Comparison chart of 36 2D methods for trimethoprim.

From the comparison chart (Figure 9a, 9b, 9c, 9d, 9e, 9f), it is apparent that a single method will not cover the entire mix of pesticides or pharmaceuticals, which brings the option to select an automated multi-method approach rather than a single multi residue protocol. For this application, method 28 was selected for pesticides and pharmaceuticals for the highest score (Figure 10).

Comparison chart for pharmaceutical mix using XBridge C8
Figure 9a. Comparison chart for pharmaceutical mix using XBridge C8 – method 1 to 12.
Comparison chart for pharmaceutical mix using XBridge C18
Figure 9b. Comparison chart for pharmaceutical mix using XBridge C18 – method 13 to 24.
Comparison chart for pharmaceutical mix using Oasis HLB
Figure 9c. Comparison chart for pharmaceutical mix using Oasis HLB – method 25 to 36.
Comparison chart for pesticide mix using XBridge C8
Figure 9d. Comparison chart for pesticide mix using XBridge C8 – method 1 to 12.
Comparison chart for pesticide mix using XBridge C18
Figure 9e. Comparison chart for pesticide mix using XBridge C18 – method 13 to 24.
Comparison chart for pesticide mix using Oasis HLB
Figure 9f. Comparison chart for pesticide mix using Oasis HLB – method 25 to 36.
Legends
Chromatogram for pesticide pharmaceutical standard at 10 ppt
Figure 10. Chromatogram for pesticide pharmaceutical standard at 10 ppt using method 28.

Micro extraction protocol

With the analytical method optimized for both pesticides and pharmaceuticals, the next step focused on the optimization of the micro extraction protocol for tap and surface water samples. When confronted with intermediate and high complex matrices, the challenge during the extraction process is to remove the maximum amount of interferences with acceptable recoveries (70% to 120%) for the target analytes. Therefore, as the matrix complexity of a sample increases, the extraction protocol must also incorporate additional cleaning steps to maintain acceptable performance. These additional steps, although a neccessity, will inevitably increase the time needed to reach a final extract.

A micro extraction protocol can produce a robust procedure in a short time. All Oasis MAX and MCX fractions (eight total) were kept and analyzed in two hours. This approach provided visualization of the overall performance of the double stack extraction protocol, with particular attention paid to which retention mechanism pesticides and pharmaceuticals will use, as well as to monitor any breakthrough, if any. In Figure 11a and 11b, a step-by-step Oasis MAX/MCX protocol is described. The results for the Oasis MAX-MCX double stack are presented in Figure 12 for carbamazepine and tripolidine.

Oasis MCX extraction protocol.
Figure 11a. Oasis MCX extraction protocol.
Oasis MAX extraction protocol.
Figure 11b. Oasis MAX extraction protocol.
Chromatograms for carbamazepine and tripolidine
Figure 12. Chromatograms for carbamazepine and tripolidine for each MAX/MCX fractions.

The procedure began with the loading of 15 mL of a water sample spiked at 50 ppt. A 1-mL aliquot was taken before and after the loading step. Those aliquots are represented by fraction 1 (pre-loading) and fraction 2 (post-loading) (Figure 12). The chromatograms in fraction 1 are the results of a direct injection of the water sample without any pre-concentration. With a 200-uL injection, a weak signal for carbamezapine can be seen, while the MRM transition for tripolidine shows a flat signal. This is not an indication of poor performance from the hardware, but clearly shows that a concentration level of 50 ppt is near the instrument detection limit (LOD). The chromatograms for fraction 2 are expected to be blank; if a signal is detected in this fraction, it indicates a breakthrough during the loading phase. After the loading phase, the cartridges were disconnected and treated separately with their respective extraction protocol. Since carbamazepine and tripolidine are both basic molecules, it is expected to achieve a better cleanup with the MCX sorbent, thus favoring a cation exchange retention. The chromatograms for fraction 3 and fraction 6 are the aqueous wash at low pH (MCX) and high pH (MAX). Those steps are crucial and lock the base or acid on their respected ion exchanger. Since those are aqueous washes, there is no expectation to observe a signal. The next step is to elute entities trapped on the reversed-phase portion of the mixed-mode sorbent. In this instance, fraction 4 and fraction 7 were eluted with 100 % methanol. The extraction was performed with a dual stack with MAX on top and MCX on the bottom. Therefore, the MAX sorbent will be in contact with the bulk of the sample, trapping until complete saturation or breakthrough. In this instance, the neutral and basic entities will be trapped on the reversed-phase, and acidics will be captured by the anion exchanger. Also, with respect to the trapping efficiency, molecules can be trapped either in neutral or ionized form. This may pose a risk of breakthrough if a molecule has a trapping affinity in its ionized form with a sorbent that only uses a reversed-phase retention. In this example, carbamazepine shows a flat signal in fraction 4, but tripolidine shows a minor deflection. Since the MCX cartridge was on the bottom of the stack, there could be a scenario that tripolidine has a higher affinity for its ionized form and breakthrough from MAX during loading. Fraction 7 from MAX Elute (reversed-phase) shows an intense signal for carbamazepine (90%) and a weak signal for tripolidine (25%). This clearly shows that carbarmazepine was trapped by the reversed-phase portion of MAX and, when compared to tripolidine, only a minor portion was captured by the reversed-phase of MAX. The entire process comes to light with fractions 5 and 8 showing a 75% recovery for tripolidine on the cation exchange (MCX) and about 10% for carbamezapine on the anion exchanger (MAX). Although carbamazepine does not have any acidic moieties, the signal seen in the MAX anion exchanger retention is unlikely and must be a residual amount from the MAX reversed-phase. From this set of data, Table 2 and Table 3 show case the results for the pesticides and pharmaceuticals mix using the MAX/MCX or MCX/MAX extraction process. The results were calculated in percentage against an unextracted standard with the same enrichment ratio. In essence, this dual approach will show which retention mechanism offers the best performance. In Table 2, the results for the pesticides show some unexpected performance. Since the pesticides mix comprises of basic entities, it was expected that the cation exchange mechanism from MCX would be the preferred route. From the MAX/MAX protocol, the results show that 16 pesticides were retained on the MAX (RP) and no signal was detected on the other retention sites MAX (IE), MCX (RP), and MCX (IE). This indicates that none of the pesticides showed breakthrough and also do not have any acidic retention properties. In fact, only two pesticides gave unsatisfactory results with this procedure. However, the results showed no breakthrough, and also no signal, in any of the retention sites. This can be explained by the fact that the pesticides in question are still bound to the sorbent, which indicates poor elution. With the MCX/MAX procedure, 10 pesticides, even with a basic functionality, were captured by the MCX (RP). The other eight pesticides showed excellent results on the MCX (IE). The MAX (RP) and MAX (IE) show no signal, indicating that the MCX trapped the entire mix of pesticides. From these results, the MAX (RP) and MCX (IE) fractions were collected and analyzed with method 28, described earlier. For the pharmaceuticals mix, since the entire mix is comprised of basic entities, there was an expectation of a similar route with the MCX cation exchange mechanism. The results in Table 3 show five pharmaceuticals with a strong retention for the MAX (IE), 11 having a strong affinity for MCX (IE). Only one pharmaceutical (carbamezapine) showed retention affinity for the MAX (RP) and MCX (RP).

MAX/MCX vs MCX/MAX protocols for pesticides mix
A- methomyl, B- atrazine desethyl, C- simazine, D- chlortoluron, E- monolinuron, F- atrazine, G- metoxuron, H- sebuthylazine, I- terbuthylazine, J- diuron K- dicrotophos, L- cyanazine, M- linuron, N- hexazinone, O- metobromuron, P- metolachlor, Q- fenpropimorph, R- buprofezin
Table 2. MAX/MCX vs MCX/MAX protocols for pesticides mix
 MAX/MCX vs MCX/MAX protocols for pharmaceutical mix.
A- benzocaine, B- diethylcabarmazine, C- levamisole, D- carbamezapine, E- procaine, F- salbutamol, G- cimetidine, H- sulfamethoxaxole, I- sulfamerazine, J- tripolidine, K- trimethoprim, L- buflomedil, M- sulfamethoxine, N- enrofloxacine, O-bromhexine, P- diltiazem, Q- miconazole
Table 3. MAX/MCX vs MCX/MAX protocols for pharmaceutical mix.

Linearity and quantification

Based on the results shown in Tables 2 and 3, it is apparent that a multi-fraction extraction protocol will reach a larger selection of target analytes. As such, the pesticides and pharmaceuticals mix in this application were extracted with an optimized micro extraction protocol, shown in Figure 12. The listing for each fraction is listed in Table 4. The recovery data for bottled, tap, and surface water samples are presented in Table 5. With the pesticides mix, seven pesticides are common to the MAX (RP) and MCX (IE) listings. Therefore, recovery results will show the overall performance of a reversed-phase extraction vs cation exchange extraction. Both protocols offer excellent results for all matrix with recoveries from 79% to 118% (6 replicates). From a performance point of view, the MCX (IE) has an additional wash (discarded MeOH) than the MAX (RP) (aqueous only). The MCX protocol could be perceived as a more robust protocol than the MAX (RP). In Table 4, the MAX (RP) and MCX (IE) for Buprofezin show similar recovery results without any significant distinction.The other pesticides common to both extracts follow the same observation. In fact, the MAX (RP) fraction should be of equal quality of MCX (IE), simply because of the dual retention mechanism. The MAX (RP) protocol only recovers the reversed-phase portion and leaves on the sorbent acidic interferences trapped by the anion exchanger. With the MCX protocol, the neutral and acidic interferences are removed from the sorbent before the cation exchange is eluted for final elution. On average, a 10% difference is seen between MAX (RP) and MCX (IE) for the pesticides mix. The pesticides in MAX (RP) and MCX (IE) fractions produced excellent signal to noise ratio (>100:1) at 1 ppt, suggesting the option of trace level detection at part-per-quadrillion (ppq). The linearity for each pesticide was measured from 1 ppt to 100 ppt with a 1/x weight. For the pharmaceutical mix, similar results are presented in Table 5. The MCX (IE) and MAX (IE) provided excellent recoveries from 70% to 114% (six replicates). Some of the more polar analyte produced an LOD at 10 ppt (cimetidine, enrofloxacine, sulfadimethoxine) and at 50 ppt (sulfamethoxazole). For analytes with weak response factor, higher injection volumes can be used with the at-column feature. The linearity for each pharmaceutical was measured from 1 ppt to 100 ppt with a 1/x weight.

Pesticide and pharmaceutical listing
Table 4. Pesticide and pharmaceutical listing for MAX (RP), MAX (IE), MCX (RP), and MCX (IE).
Pesticides and pharmaceutical recoveries in bottled, tap and surface water sample.
Table 5. Pesticides and pharmaceutical recoveries in bottled, tap and surface water sample.

Conclusion

This application demonstrated the disruptive nature of ACQUITY UPLC Systems with 2D-LC Technology with a Xevo TQD Mass Spectrometer. The application targeted the analysis of PPCP’s and pesticides in bottled, tap, and surface water. The limit of detection in this study was 1.0 ppt with a 10:1 enrichment from the extraction protocol (15 min total) and a 200:1 enrichment from the at-column dilution option, for a total of 2000:1. The recovery data for bottled, tap, and surface water samples using a micro extraction protocol shows comparable results to application with macro extraction protocols. 1-7

References

  1. BattAL, Kostich MS, Lazorchak JM, Anal. Chem., 2008, 80, 5021-5030.
  2. Kasprzyk-Horden B, Dinsdale RM, Guwy AJ, Analytical and Biomedical Chemistry, 2008, 391, 1293.
  3. Vanderford BJ, Snyder SS, Environ. Sci. Technol., 2006, 40, 7312–7320.
  4. Reverte S, Borrull F, Pocurull E, Marce RM, J. Chromatogr. A, 2003, 1010, 225–232.
  5. Chahill JD, Furlong E, Burkhardt MR, Kolpin D, Anderson LG, J. Chromatogr. A, 2004, 1041, 171–180.
  6. Kasprzyk-Horden B, Baker DR, J. Chromatogr. A, 2011, 1218, 1620–1631.
  7. Shao B, Chen D, Zhang J, Wu Y, Sun C, J. Chromatogr. A., 2009, 1216, 8312–8318.

720005167, October 2014

Back To Top Back To Top