• Application Note

Comprehensive Sub-2 Minute Metabolite Identification and Characterization Using Xevo G2 Tof and MSE

Comprehensive Sub-2 Minute Metabolite Identification and Characterization Using Xevo G2 Tof and MSE

  • Waters Corporation
Light micrograph of a fatty liver

This is an Application Brief and does not contain a detailed Experimental section.

Abstract

This application brief demonstrates to maximize throughput and productivity for in vitro microsomal incubation studies for metabolite identification using ACQUITY UPLC-MSE methodology on a Xevo G2 Tof.

Benefits

UPLC-MSE enables scientists to deliver key metabolism information while simultaneously achieving massive reductions in turnaround time.

Introduction

Metabolite identification is an important part of the drug discovery process. With high attrition rates of drug candidates with complex mechanisms, drug discovery groups are under pressure to reduce turn-around times while simultaneously generating the highest quality of data possible.

The challenges of this type of analysis are often mutually exclusive. Typically the scientist is faced with a choice of two paradigms: A) to obtain high-quality data and information-rich results over a long period of time i.e. longer runs, multiple injections, and labor-intensive interpretation; or B) to acquire and analyze data quickly, but at the cost of degradation in the quality and completeness of results.

In this study, we will assess the applicability of Waters ACQUITY UPLC System, coupled with Xevo G2 Tof to deliver rapid metabolite identification and characterization. The substrate nefazodone was used for this study as its metabolism has been widely reported and as such, constitutes an ideal test compound.

Nefazodone’s primary use is to treat depression in adults; its effectiveness is due to the balancing of serotonin and norepinephrine levels in the brain. However, rare hepatotoxicity issues caused its withdrawal from the market in 2004.

Results and Discussion

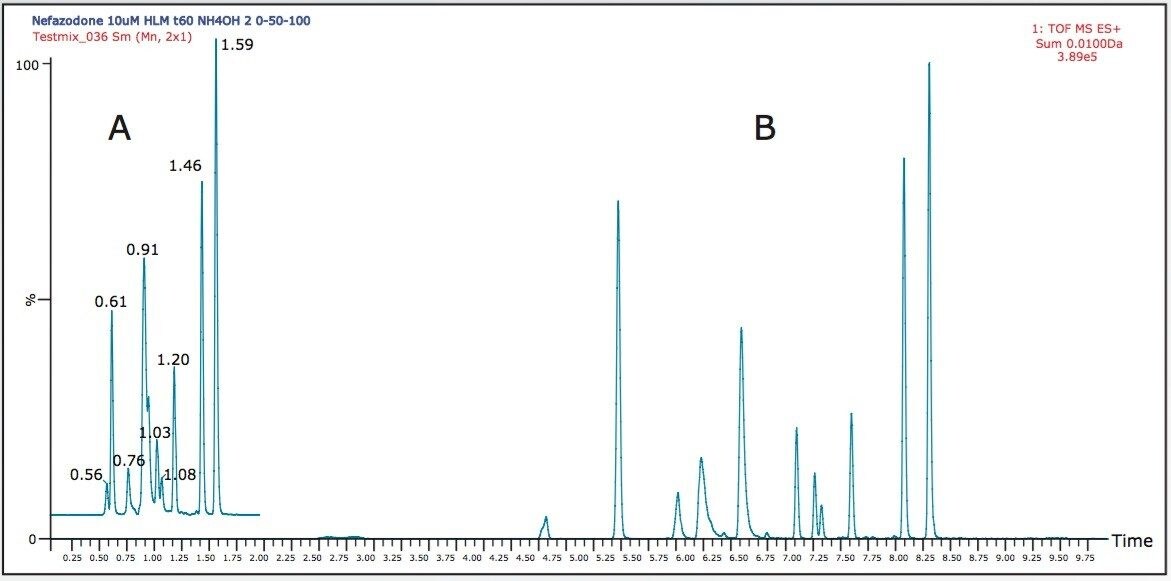
Human or rat liver microsomes spiked with 10 μM nefazodone were incubated for 0 and 60 min at 37 °C. Samples were quenched with one volume of cold acetonitrile + 0.1% formic acid and centrifuged. Supernatants were directly analyzed using an ACQUITY UPLC System, coupled with Xevo G2 Tof MS. Data acquisition was performed in positive ion using UPLC-MSE, a patented method of data acquisition that acquires both precursor and product ion data on virtually every detectable compound in the sample.

5 μL of sample was injected onto an ACQUITY UPLC BEH, 1.7 μm, 2.1 x 50 mm column and run with either a 2 or 10 min gradient with a flow rate of 0.7 mL/min. The mobile phase consisted of 0.1% ammonium hydroxide (A) and methanol (B).

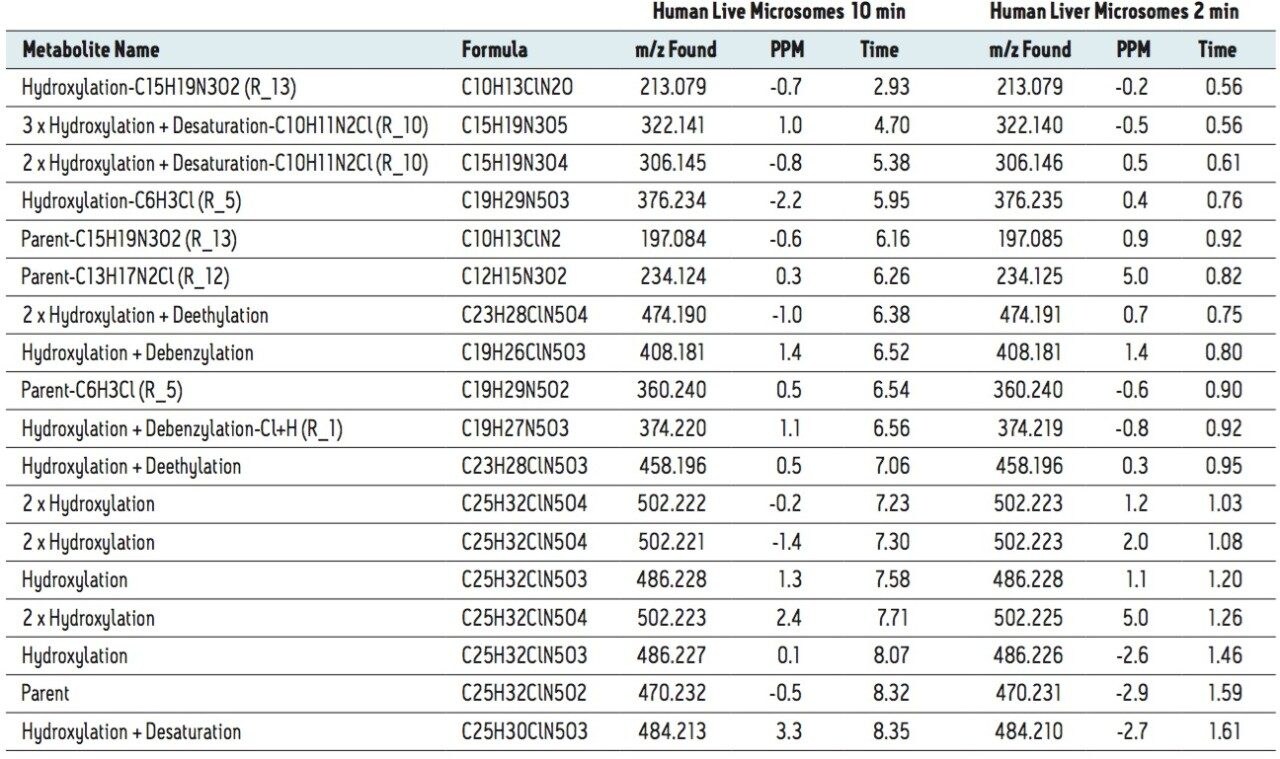
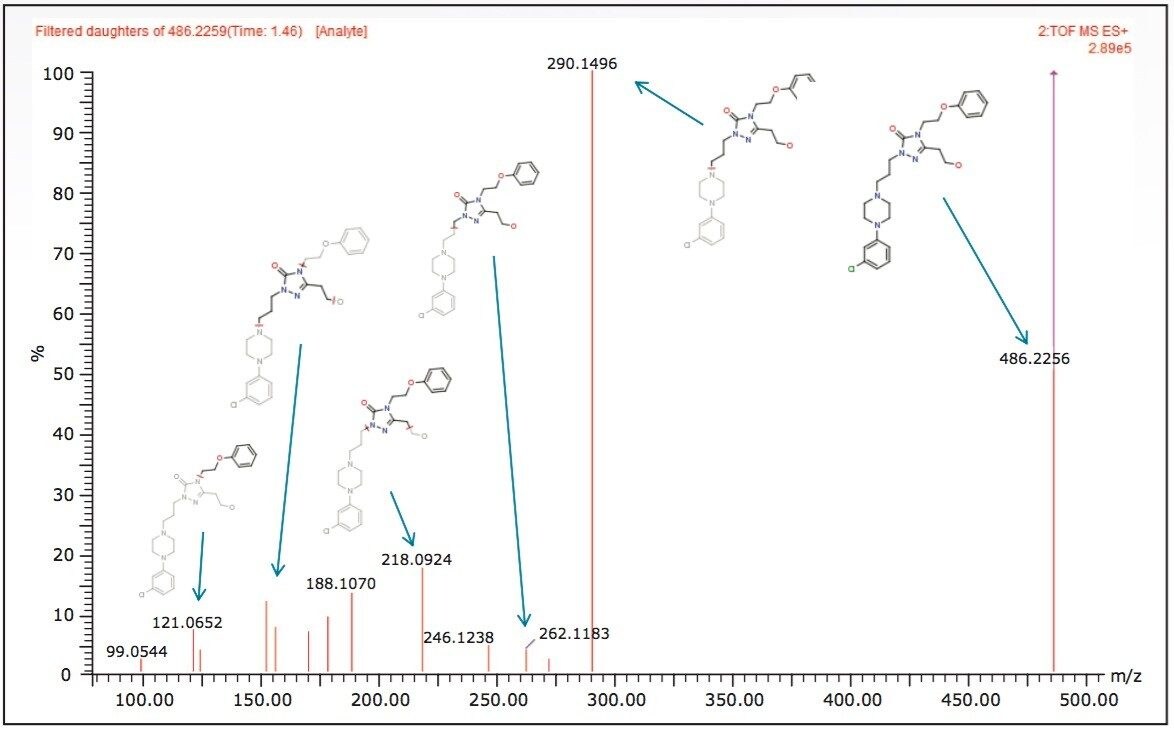
MSE data were automatically processed and analyzed using MetaboLynx XS Software. The results for human microsomal met ID are shown in Table 1. In this table, we compared the results of a 2 min gradient analysis with 10 min typical results. For the 10 min run, all metabolites greater than 1% (by MS area counts) have been reported. In the 2 min dataset, all major metabolites found in the extended gradient were found and reported using the automated metabolite identification approach. Software processing was completed in less than 2 min from a single analyte injection. Chemically intelligent tools such as MassFragment and dynamic mass defect filters were then applied to identify not only common biotransformations, but also to predict and detect more uncommon metabolites. This critical step ensures that more complex metabolites, which are often significant routes of clearance, are not overlooked, resulting in a more concise and accurate list of biotransformations. By comparison, a conventional identification performed to this level of detail in a traditional manner, may take a day or more.

Metabolites automatically identified above a 1% threshold (by MS area) in both the 2 and 10 min runs.
Table 1. Metabolites automatically identified above a 1% threshold (by MS area) in both the 2 and 10 min runs.

Figure 1 shows a summed XIC for the 10 most intense metabolites in the A) 2 minute and B) 10 minute gradient.

Extracted ion chromatogram.
Figure 1. Extracted ion chromatogram of the major metabolites for the A) 2 min analysis and B) 10 min analysis.

As MSE data contains both precursor and fragment ion information, a second crucial software step was performed during post acquisition analysis. The precursor and their related fragment ions were aligned. In this step, background and co-eluting fragment ions unrelated to a metabolite were removed, providing a clean and accurate fragment spectrum free of erroneous fragments enabling confident automatic structural elucidation. Figure 2 shows the MSE fragment spectrum for a metabolite identified in the 2 min analysis. It can be seen that high quality fragment spectra can be obtained even with the shortened (ballistic) gradient.

MSE fragment ion spectra.
Figure 2. MSE fragment ion spectra of a hydroxylated metabolite of nefazodone. MassFragment Software was used to automatically determine the identity of the product ions as part of the metabolite identification workflow.

Conclusion

This technical brief outlines a simple rapid approach for the detection and analysis of drug candidate metabolic profiles. Using MetaboLynx and the built-in chemical intelligence tools allow the scientist to confidently assess compounds and perform complex analyses.

Harnessing the power of UPLC-MSE and high resolution bench top instrumentation, such as the Xevo G2 Tof, provides scientists with the tools to carry out relevant studies and generate data to help inform key program decision makers, and drastically reduces turnaround time.

720003837, December 2010

Back To Top Back To Top