
Extending PFAS Analytical Workflows with APGC-MS/MS Analysis: A Method for 35 GC-Amenable PFAS Compounds
Kari Organtini, Ken Rosnack, Frank Dorman, Kevin Stup
Waters Corporation, United States
Published on August 03, 2026

Abstract
An APGC-MS/MS method for the analysis of 35 GC-amenable per- and polyfluoroalkyl substances (PFAS) is presented, enabling labs to extend existing workflows to capture volatile and semi-volatile PFAS. The analysis includes fluorotelomer alcohols (FTOH), acrylates (FTAcr), methacrylates (FTMAC), acetates (FTOAc), sulfonamides (PFSA) and sulfonamidoethanols (PFSE). Method development and optimization, including column and inlet liner selection, is discussed. The goal of the method is to allow for injection of samples pre-extracted for LC-MS/MS analysis that are mainly in methanol and water. Method lower limits of quantification (LLOQ) ranged from 0.005 – 5.0 ng/mL, with most compounds being below 0.10 ng/mL.
Benefits
- An APGC-MS/MS method for the analysis of 35 GC-amenable PFAS allowing for characterization of PFAS samples beyond the suite of commonly targeted LC-MS/MS compounds, for a more complete assessment of PFAS burden
- Injection of samples already extracted for LC-MS/MS analysis is possible without having to perform solvent exchange, saving time and labor
- Sensitive and robust analysis to detect trace levels of PFAS in samples
Introduction
Routine PFAS analysis most commonly utilizes liquid chromatography (LC) as the separation technique and is the basis for most standardized methods that are currently available. While this is a key technique in the analysis of PFAS, there are classes of volatile and semi-volatile PFAS that do not chromatograph well using LC and require the use of gas chromatography (GC) to be successfully analyzed. Classes of PFAS that favor GC analysis include, but are not limited to, fluorotelomer alcohols (FTOH), fluorotelomer acrylates (FTAcr), fluorotelomer methacrylates (FTMAC), and fluorotelomer acetates (FTOAc). Additionally, there are classes that can be analyzed using both LC and GC techniques, including sulfonamides (PFSA) and sulfonamidoethanols (PFSE).
All of these compounds are considered precursor compounds that terminally transform into the most widely studied PFAS, perfluoroalkyl carboxylates (PFCA) and perfluoroalkyl sulfonates (PFSA). Not only are they precursors in the synthesis of PFCA and PFSA end products, they are also intentionally used in products such as food packaging and textiles to impart grease and water proofing qualities.
These precursor compounds are also discharged into the environment through similar routes as their end products (landfills, manufacturing waste, firefighting foams, etc), but also through volatilization, transport and deposition through the atmosphere either in the gas phase or bound to particulates. Like most PFAS, not much is known about the human toxicity of these particular PFAS, although some animal and in vitro studies do point to similar health effects as more commonly studied PFCAs and PFSAs, including liver and kidney toxicity, endocrine disruption and negative immune effects.1-4 Furthermore, their ability to transform in the environment to PFCAs and PFSAs, which are known to have toxic health implications, make them of concern.
GC-MS/MS analysis for the volatile and semi-volatile GC amenable PFAS provides an additional tool in the workflow of PFAS sample analysis, increasing the comprehensiveness of sample characterization. In this application note, the development of an atmospheric pressure gas chromatography (APGC) coupled to tandem quadrupole mass spectrometry (MS/MS) method will be presented. Application of this method to authentic samples will be explored in a companion application note.
Experimental
Sample Preparation
Native PFAS standards were purchased from Wellington Laboratories and AccuStandard. Isotope labeled internal standards were purchased from Wellington Laboratories.
Calibration curves to assess method sensitivity were prepared from 0.01 to 50 ng/mL for all compounds, except the sulfonamides at 0.10 to 500 ng/mL due to lower sensitivity of this group of PFAS compounds. The concentration range for each compound used for quantitation is highlighted later in Table 1.
Proton transfer conditions were established in the APGC source using three vials of water in the source door tray. Each vial was capped with a small piece of capillary tubing pierced through the vial cap.
Isopropyl alcohol (IPA) and methanol were used as wash A and B, respectively, in the GC autosampler. Both pre and post injection washes were performed. IPA was found to help reduce carryover of the sulfonamide compounds.
GC Conditions
|
GC system: |
Agilent 8890 |
|
Autosampler: |
7693A ALS |
|
Column: |
Rtx-200 GC Capillary Column, 30 m x 0.25 mm ID, 0.50 µm |
|
Inlet liner: |
Siltek Deactivated Straight with Wool (4.0 x 6.5 x 78.5 mm) |
|
Carrier gas: |
Nitrogen |
|
Flow rate: |
2 mL/min |
|
Injection: |
Pulsed Split (40 psi until 0.6 minutes) |
|
Split ratio: |
10:1 |
|
Injection port temperature: |
240 °C |
|
Injection volume: |
1 µL |
|
Makeup gas: |
Nitrogen at 300 mL/min |
|
Transfer line temperature: |
310 °C |
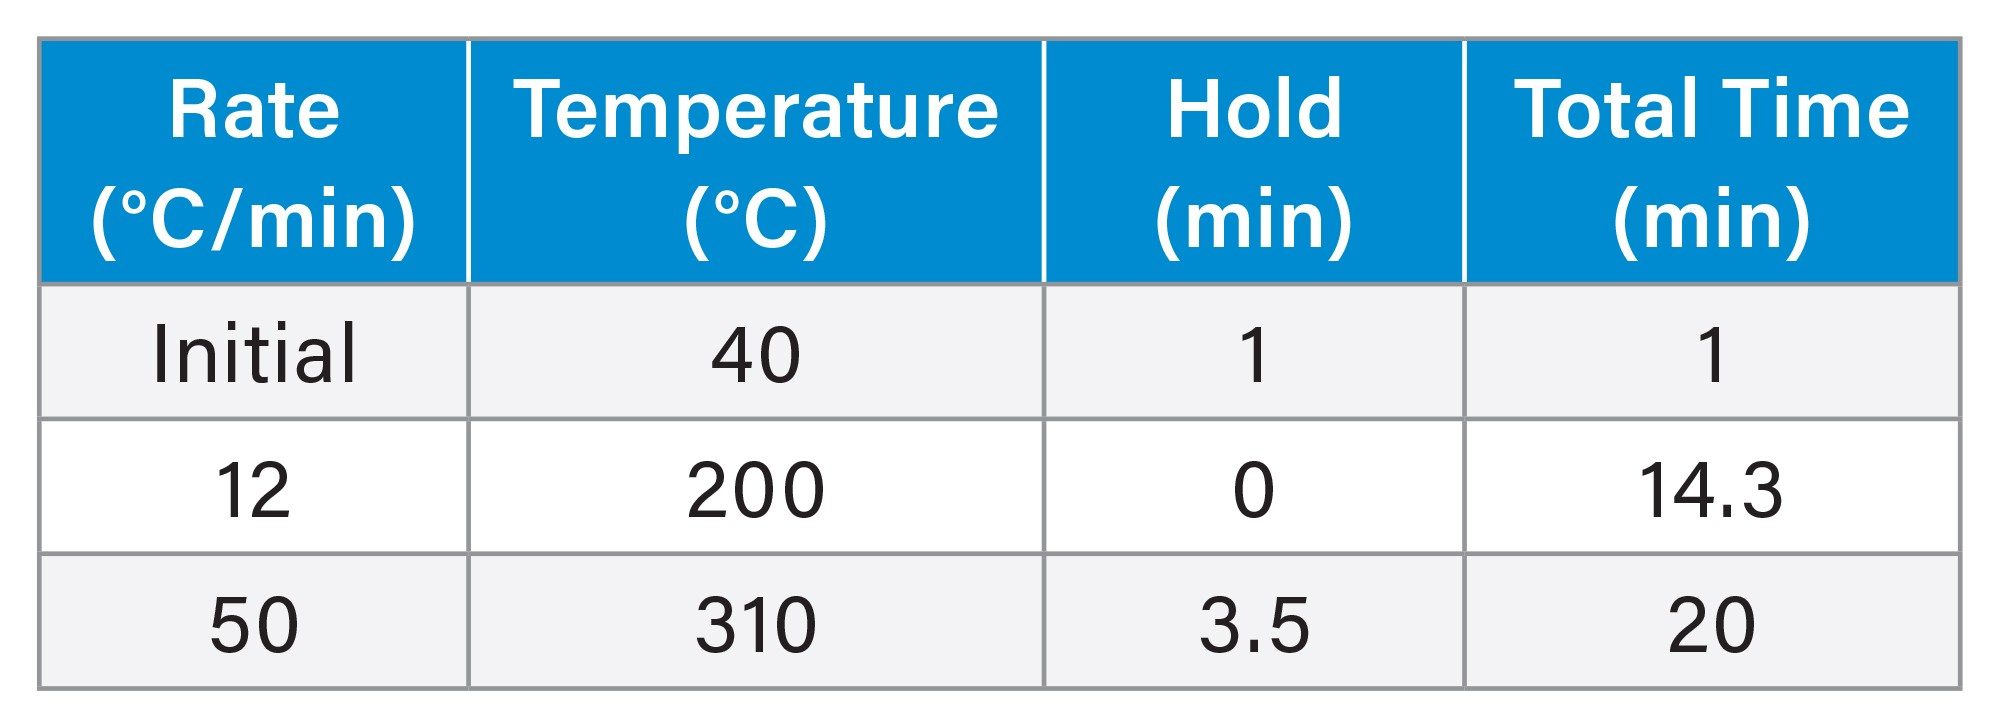
Oven Program
MS Conditions
|
MS system: |
Xevo™ TQ Absolute Mass Spectrometer |
|
Ionization mode: |
API+ |
|
Ionization mechanism: |
Proton transfer (water) |
|
Source temperature: |
150 °C |
|
Corona current: |
1.0 µA |
|
Cone gas flow: |
250 L/hr |
|
Auxiliary gas flow: |
150 L/hr |
|
MRM method: |
See Appendix for Full MRM Method details |
MS Conditions for x:1 FTOH Compounds
|
Corona current: |
3.0 µA |
|
Cone gas flow: |
650 L/hr |
|
Auxiliary gas flow: |
250 L/hr |
Data Management
|
Software: |
waters_connect™ for Quantitation Software |
Results and Discussion
Advantage of APGC
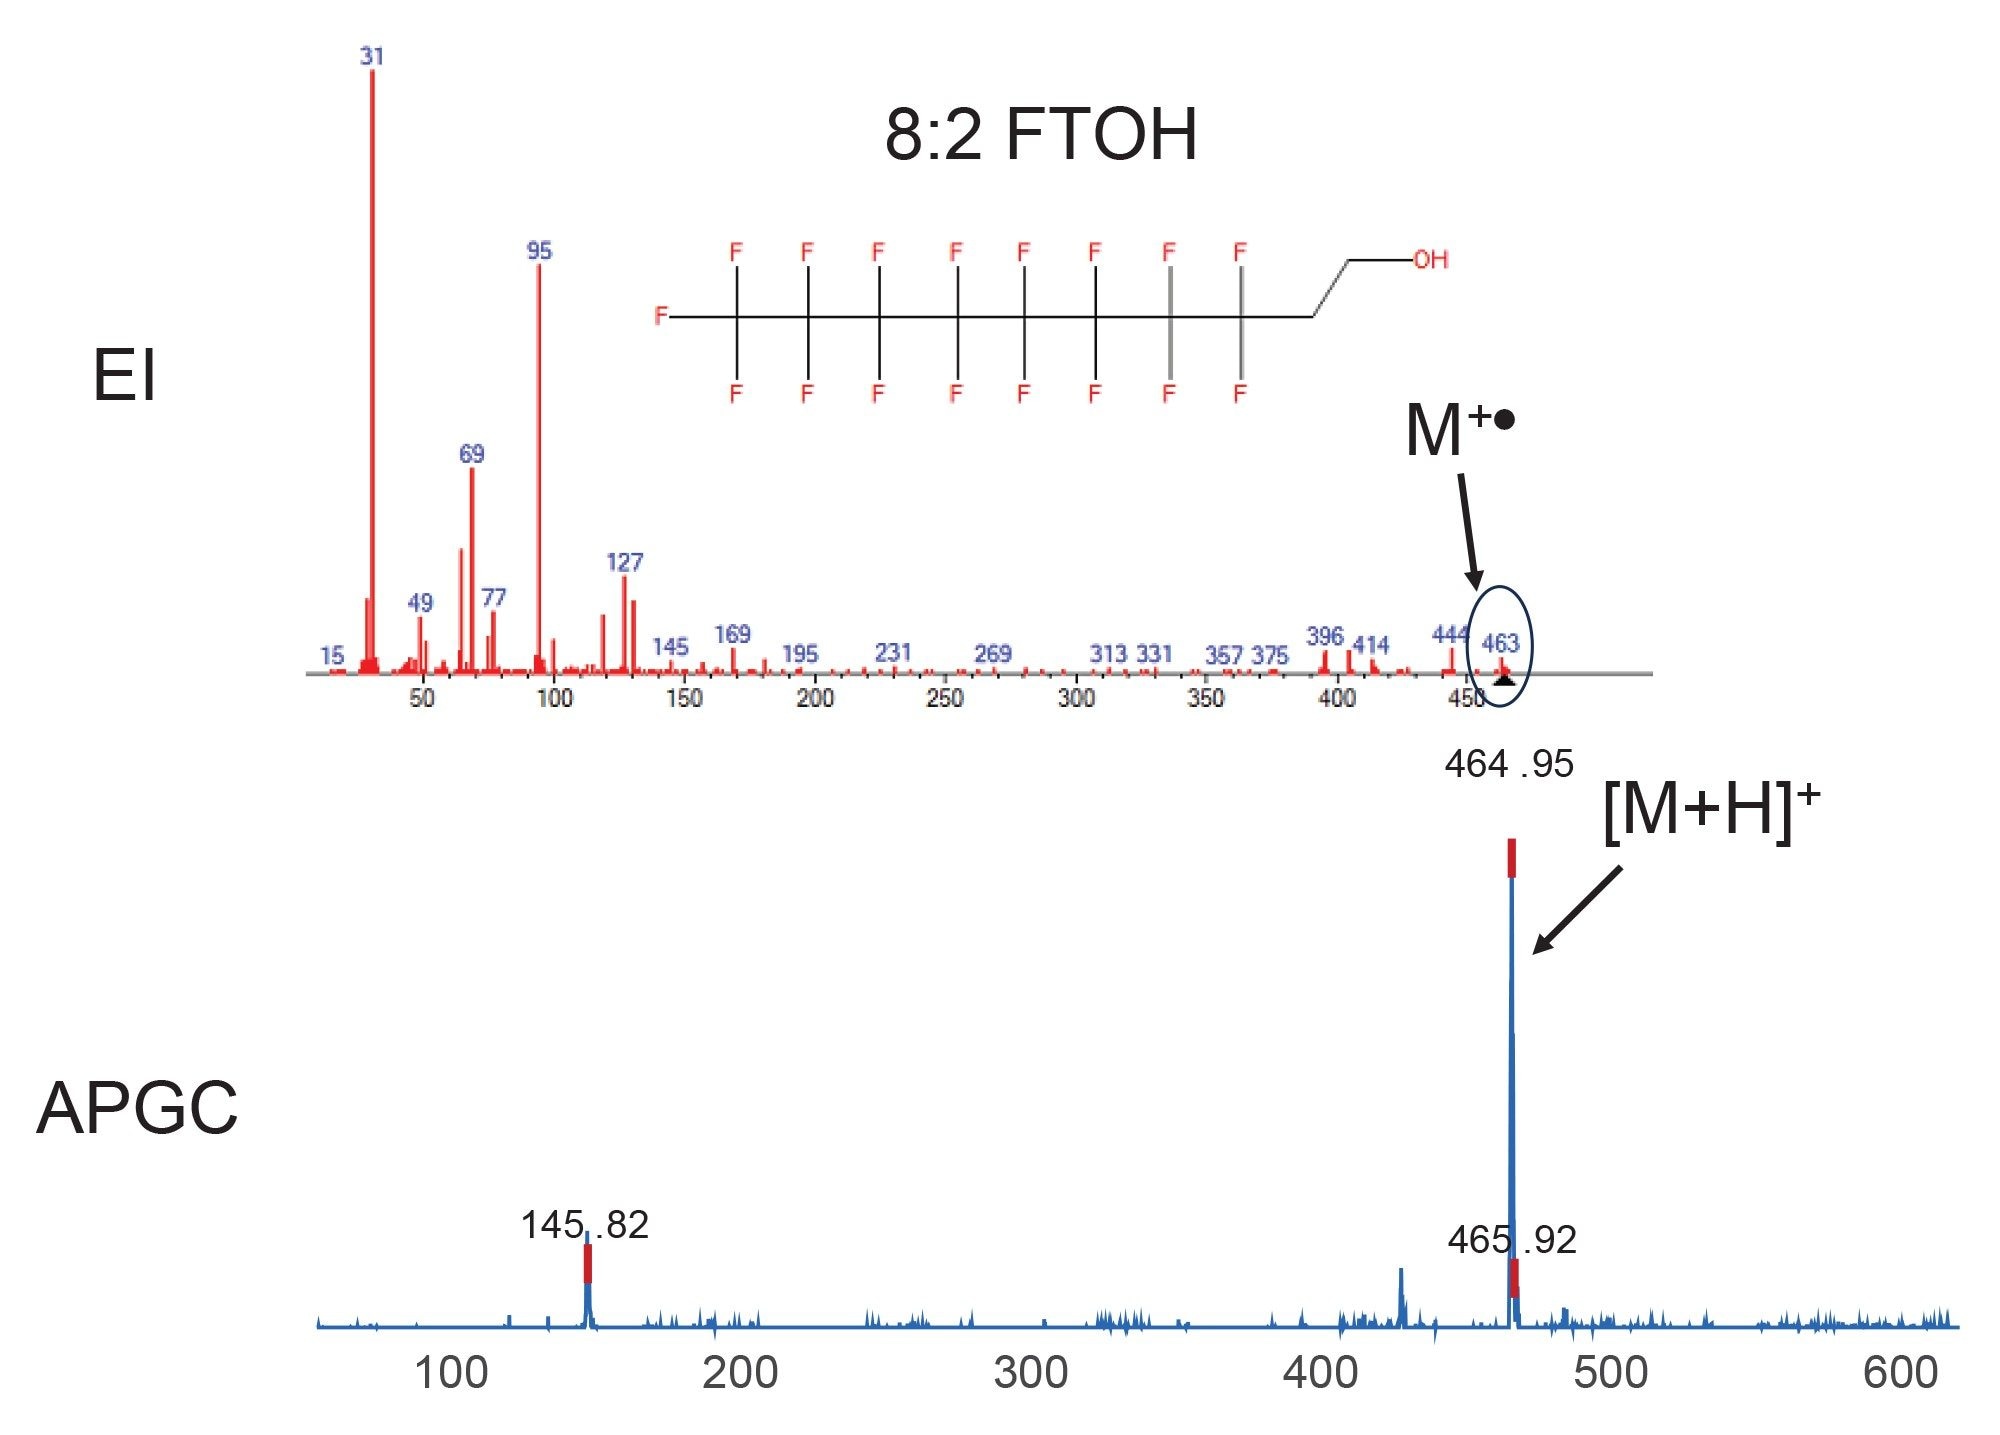
APGC has an advantage over traditional electron ionization (EI) as it is a softer ionization technique, allowing the molecular ion to remain intact during the ionization process. A full scan APGC mass spectrum for 8:2 FTOH is shown in Figure 1, compared to an EI mass spectrum obtained from the NIST library. The molecular ion in EI mode should be present at m/z 364, but this compound is completely fragmented upon ionization, leaving only low mass fragments for use as the precursor mass for MRM transitions. In contrast, using APGC ionization, the [M+H]+ molecular ion at m/z 365 is abundantly present, allowing much more selective and sensitive MRM transitions for analysis. This improved selectivity and molecular ion preservation enables more confident compound identification, particularly in complex matrices.
Method Development
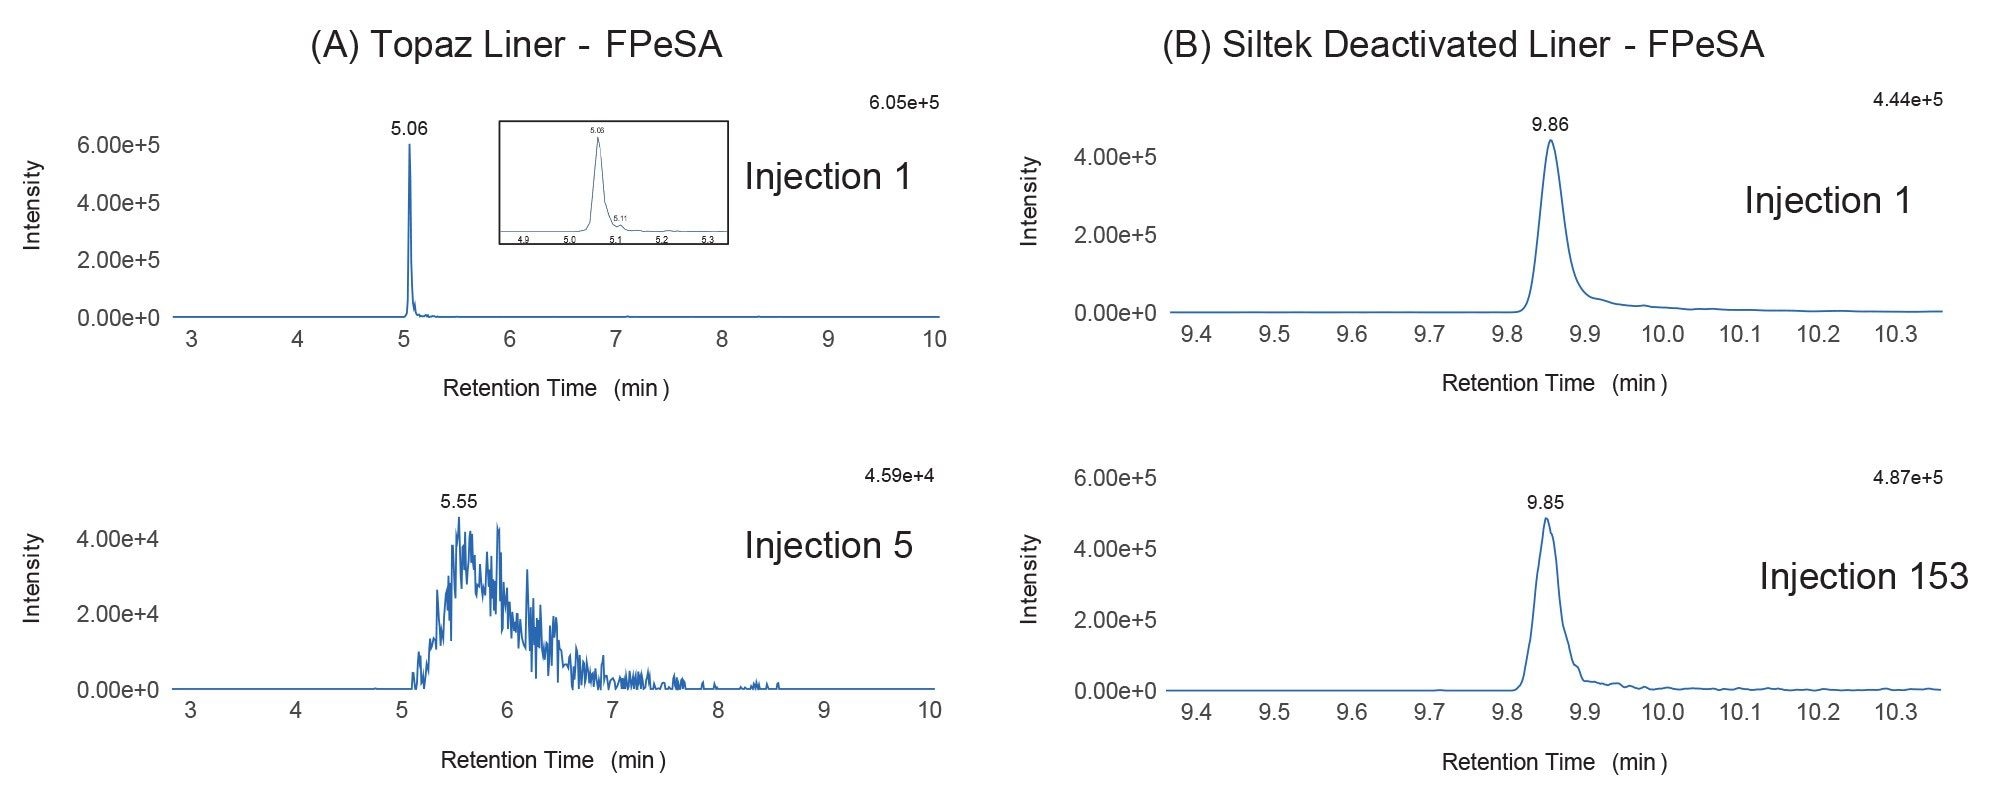
When developing the GC method, inlet liner choice was an important factor in achieving repeatable injections due to the reactivity of the sulfonamide compounds in the GC inlet. Initial injections were performed on a Restek topaz liner and the rapid degradation of the sulfonamides can be seen in Figure 2A. Changing inlet temperature and pressure did not resolve this issue. The inlet liner was changed to a siltek deactivated liner which proved to be more suitable for the reactive sulfonamide compounds, allowing them to be included in the method. Figure 2B demonstrates the stability of the sulfonamides using this inlet liner over more than 150 injections.
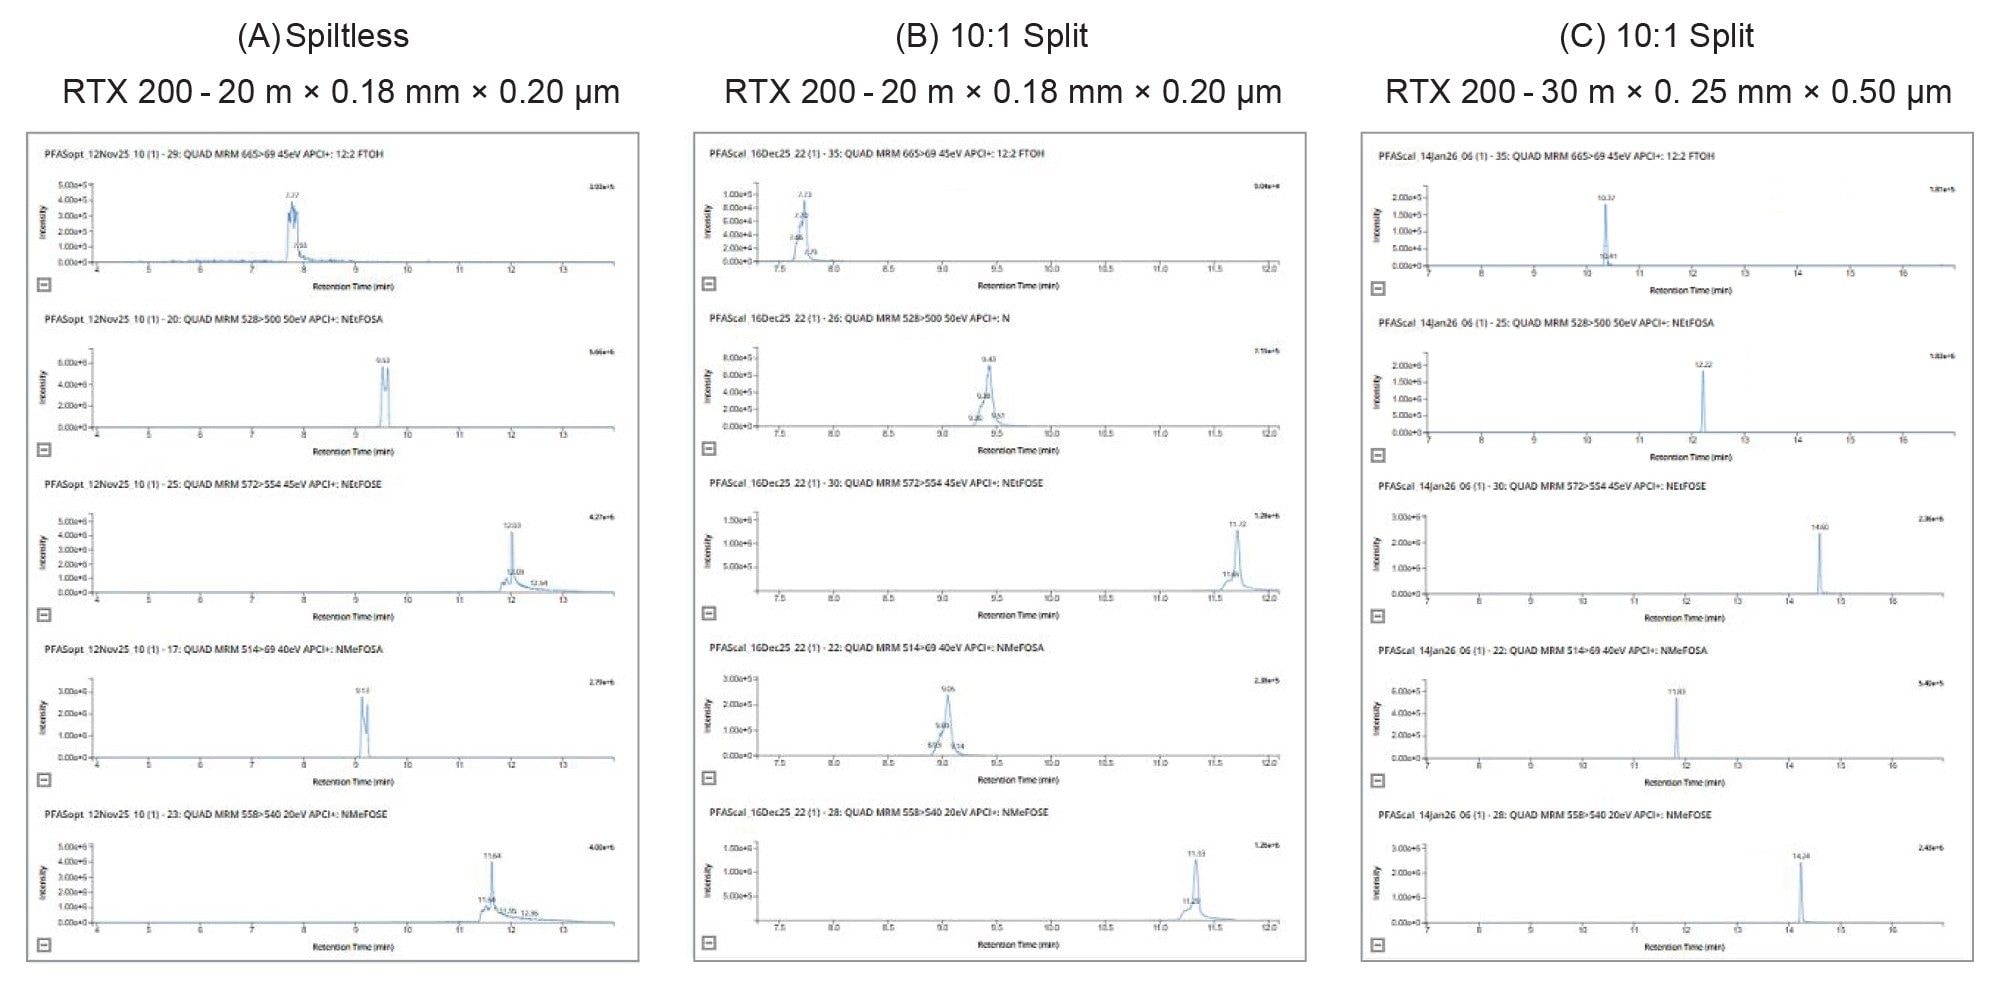
Typically, sample extracts that are prepared for LC-MS analysis are not considered to be in a GC friendly sample composition. Since the intention of this method was to be an additional tool in the PFAS analysis workflow, the goal was to be able to inject the same samples prepared for LC-MS analysis without a solvent exchange that could cause loss of the volatile compounds. For this method, the sample composition to be injected was approximately 94% methanol, 4% water, 1% ammonium hydroxide and 0.6% acetic acid, following sample extraction using EPA Method 1633.5 Figure 3 demonstrates the improvement of peak shape by utilizing a split injection and a thicker film column. Figure 3A and 3B utilized a 20 m x 0.18 mm x 0.20 µm with splitless and 10:1 split injections, respectively. In both cases, the peak shape was still broad and peaks were split, indicating the inefficient transfer onto the column and/or column overload. When the 10:1 split was performed on a longer and thicker film column (30 m x 0.25 mm x 0.50 µm) the peak shape was corrected to sharp, gaussian peaks (Figure 3C), proving that the sample extract containing water and acetic acid can be injected onto a GC.
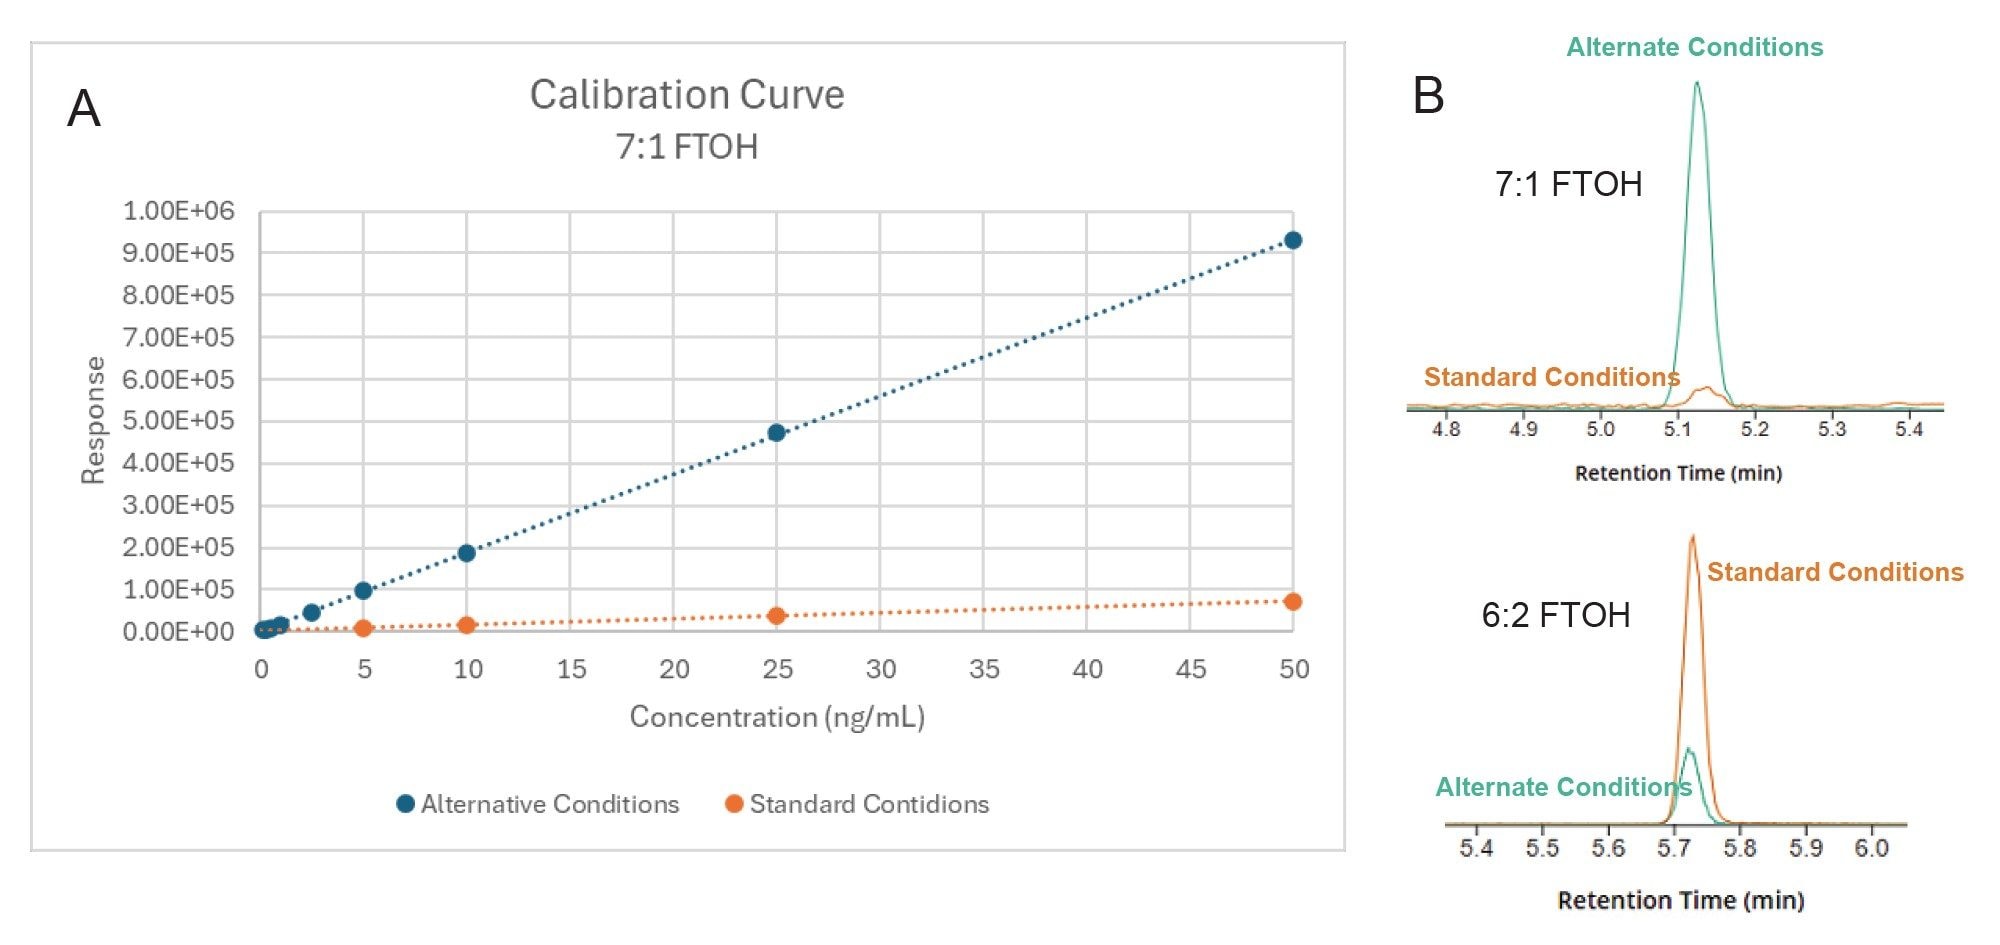
During source optimization for conditions like corona current, cone gas flow and auxiliary gas flow, all compounds optimized around the same conditions (standard conditions) except for the x:1 fluorotelomer alcohols (FTOHs). These compounds favored a higher corona current and higher gas flows. Under these conditions (alternative conditions), the response was increased for these compounds by about 10x. This is demonstrated in Figure 4A showing the overlay of calibration curves for 7:1 FTOH run using both sets of conditions. The source conditions optimal for the x:1 FTOH compounds were not suitable for the rest of the PFAS in the method, as demonstrated in Figure 4B, showing the peak response for 7:1 FTOH and 6:2 FTOH under both source methods. The set of standard conditions are recommended for general use of this APGC-MS/MS method, unless the x:1 FTOH compounds are of importance and/or maximum sensitivity is not required for all compounds.
Method Performance
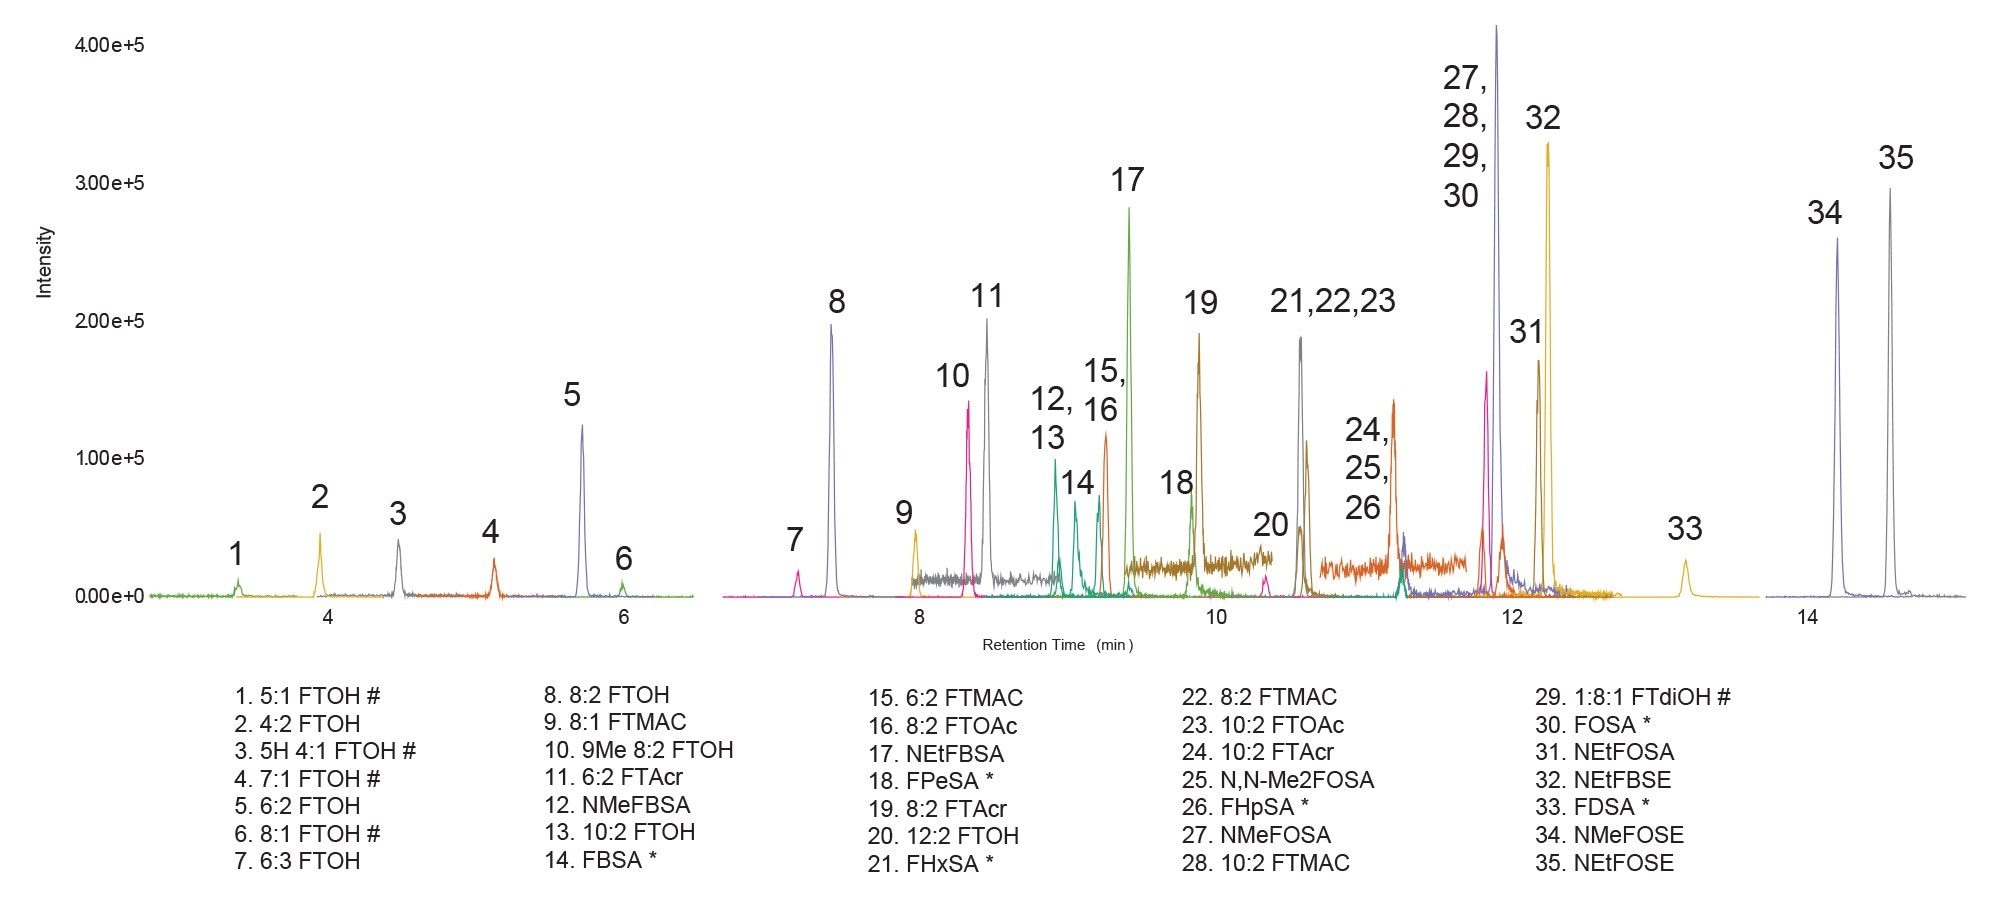
An example chromatogram of the final optimized method can be seen in Figure 5 showing an overlay of all 35 PFAS compounds resolved over the GC temperature gradient.
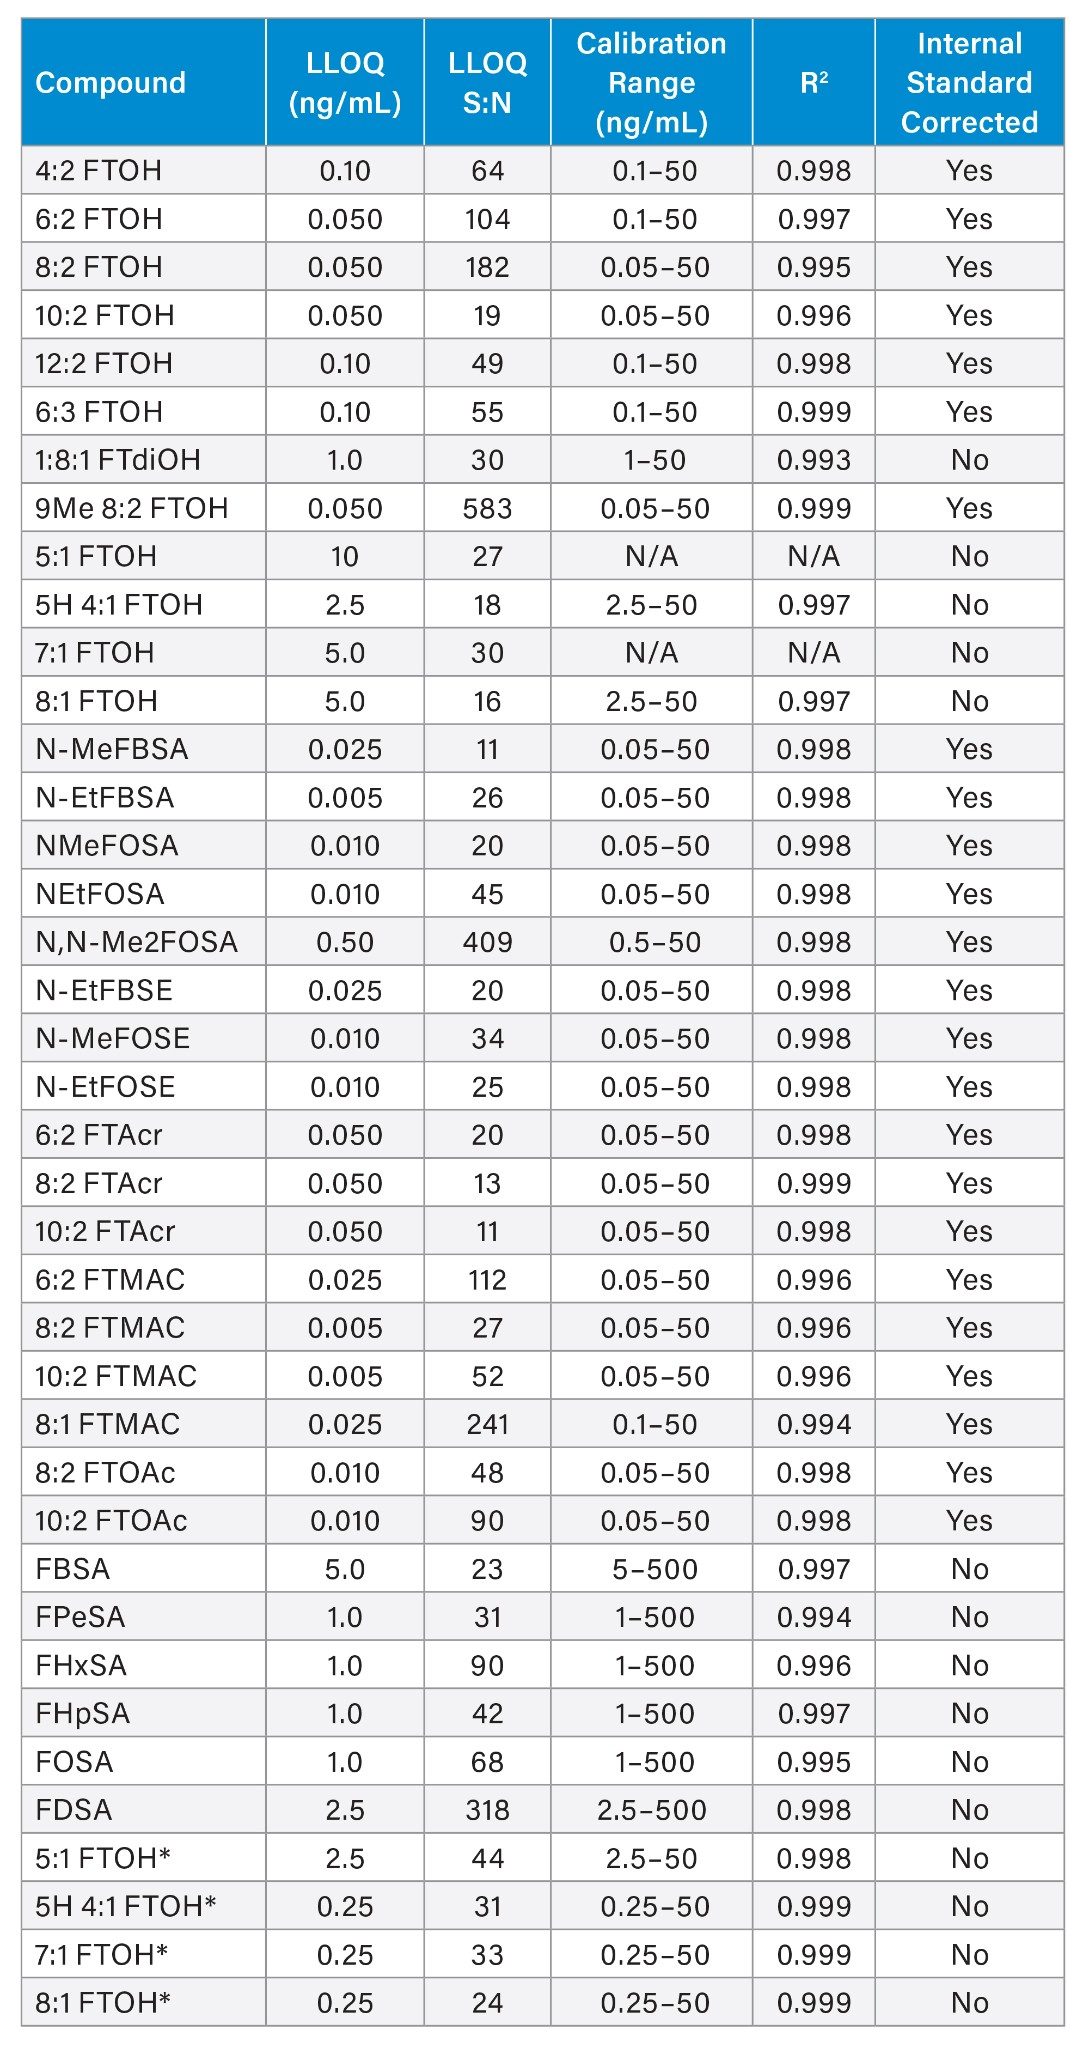
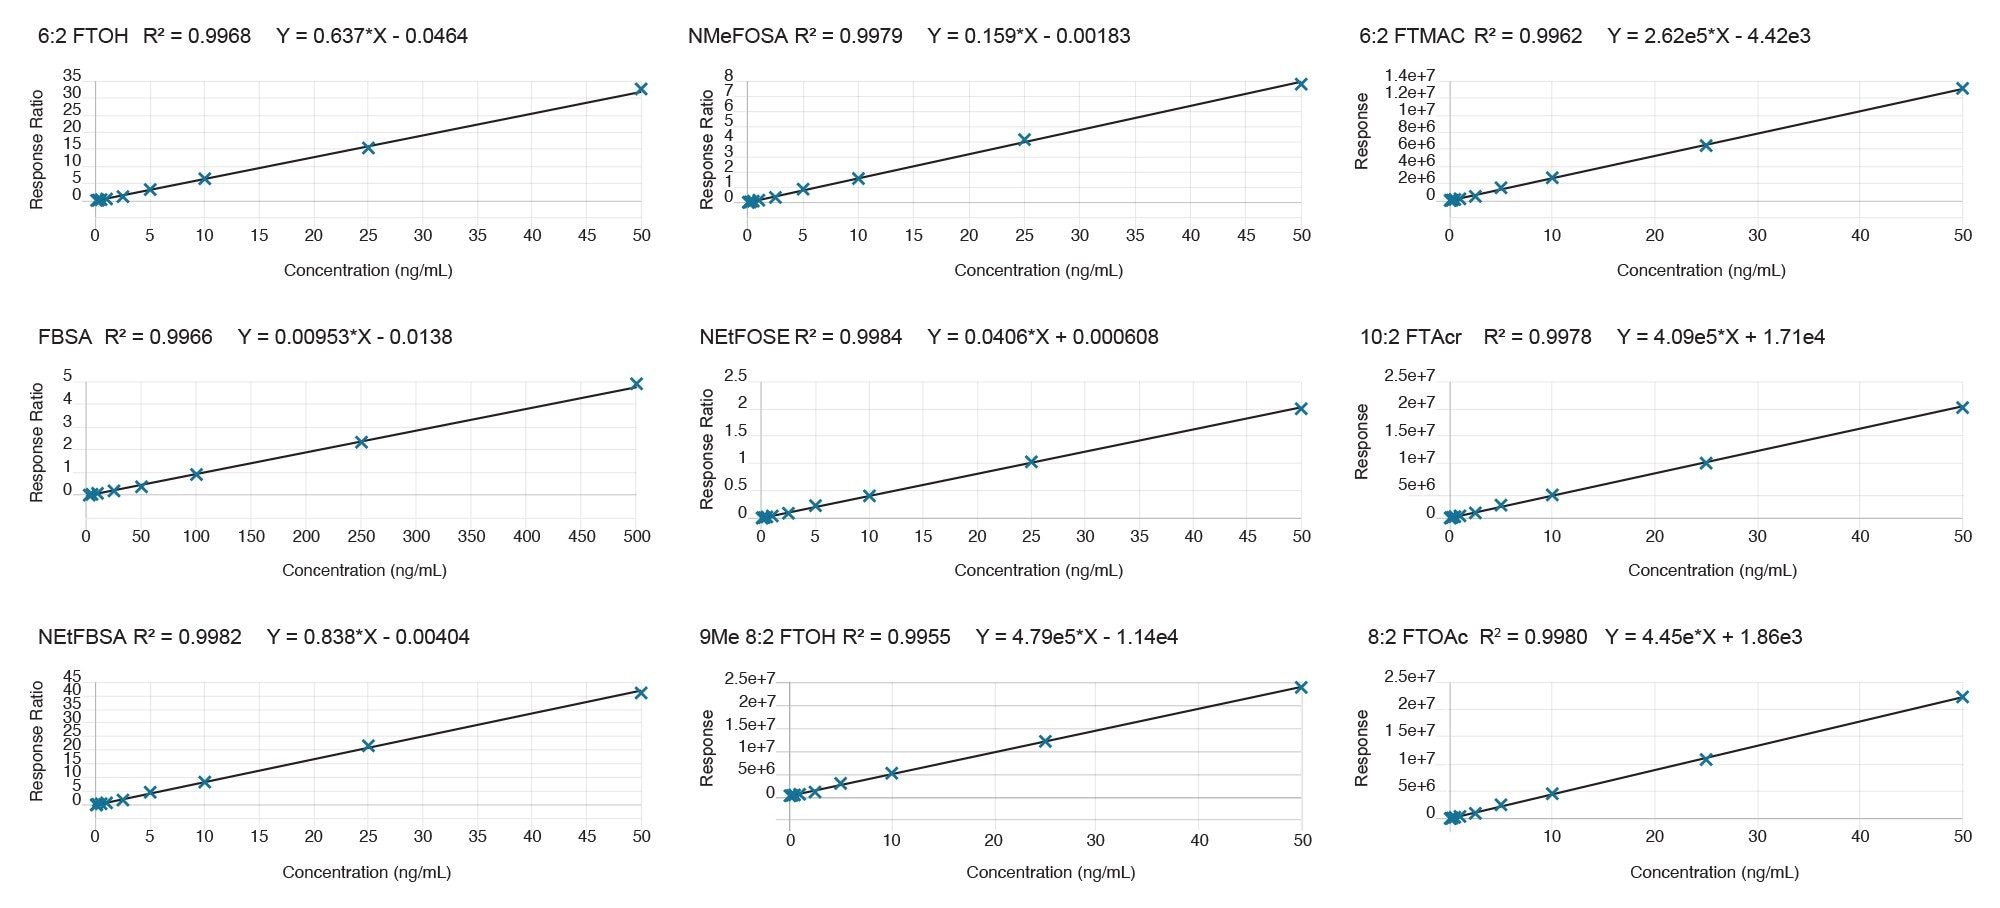
Using this optimized method, a calibration curve was run. Selected calibration curves are shown in Figure 6, one compound from each class of PFAS represented is included. The linearity across the calibration range for every compound was excellent, regardless of whether internal standard correction or an external curve type were used, with all R2 values > 0.993. The calibration range, linearity and whether or not an internal standard was used for quantitation are all listed in Table 1.
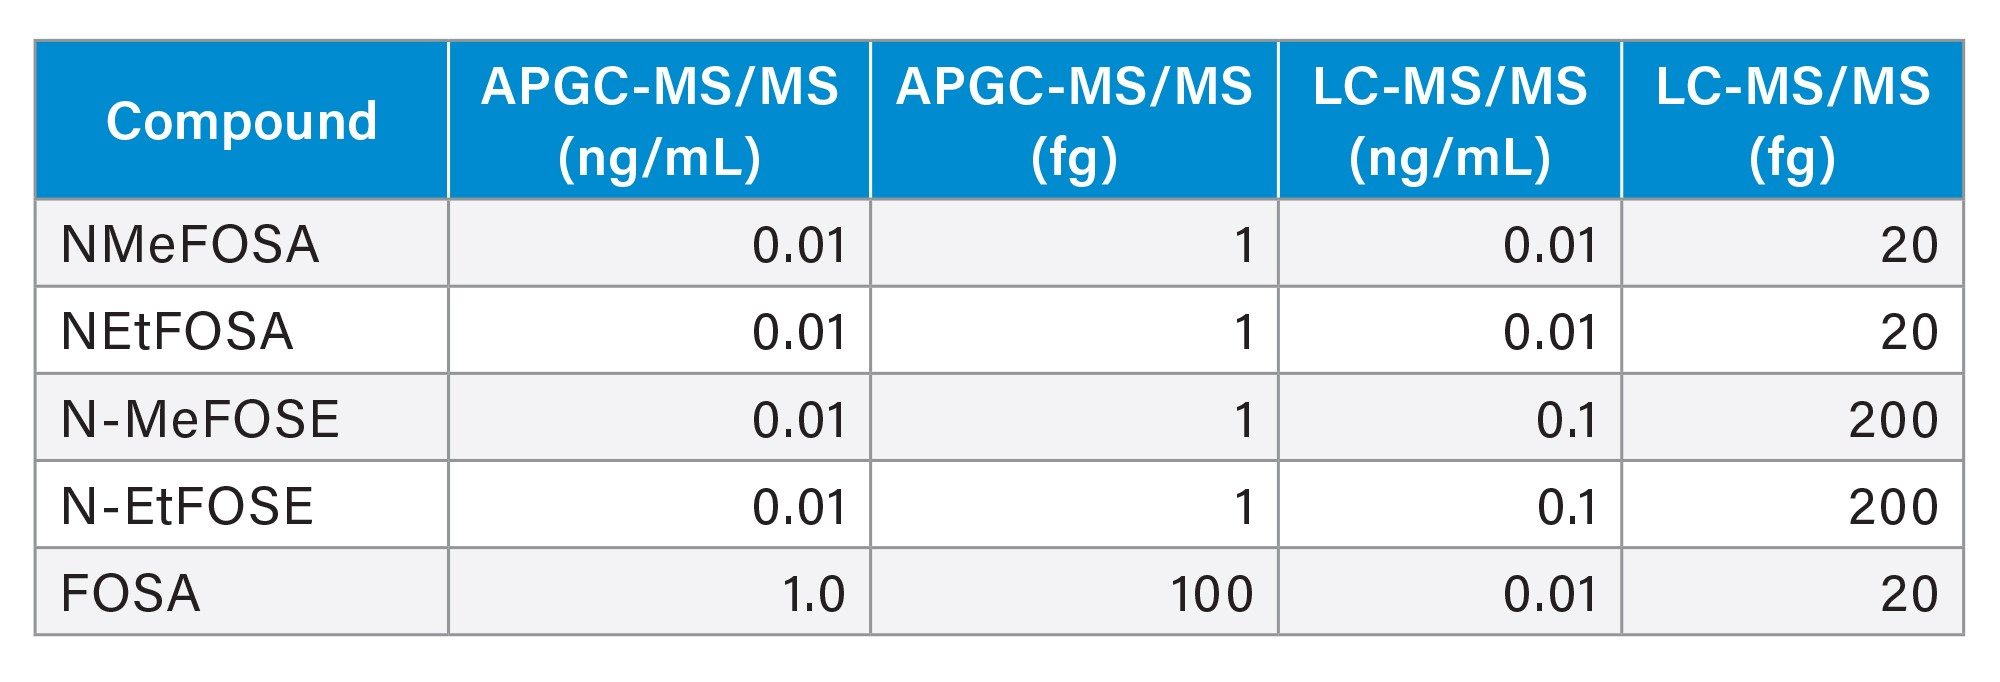
The LLOQ was determined to be the lowest level that the signal:noise (S:N) was ≥10 and both the quantitative and qualitative ions were present. The LLOQ value for every compound, along with the S:N value at that level, is listed in Table 1, with the LLOQ values provided for both the standard and alternative source conditions for the x:1 FTOH compounds. LLOQs ranged from 0.005 – 5.0 ng/mL, with most being below 0.10 ng/mL. Additionally, there are five PFAS that were included in the APGC-MS/MS method that are also included in most standard LC-MS/MS methods. Those five compounds are listed in Table 2, along with the LLOQ values determined in the LC-MS/MS analysis method.6 LLOQs are listed both as a ng/mL concentration, but also as fg on column (determined by injection volume and split value for GC analysis). In terms of fg on column sensitivity, APGC is actually 20 – 200 times more sensitive for N-MeFOSA, N-EtFOSA, N-MeFOSE and N-EtFOSE. For FOSA, APGC is 5 times less sensitive, meaning that LC-MS/MS may be a better option for that and similar sulfonamide compounds. Overall, the APGC-MS/MS method was demonstrated to be a very sensitive option for PFAS analysis.
Conclusion
An optimized APGC-MS/MS method for the analysis of 35 GC amenable PFAS has been presented, providing a practical way to extend existing workflows with sensitive and accurate analysis for fluorotelomer alcohols, acrylates, methacrylates, acetates, sulfonamides and sulfonamidoethanols. This approach could integrate seamlessly with existing LC-MS/MS workflows, allowing labs to extend compound coverage without requiring changes to established sample preparation protocols. Performance for all compounds was found to be optimal with the use of a siltek deactivated inlet liner and a 30 m x 0.25 mm ID, 0.50 µm Rtx-200 column. This configuration allows for the injection of samples pre-extracted for LC-MS/MS analysis that are in mainly methanol and water, allowing labs to generate additional insights without increasing sample prep burden. Method LLOQs ranged from 0.005 – 5.0 ng/mL, with most compounds being below 0.10 ng/mL, delivering robust performance across compound classes, indicating the method can be used for trace level applications. Overall, APGC-MS/MS adds a complementary capability to LC-MS/MS methods, allowing labs to comprehensively assess PFAS contamination for better understanding and informed regulatory or product safety decisions. Further application notes will demonstrate the use of this method in environmental and food packaging samples, highlighting how labs can gain more complete PFAS insights while leveraging existing workflows.
References
- Rosenmai, A.K.; et al. Fluorinated alkyl substances and technical mixtures used in food paper-packaging exhibit endocrine-related activity in vitro. Andrology. 2016;4(4):662-72.
- Ladics, G.S.; et al. 90-Day Oral Gavage Toxicity Study of 8-2 Fluorotelomer Alcohol in Rats. Drug and Chemical Toxicology. 2008; 31(2), 189–216.
- Serex, T.; et al. Toxicological evaluation of 6:2 fluorotelomer alcohol. Toxicology. 2014; 7;319:1-9.
- Wang, X.; et al. 8:2 Fluorotelomer alcohol causes immunotoxicity and liver injury in adult male C57BL/6 mice. Environ Toxicol. 201;34(2):141-149.
- US Environmental Protection Agency. EPA 1633A: Analysis of Per- and Polyfluoroalkyl Substances (PFAS) in Aqueous, Solid, Biosolids, and Tissue Samples by LC-MS/MS. December 2024.
- Organtini, k.; Rosnack, k.; Hancock, P. Analysis of Per- and Polyfluoroalkyl Substances (PFAS) in Accordance with EPA 1633 Part 1: Establishing and Assessing the Method. Waters Application Note. 720008117. 2023.
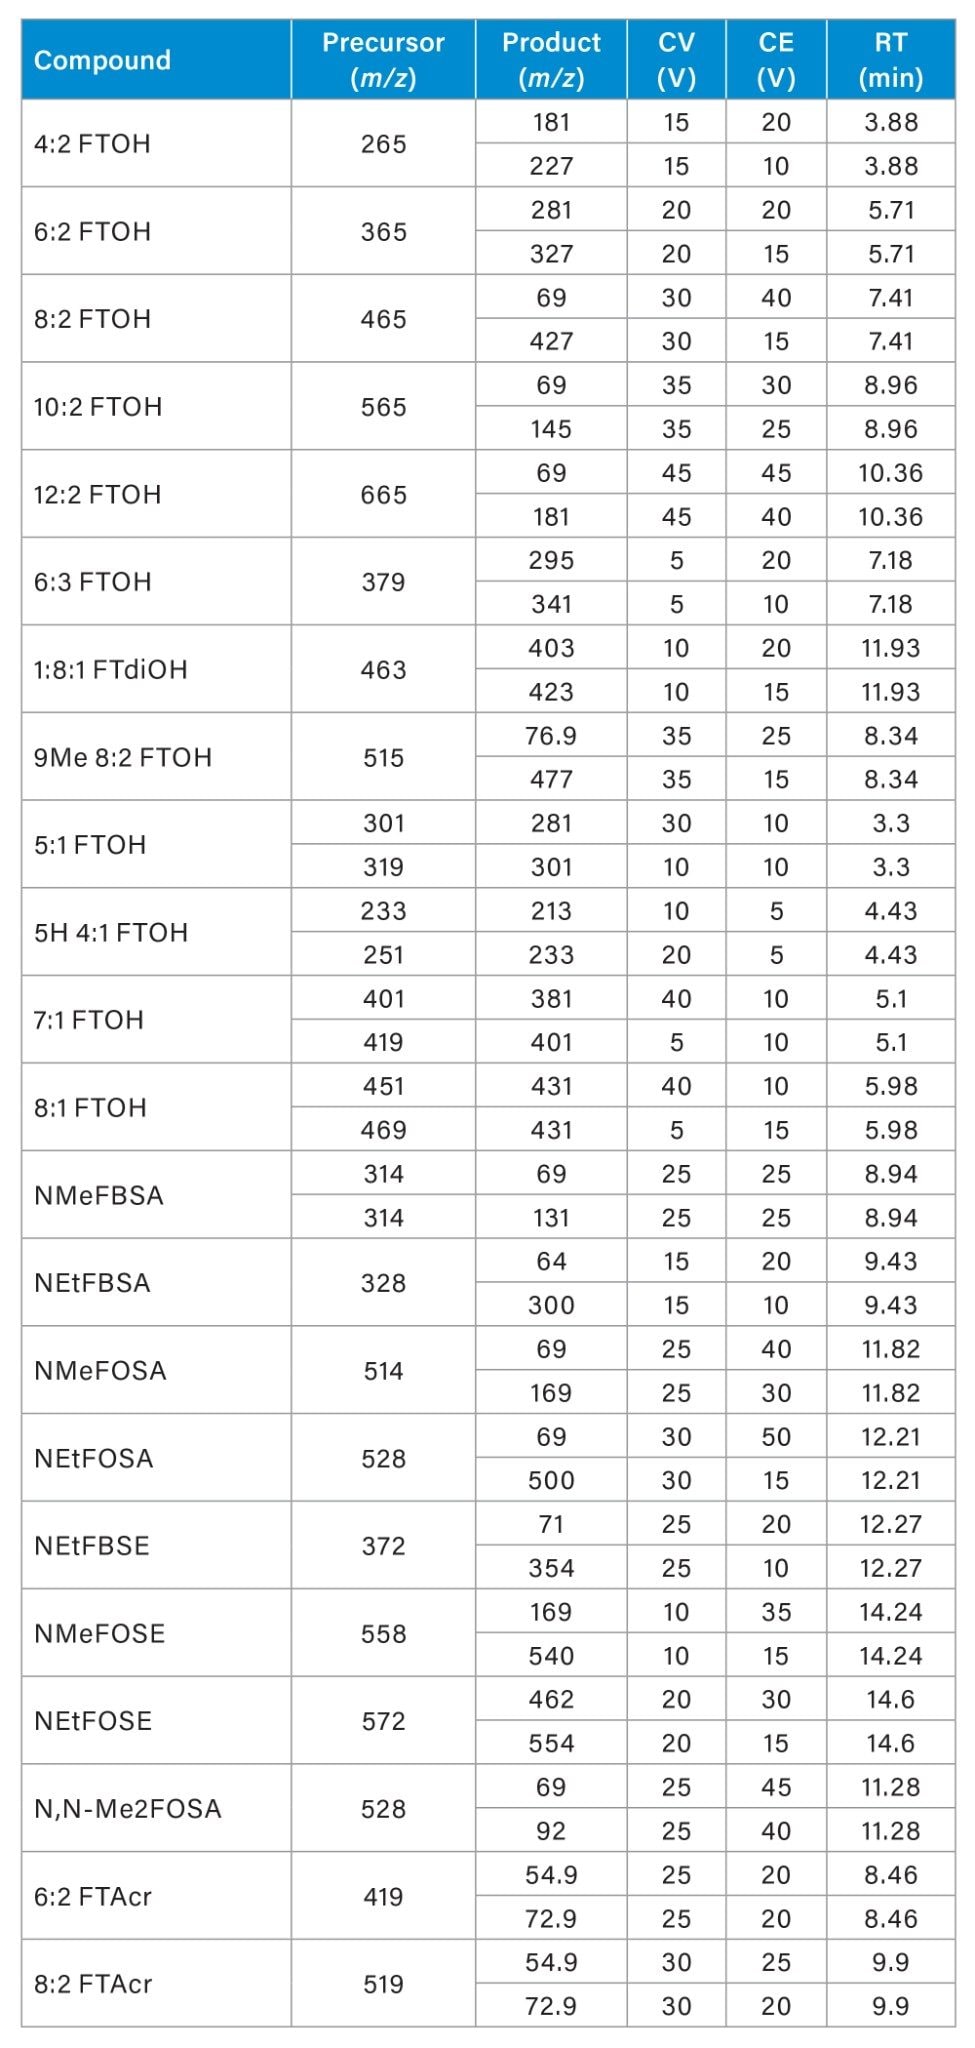
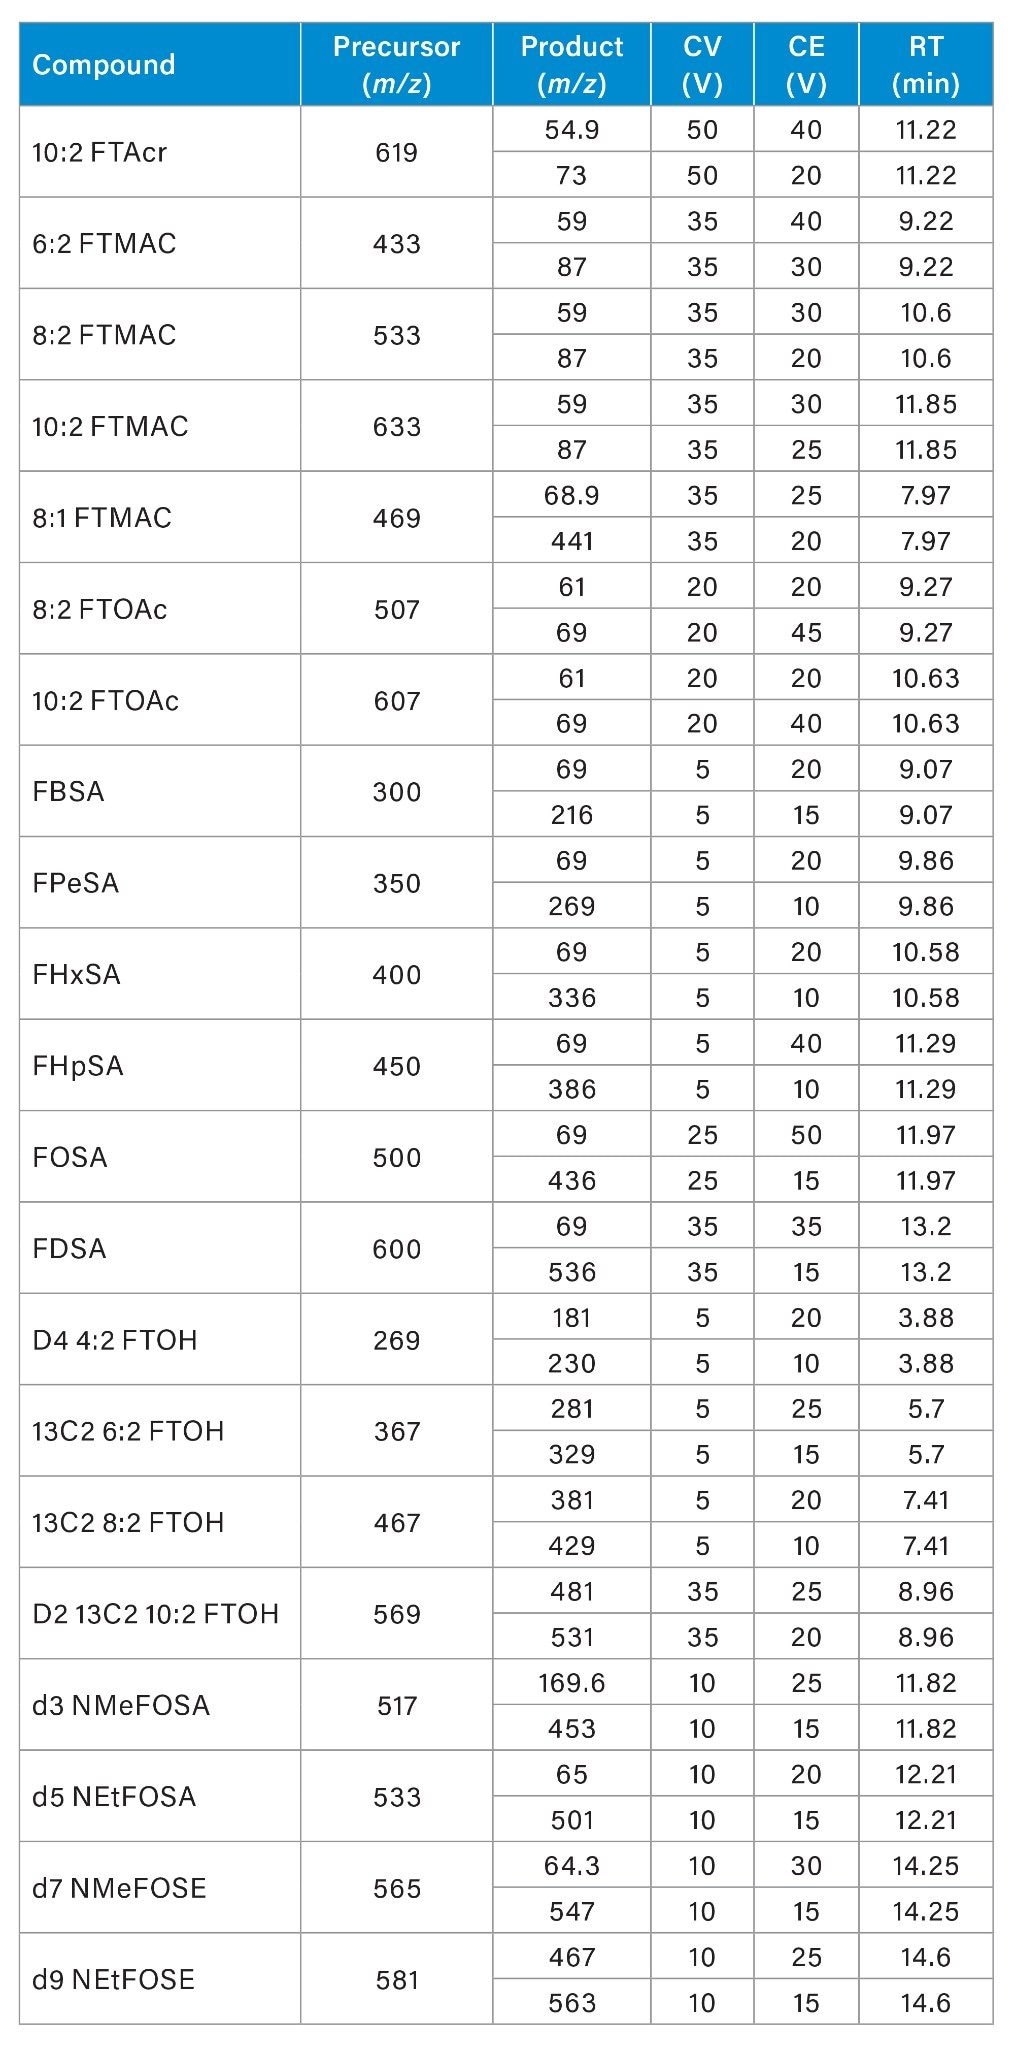
Appendix Table 1. APGC-MS/MS MRM Method Details
720009500, August 2026


