• Nota de aplicación

Methodology for the Identification of Pesticide Metabolites in Complex Matrices Using UPLC-ToF/MS(E) and the UNIFI Scientific Information System

Methodology for the Identification of Pesticide Metabolites in Complex Matrices Using UPLC-ToF/MS(E) and the UNIFI Scientific Information System

  • Marian Twohig
  • Michael O'Leary
  • Gareth E. Cleland
  • Waters Corporation

Abstract

Regulatory agencies require extensive documented and audited studies concerning the benefits and possible risks of using crop protection products before product registration can occur. Manufacturers must provide evidence of the potential human health and environmental effects. One such example includes the metabolic fate of the active ingredient(s) of a new product and the effects that potential metabolites can have on the overall environmental or human toxicity. Therefore, the accurate measurement of metabolites is important to assess the risk of exposure and to provide thorough product risk assessment. In this application note, we describe a comprehensive approach to metabolite identification in complex matrices using UPLC and high resolution mass spectrometry in conjunction with the UNIFI Scientific Information System in order to streamline the registration of new crop protection products.

Benefits

  • Provides a comprehensive approach to metabolite identification in complex matrices using UltraPerformance Liquid Chromatography (UPLC) and high resolution mass spectrometry in conjunction with the UNIFI Scientific Information System
  • Increased sample throughput resulting from UPLC chromatographic separations provide improved component resolution compared with high performance liquid chromatography (HPLC) separations.
  • Enhanced confidence in component structural assignments via simultaneous collection of accurate mass precursor and product ion data without the need for pre-selection of precursors.
  • Streamlines registration of new pesticide products by facilitating metabolite identification in complex matrices.

Introduction

Regulatory agencies such as the U.S. EPA require extensive documented and audited studies concerning the benefits and possible risks of using crop protection products before registration can occur.1 For example, manufacturers must provide evidence of the potential human health and environmental effects. One such example includes the metabolic fate of the active ingredient(s) (AI) of a new product and the effects that potential metabolites can have on the overall environmental or human toxicity. Therefore, the accurate measurement of metabolites is important to assess the risk of exposure and to provide thorough product risk assessment. 

Metabolite identification studies are commonly conducted by high resolution  mass spectrometry using precursor and product ion data because the results improve confidence in regulatory submissions.2 High resolution mass spectrometry techniques offer comprehensive information and intelligent software tools that can be extremely beneficial to the scientist by providing data interrogation. In some mass spectrometry technologies, a comprehensive precursor and product ion dataset is created by the use of “MSE”, which provides simultaneous acquisition of full scan precursor and product ion spectra from a single analytical injection without having to preselect precursors. This simplifies data acquisition because it does not require advanced knowledge of the analytes.3 Data is collected in an untargeted manner with a high degree of mass accuracy. Therefore, elemental compositions can be obtained for both intact molecular ions and all fragment ions. 

In this application note, atrazine (a commercially available herbicide that is well documented in the scientific literature) and its metabolites were spiked into soil extracts and used as a model to illustrate the workflow of Waters Metabolite Identification Application Solution with UNIFI. The ACQUITY UPLC I-Class System coupled to the Xevo G2-XS QTof Mass Spectrometer were used to analyze atrazine and its metabolites in spiked soil extracts. Atrazine (Figure 1) is a triazine herbicide that is widely used to control weeds in a variety of crops including  corn, sugar cane, and sorghum.4-8 Using the data evaluation tools available with UNIFI, structural relationships between atrazine and the metabolites were easily visualized.

Experimental

Sample preparation

10 g of soil was weighed into a 50 mL centrifuge tube. 5 mL of water and 10 mL of acetonitrile were added to the soil sample and the mixture was shaken for 20 min. After a salting out step and cleanup of the resulting acetonitrile layer, atrazine and its metabolites were spiked directly into the soil extracts in preparation for the analysis. 

LC conditions

UPLC system:

ACQUITY UPLC I-Class

Column:

ACQUITY UPLC HSS T3, 1.8 μm, 2.1 x 100 mm

Mobile phase (A):

Water with 10 mM ammonium formate

Mobile phase (B):

Acetonitrile

Flow rate:

0.6 mL/min

Column temp.:

45 °C

Injection volume:

1 μL

UPLC gradient:

0 min 1% B, 1 min 1% B, 5 min 80% B, 6 min 90% B, return to initial conditions

MS conditions

MS system:

Xevo G2-S QTof

Ionization mode:

ESI + MSE in resolution mode

Capillary voltage:

1.0 kV

Cone voltage:

20 V

Desolvation temp.:

400 °C

Source temp.:

120 °C

Cone gas:

50 L/hr

Desolvation gas:

900 L/hr

MSE low collision energy (CE):

2 eV

MSE high collision energy ramp:

17 to 45 eV

MS scan range:

50 to 950 m/z

Scan time:

0.15 s

Data processing

UNIFI Software was used for data acquisition and data processing.

Figure 1. Examples of N-dealkylation and 2-hydroxylation metabolism of atrazine.7

Results and Discussion

In this study atrazine was used as a model compound to demonstrate efficient metabolite identification using UPLC-MSE and the UNIFI Scientific Information System. From the literature, metabolic biotransformation of atrazine can occur via 2-hydroxylation and N-dealkylation pathways (Figure 1).9,10 Conjugation with a glutathione can also occur and has been reported in the literature. Hence, we investigated the known metabolic products as a starting point. 

UNIFI workflows and data review

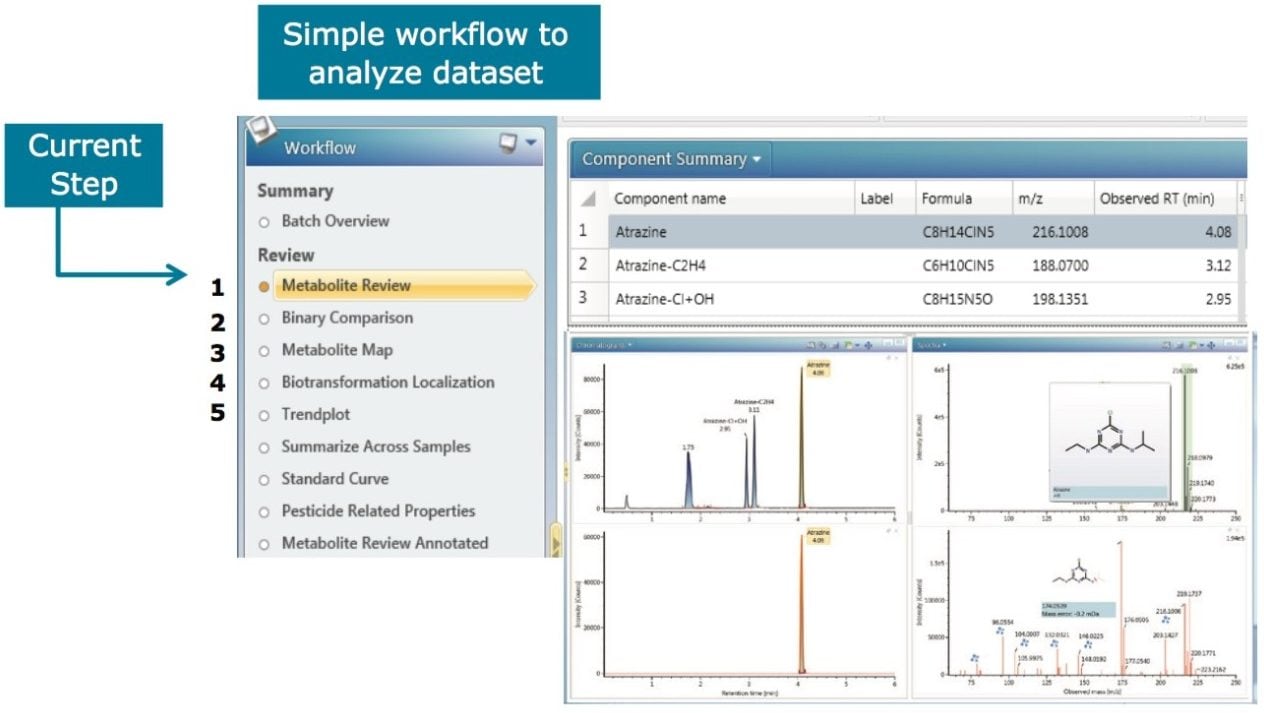
The UNIFI Scientific Information System is comprised of a series of workflow steps that are designed to enable thorough visualization of the entire dataset so that the information required to make a decision can easily be accessed with minimal user intervention. Users can define the process of how their data will be visualized with a single mouse click. This approach facilitates consistent, concise, and rapid review of an entire sample injection within an analysis. These steps are completely customizable and created to suit a particular analysis. 

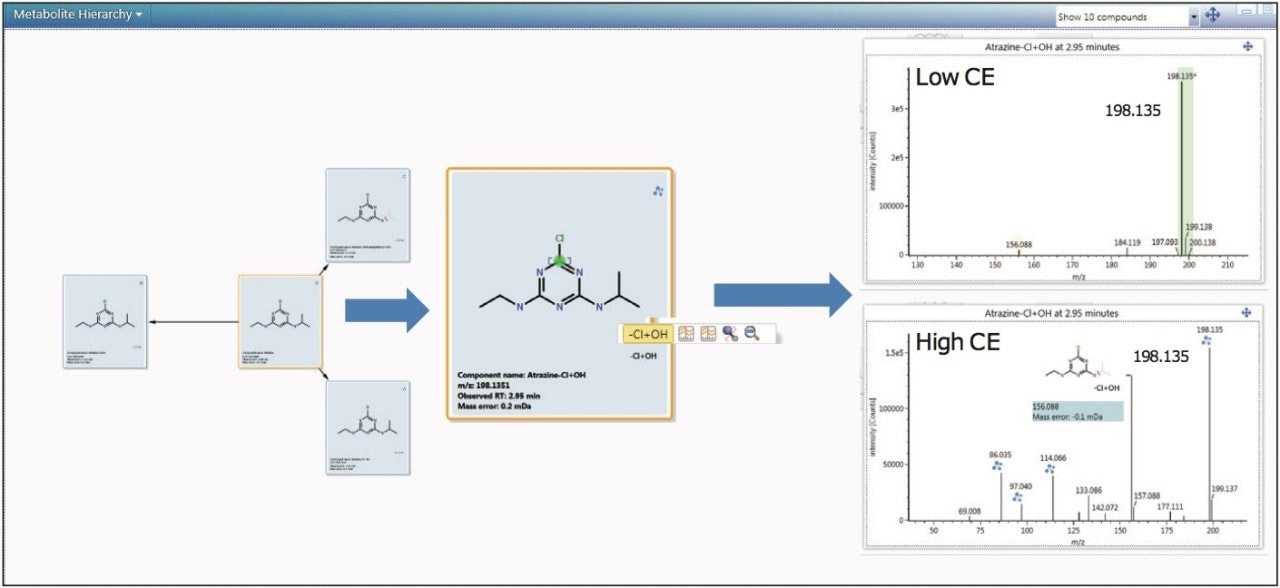
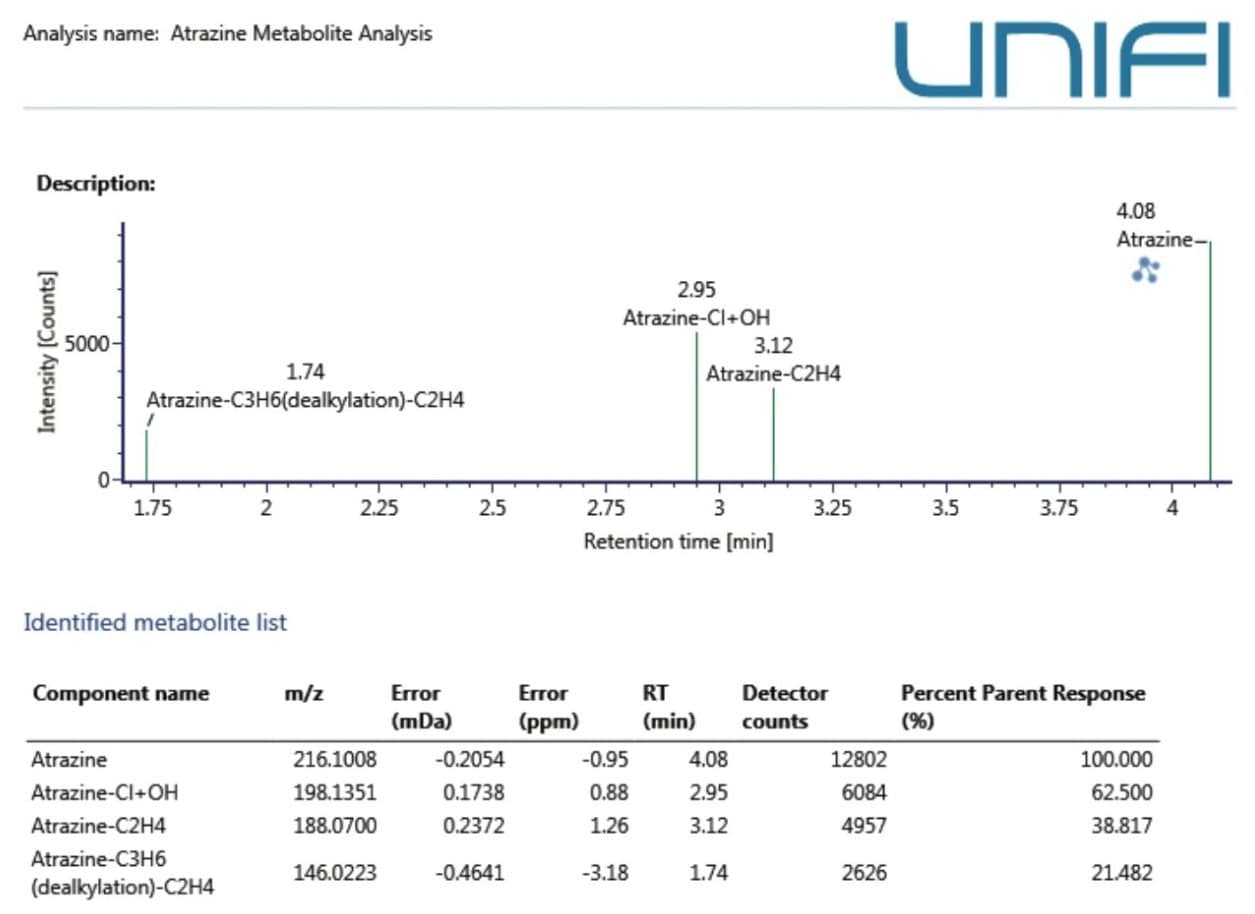
An example of a workflow designed for metabolite identification data review is shown in Figure 2.

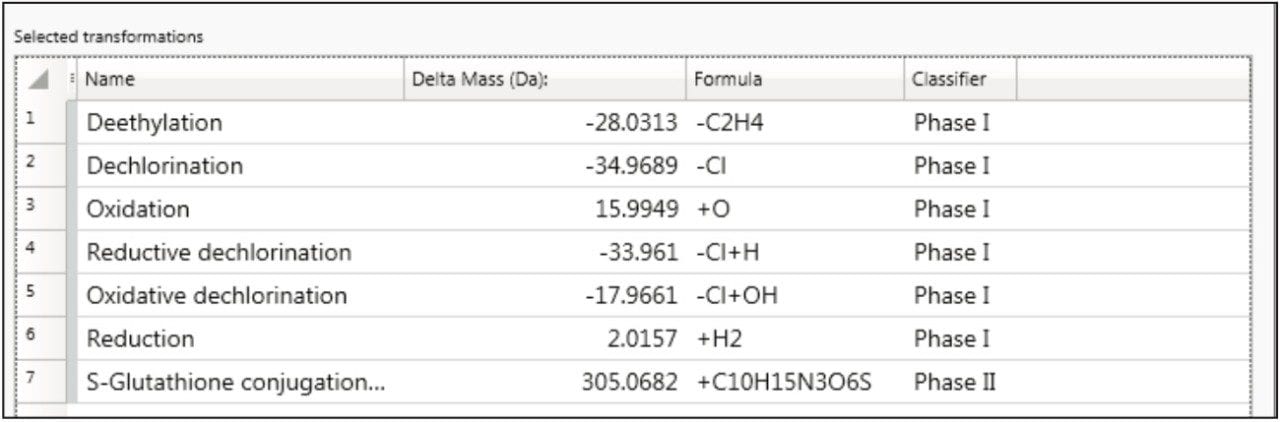
Metabolite identification within UNIFI requires a structure of the target molecule (mol file) that can be stored in the Scientific Library. A selection of possible transformations is also required (Figure 3).

Within the UNIFI Scientific Library there are over 100 transformations. The storage and editing of custom biotransformations is also supported. UNIFI’s Scientific Library is an integral part of the software package, which has is capable of not only storing structures, but also of retaining information associated with individual library entries. Parent compounds and metabolites of interest can also be stored in the library for later searching and retrieval. 

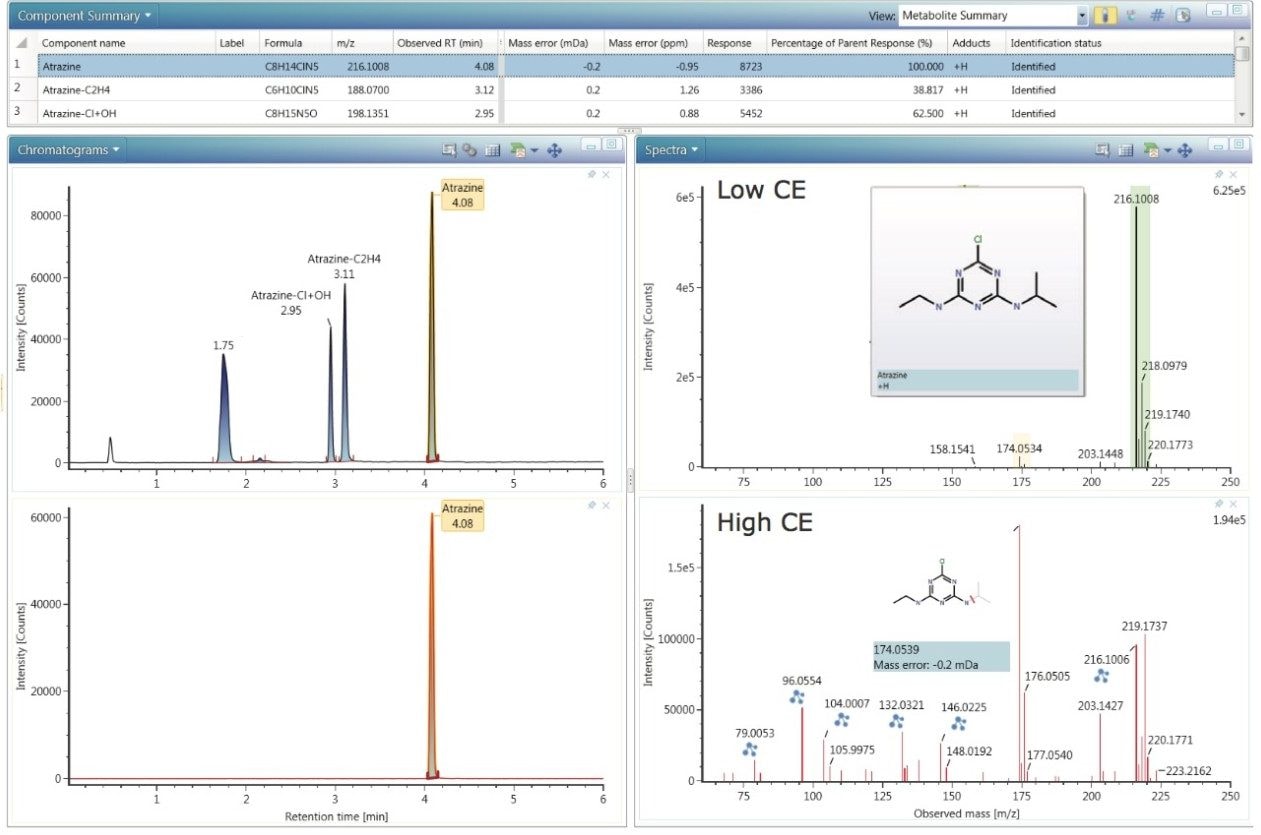
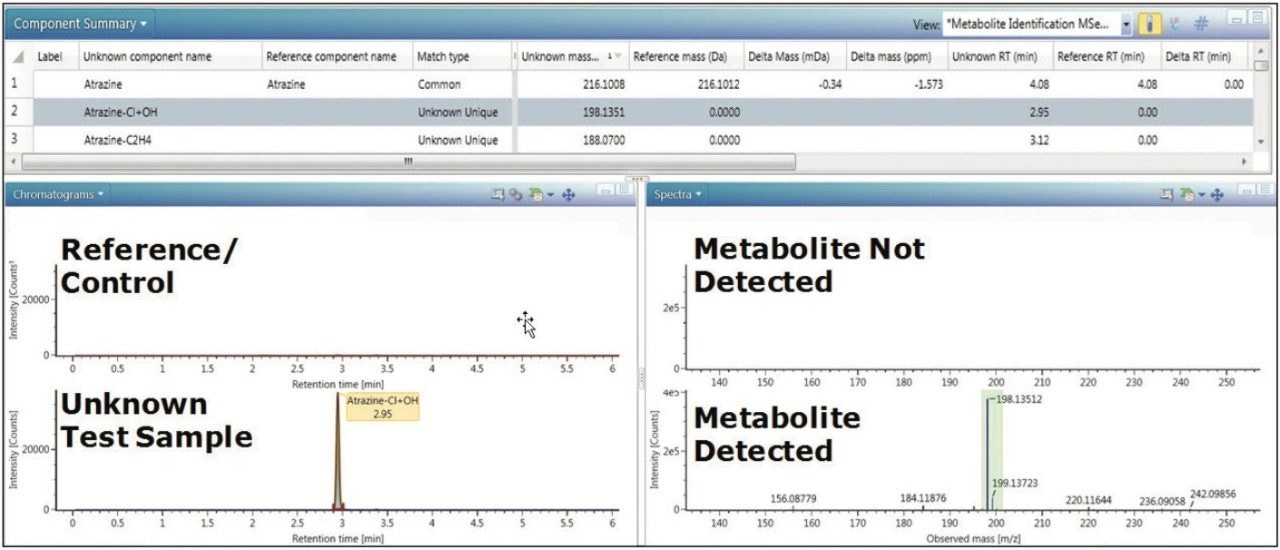
In the following sections a number of workflow steps from Figure 2 will be discussed using the atrazine metabolism data set.

Figure 2. An example workflow to support a metabolite identification experiment within UNIFI is shown. The selected Metabolite Review workflow step presents an overview of the identified metabolites in the Component Summary. The extracted ion chromatograms (XIC) of the identified metabolites and spectra are also shown. Selecting each step in the workflow will allow complete analysis of the dataset.
Figure 3. Transformations used to identify potential metabolites. 

1. Metabolite review

Using a single left-click, the information required to view the identified metabolites in an injection is invoked within the predefined display setup in the workflow step. Metabolite Identification Review (Figure 4) shows the Component Summary, Chromatogram, and Spectral windows. The Component Summary shows a list of the metabolites that have been identified by the software. The chromatogram at the top shows XIC’s of all of the identified metabolites, and the lower trace shows an XIC of the selected component; in this case, the parent pesticide atrazine. The spectra on the right side show both low and high collision energy (CE) MSE data, as well as the likely product ion structural assignments. Two metabolites are listed below atrazine. Upon selection of the metabolites, the chromatographic, spectral, and product ion structural assignments can be viewed.

Figure 4. The Metabolite Identification Review window shows the Component Summary table, chromatograms, MSE mass spectral data, as well as likely product ion structural assignments.

2. Binary Compare/control sample comparison

In this workflow step, a control/reference sample and an unknown sample can be automatically compared using the Binary Compare function. A metabolite with m/z 198.1351 at retention time (tR) 2.95 min was identified in the Component Summary as having undergone the structural modification -Cl+OH (Figure 5). This transformation indicates that the metabolite is likely to be atrazine-2-hydroxy. The metabolite is unique to the unknown test sample as can be seen by the absence of chromatographic peaks or spectra in the top traces. The spectra can be viewed as high or low CE data. In this case, the low CE spectrum is displayed.

3. Metabolite Hierarchy Map

The Metabolite Hierarchy Map provides an overall snapshot of the metabolism based on the identified metabolites. At the center of the map resides the parent pesticide, while the identified metabolites circle the parent. The entire metabolism can be seen and useful data can be accessed from a single location including MSE spectral data, mass fragment assignments for both the parent and all of the metabolites, and the Transformation Localization function (Figure 7).

Figure 5. UNIFI’s Binary Compare function shows the Component Summary, which lists the metabolites that  are common or unique to the reference and unknown samples. An XIC of m/z 198.1351 produced a signal in the test sample but not in the reference. In this case, Atrazine-2-hydroxy is unique to the test sample. 
Figure 6. The Metabolite Hierarchy view allows a comprehensive overview of the entire dataset;  spectral and structural data can be readily compared in a single place. 
Figure 7. Integrated transformation localization performed automatically. Atrazine-2-hydroxy fragment ion spectrum (top) shown with the inverted spectrum  of the parent pesticide atrazine (bottom). 

4. Transformation Localization

Transformation localisation is automatically performed and gives an idea of where the position of metabolic transformation has likely occurred. An interactive interface allows for easy data review (Figure 7). The most likely location of the biotransformation within the structure is highlighted in green which indicates that there is a high probability of the transformation occurring at this site. The high energy MSE spectrum of the metabolite on the top is compared with that of the parent pesticide in the lower spectral trace. The differences between them are highlighted and there are color-coded assignments made to the spectral peaks where UNIFI has identified relationships. In this example several mass shifts can be seen, indicated by the dark blue color that links the spectral peaks in the metabolite spectrum with those of the parent pesticide. In this case the mass shifts are due to the structural change –Cl+OH.

5. TrendPlot

With the UNIFI metabolite identification workflow each identified component in the sample can be confidently interrogated. The behavior of the metabolites relative to the parent pesticide can be observed using the TrendPlot function within UNIFI (Figure 8). To illustrate the utility of TrendPlot, a biotransformation kinetics study of atrazine was designed using samples spiked at different concentrations and at various time points. The plots depict how the fate of the primary metabolites, which appear as the parent is metabolized over time, can be monitored in the samples  using the software capabilities within UNIFI. 

For every point in the trend plots there is chromatographic, spectral,  and structural information recorded within UNIFI. This data can be displayed in a table or as a plot view. The data shown in Figure 8  is represented as bar charts and superimposed line graphs. 

The Elucidation toolset

Once the identified metabolites have been reviewed using the workflow steps, we can then investigate the data using  the Elucidation toolset. Metabolites can be interrogated more intensively using the Elucidation toolset in UNIFI, which is comprised of a comprehensive suite of structural elucidation  tools including ChemSpider Search from the Royal Society of Chemistry (www.chemspider.com), isotope modeling, and elemental composition tools. Discovery tools are also available for searching data for related ions using mass defect, common fragment, and neutral losses. 

The MSE data is a collected in a non-targeted way requiring no prior knowledge of the analytes. The fragment ion data can be used to search for structurally related components  present in the sample. 

Figure 8. The TrendPlot function within UNIFI shows the graphical representation of a kinetics study made from spiked samples using atrazine and two of its metabolites: atrazine-2-hydroxy and desethyl atrazine. The graphical results shown are intended to demonstrate the results of a kinetics study.

Investigation of the metabolite identified as atrazine-C2H4 or desethyl atrazine, using transformation localization indicated that some product ions were preserved in the metabolite (data not shown). A fragment ion with m/z 79.005 was common to both the parent pesticide and desethyl atrazine. 

Using UNIFI’s Common Fragment Search function, components that share common structural features can be efficiently extracted from the data (Figure 9). The fragment m/z 79.005 was present in the product ion spectra of atrazine (Peak 3), desethyl atrazine (Peak 2), and a third component at retention time (tR) 1.74 min (Peak 1). This component has been identified as having undergone two dealkylations, C3H6 plus C2H4 (desethyl-desisopropyl atrazine). The existence of the high energy fragment ion data along with the intact precursor provides information that allows structural relationships between the metabolites to be established in a single analytical injection.

Once the metabolites have been identified, they can be labeled and sent to the UNIFI Scientific Library where information about the tR, accurate mass fragment ions, spectra, etc. can be stored for future analyses.

UNIFI reporting

Following data analysis, the organization of the data into a clear and fully customizable report is possible within UNIFI. All of the information accessed in the data review can be exported into the report including figures, graphs, tables, plots, and structural information, as shown in Figure 10. UNIFI can generate multiple reports per analysis that can each be customized to incorporate as little or as much detail as required for internal or external reports.

Figure 9. The UNIFI Common Fragment search is used to efficiently search the soil sample for components that have a fragment ion with m/z 79.0057 in the high CE data. Fragmentation spectra for each component (1–3) are also shown.
Figure 10. A summary of the atrazine metabolites found in the sample is presented in a fully customizable UNIFI report. 

Conclusion

Identification of atrazine and its metabolites in spiked soil samples was successfully completed using the Metabolite Identification Application Solution with UNIFI. The use of customizable workflow steps allows data analysis to be performed more easily and efficiently with minimum user intervention. The relationships between atrazine and the metabolites were easily visualized using the data evaluation tools present within UNIFI. The workflow presented here for atrazine and its metabolites can also be applied to similar pesticide metabolite identification studies to greatly facilitate the new product registration process. The samples used in this study were formulated to test the overall analytical approach, software, and hardware, in a proof of principle analysis. 

References

  1. U.S. EPA Pesticide Registration. http://www2.epa.gov/ pesticide-registration/about-pesticide-registration. [Cited February 24, 2015].
  2. PR Tiller, S Yu, J Castro-Perez, KL Fillgrove, TA Baillie. High-throughput, accurate mass liquid chromatography/ tandem mass spectrometry on a quadrupole time-of-flight system as a “first-line” approach for metabolite identification studies. Rapid Commun Mass Spectrom. 22: 1053–1061; 2008.
  3. An overview of the principles of MS,E The engine that drives MS performance. Waters White Paper No. 720004036en. October, 2011.
  4. Z Vryzas, EN Papadakis, K Oriakli, TP Moysiadis, E Papadopoulou-Mourkidou. Biotransformation of atrazine and metolachlor within soil profile and changes in microbial communities. Chemosphere. 89: 1330–1338; 2012.
  5. ER Laws, WJ Hayes. Handbook of Pesticide Toxicology. Academic Press, San Diego, CA; 1991.
  6. CDS Tomlin. The Pesticide Manual. British Crop Protection Council, Farnham, UK; 1997.
  7. RH Shimabukuro. Atrazine metabolism in resistant corn and sorghum. Plant Physiol. 43: 1925–1930; 1968.
  8. C Cox. Atrazine: Environmental Contamination and Ecological Effects. J Pesticide Reform. 21; 3: 12–20; 2001.
  9. M Cherifi, M Raveton, A Picciocchi, P Ravanel P M Tissut. Atrazine metabolism in corn seedlings. Plant Physiol Biochem. 39: 665–672; 2001.
  10. RH Shimabukuro, HR Swanson, WC Walsch. Atrazine detoxication mechanism in corn. Plant Physiol. 46: 103–107; 1970.

720005357, April 2015

Volver arriba Volver arriba