This application note presents an automated bioanalytical approach using exact mass in combination with an automated software package, MetaboLynx, for in vitro metabolite screening.
In metabolism studies, it is vital to understand how a particular drug is absorbed, distributed, metabolised, and eliminated by the body. Metabolite identification is a very important part of the drug discovery/development process, because early detection and identification of major and toxic metabolic routes can help to fine-tune drugs that go on to development. Metabolism is not an easy task and it can be extremely complex; that is why speed and accuracy of results are vital in order to make the right decisions at this stage.
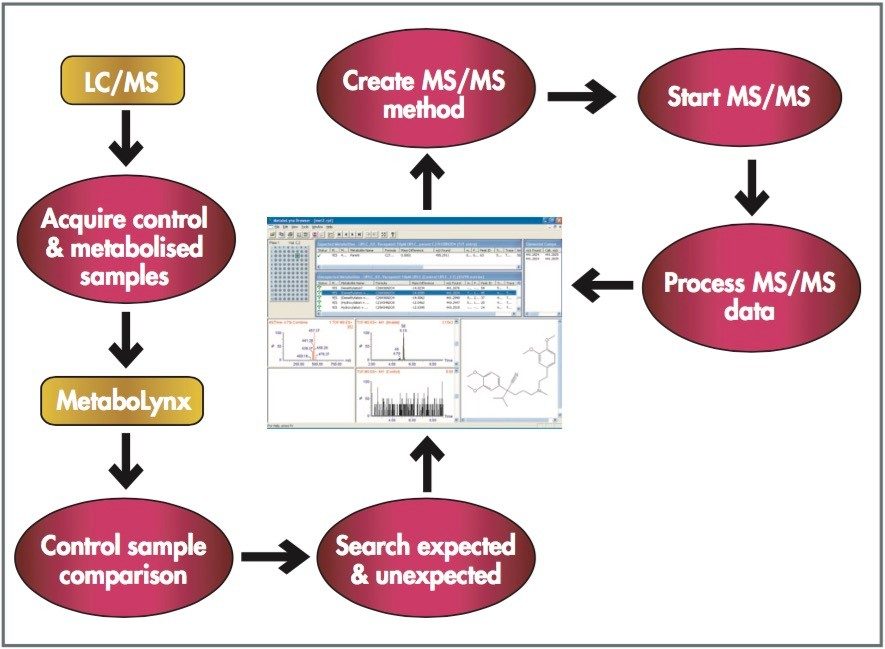
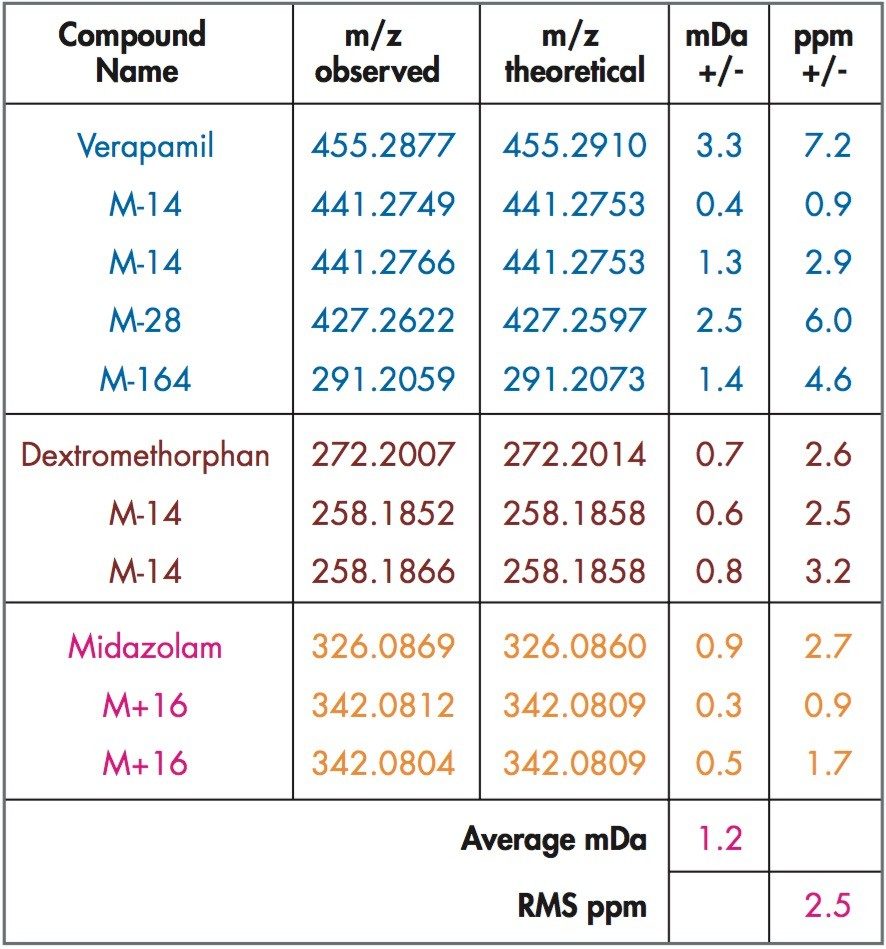
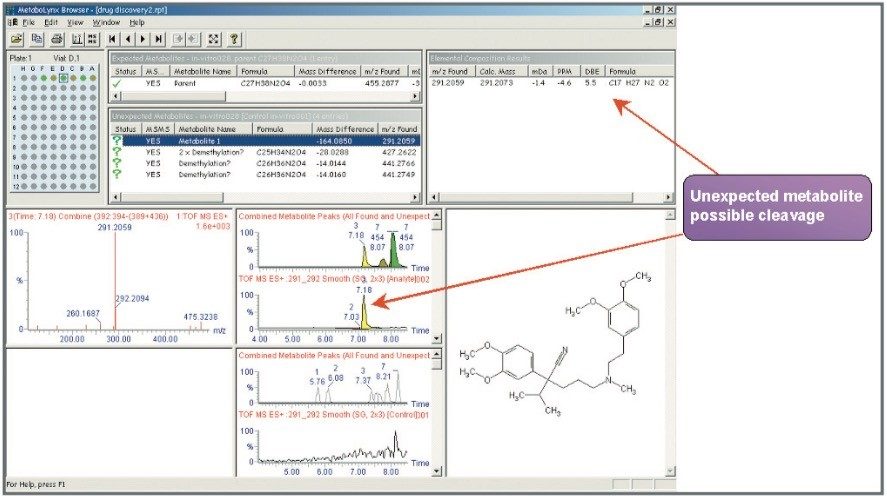
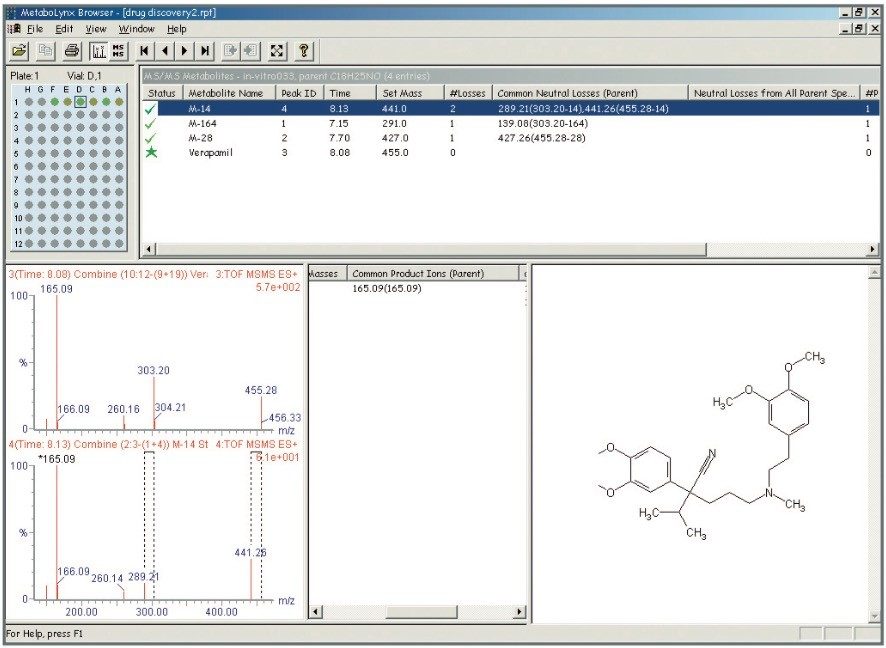
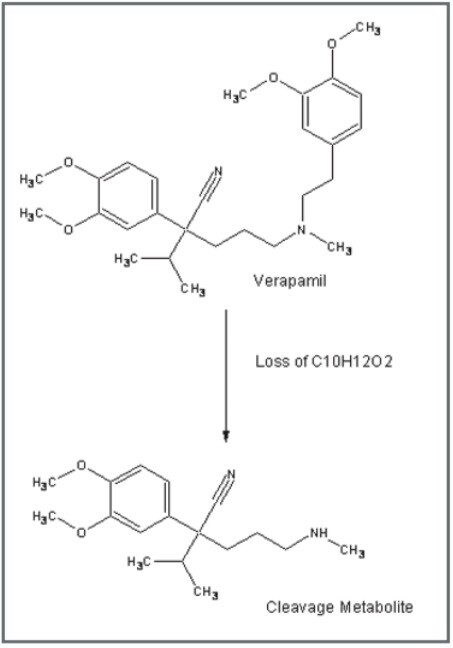
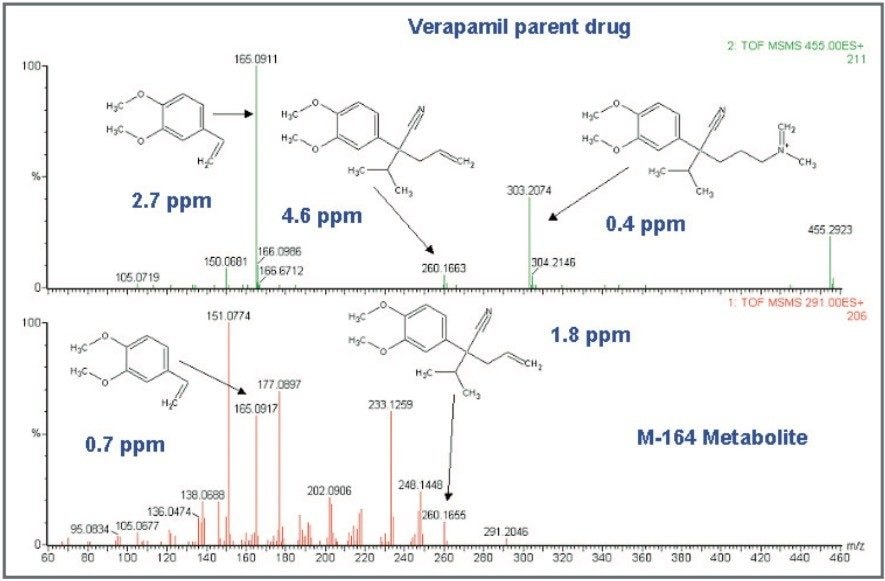
Mass spectrometry is a well established technique for pharmacokinetic and metabolism studies, due to the fact that it is sensitive, fast, and robust. Exact mass measurement technologies, such as quadrupole time of flight (Q-Tof) MS, offer accurate data and high sensitivity, which are very important for metabolite identification. Use of exact mass data in the determination of metabolite structures allows medicinal chemists to make the necessary “structural tuning” to achieve the desired compound biological activity. Moreover, as the demand to screen a large number of compounds in drug discovery increases, bottlenecks in data processing can often result. Therefore, there is a need to develop an automated approach that can cope with the number of candidates analysed in the drug discovery process. In this paper, we present an automated bioanalytical approach using exact mass in combination with an automated software package, MetaboLynx, for in vitro metabolite screening (Figure 1). A range of different compound incubates in microsomes at 5 μM will be shown. We will show that the MetaboLynx Software algorithm enables the identification of expected and unexpected metabolites from a control sample comparison. Moreover, we will also show how we can automate the entire process of metabolite detection and MS/MS method creation for subsequent sample analysis for identification purposes. Finally, we will show how enhanced mass measurement accuracy in the assay results may increase sample throughput and improve decision-making steps. This is especially applicable in the discovery phase, where some “compound structural tuning” may be required to achieve the pharmacokinetic and metabolism effects required for a specific novel structure.
Mass spectrometer: |
Waters Micromass Q-Tof micro |
Ionisation mode: |
ESI +ve ion |
Capillary voltage: |
3.2kV |
Cone voltage: |
35V |
Source temperature: |
120 °C |
Desolvation temperature: |
280 °C |
Acquisition mass range: |
50–800 amu |
Lock mass: |
Leucine Enkephalin m/z 556.2771 |
Solvent delivery system: |
Waters Alliance 2795 |
Column: |
Waters Atlantis dC18 150 x 2.1 mm id, 3.5 μm |
Flow rate: |
300 μL/min |
Mobile phase A: |
Water + 0.1% Formic acid |
Mobile phase B: |
Acetonitrile + 0.1% Formic acid |
Injection volume: |
10 μL |
Time(min) |
A% |
B% |
Flow(μL/min) |
---|---|---|---|
0.00 |
90.0 |
10.0 |
0.3 |
1.50 |
90.0 |
10.0 |
0.3 |
10.00 |
15.0 |
85.0 |
0.3 |
10.50 |
90.0 |
10.0 |
0.3 |
13.00 |
90.0 |
10.0 |
0.3 |
Rat liver microsomes with a protein content of 0.5 mg/mL were used to incubate verapamil, midazolam, and dextromethorphan at 5 μM level. The reaction was stopped by adding one part of ice-cold acetonitrile with two parts of sample after a 60 minute incubation. Then, the sample was centrifuged at 15,000 rpm and the supernatant was collected for subsequent LC-MS/MS analysis.
Mass measurement accuracy levels of 2.5 ppm RMS were obtained for all incubated compounds and putative metabolites (Table 1). All major expected and unexpected metabolites for the compounds incubated were identified by the use of an automated processing algorithm, MetaboLynx (Figure 2). Subsequent MS/MS acquisitions were performed after detection of xenobiotics for structural identification (Figure 3).
Furthermore, there was an interesting finding for verapamil. After processing the data with MetaboLynx, an unexpected metabolite with m/z 291.2059 was detected by the control sample comparison algorithm (Figure 2). Under further examination on the browser, there was not a chromatogram present in the control sample with this mass. Exact mass measurements of 4.6 ppm revealed that it was a metabolite corresponding to the loss of C10H12O2 from verapamil. Therefore, a postulated structure was proposed (Figure 4). Next, both verapamil and the putative metabolite at m/z 291.2059 were analysed by LC-MS/MS. Excellent MS/MS data with exact mass was obtained which helped to confirm the metabolite and elucidate its structure by comparing several common fragments on both parent drug and metabolite (Figure 5).
This strategy allowed an automated fast turnaround of samples, not only in the analysis time but also in the identification process, which can be the real bottleneck. Specifically, it allowed us to search for unexpected metabolites using the control comparison MetaboLynx algorithm with exact mass, making the whole process more accurate.
Exact mass in MS and MS/MS experiments together with Double Bond Equivalences is a major advantage in the identification process because it provides confidence in the results obtained and enables us to eliminate false positives.
720000999, October 2004