Expediting Method Development for Oligonucleotide Impurity Analysis Using the ACQUITY™ QDa™ II Mass Detector
Xiangsha Du, Robert E. Birdsall, Karen Nyholm
Waters Corporation, United States
Published on May 02, 2025
Abstract
Therapeutic oligonucleotides such as antisense oligos, siRNAs, aptamers, and mRNA, continue to grow in clinical relevance, creating a need for highly sensitive and reliable analytical tools for impurity profiling. During the synthetic manufacturing process, incomplete coupling can occur, resulting in truncated species or shortmers. Although traditional LC-UV workflows are commonly used for routine analysis, they often fall short in delivering the mass specificity required to confidently identify closely eluting impurities, such as n-1, n-2, or other sequence variants.
In this study, it is demonstrated how users can effectively separate shortmer impurities from the parent full length product during a ion-pairing concentration and gradient delivery using the ACQUITY™ Premier™ QSM LC System. To streamline method development, the Waters ACQUITY QDa II Mass Detector, a compact mass detector, was utilized to confirm impurity identity in mass profiling, for more confidence in assessing oligonucleotide quality.
Benefits
- Quaternary solvent blending speeds up oligonucleotide method development by enabling seamless, real-time optimization of ion-pairing conditions, with no downtime
- The ACQUITY QDa II Mass Detector provides identification by mass as well as quantitation of impurities associated with oligonucleotides, a critical step when UV detection alone is insufficient
Introduction
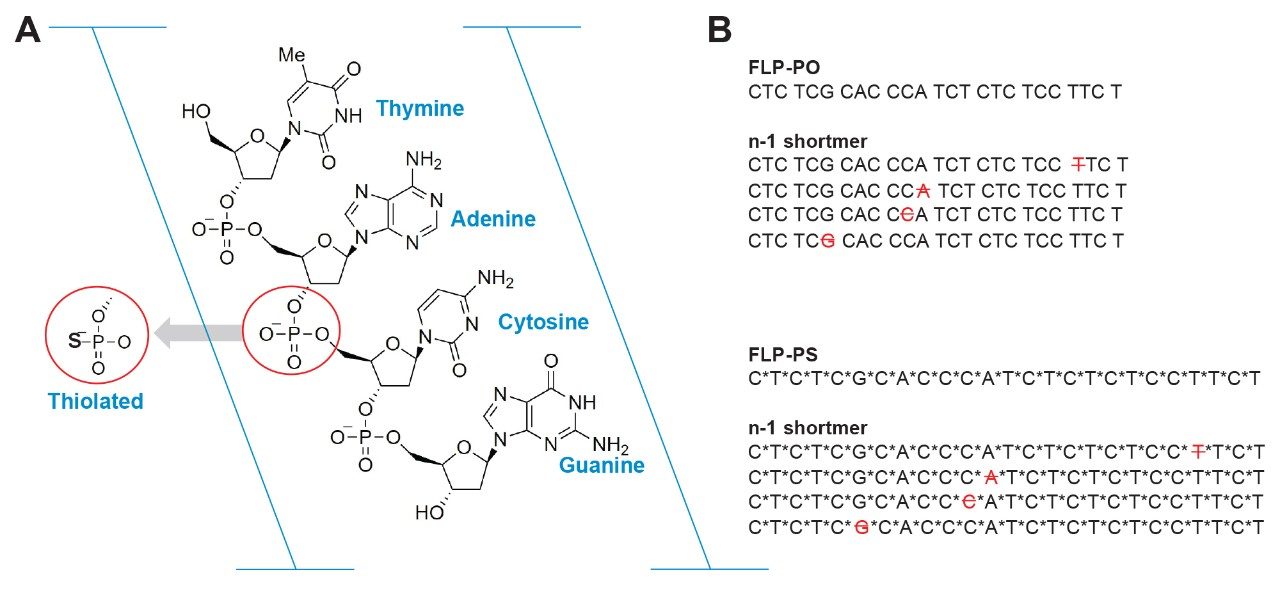
The primary structures of oligonucleotides consist of a chain of nucleotide bases - adenine (A), thymine (T), cytosine (C), guanine (G), or uracil (U), connected by a sugar and phosphate diester backbone (Figure 1A). As with other biopharmaceutical drug products, it is essential to monitor product/process related impurities to support patient safety and therapeutic efficacy. Although the synthesis process is well controlled, impurities such as shortmers (n-x) and longmers (n+x) commonly occur in oligonucleotide therapeutics due to incomplete protection/deprotection or polishing steps during the synthesis process.1 Furthermore, chemical modifications such as phosphorothioate (PS) substitution, which replaces an oxygen with a sulfur on the phosphate group to improve delivery and resistance to nuclease degradation – can increase the complexity of the impurity profile by introducing diastereomers and additional synthesis impurities.
Ion-pairing reversed-phase liquid chromatography (IP-RPLC) is the most widely used technique for oligonucleotide separation.3 It leverages alkyl-amines to form ion pairs with the negatively charged phosphate backbone, allowing resolution based on oligo length. However, n-1 and n+1 variants, differing by a single nucleotide from the full-length product (FLP), are particularly challenging to resolve and detect via UV alone, due to their similar physicochemical properties and potential co-elution. While LC-UV detection is a mainstay in quality control (QC) for its robustness and sensitivity, developing effective separation methods can be time-consuming requiring iterative optimization of ion-pairing agents, mobile phase composition, and gradient conditions.
To help accelerate this process, the Waters ACQUITY Premier LC System with quaternary solvent blending capability enables rapid method optimization. When paired with the ACQUITY QDa II Mass Detector, analysts can integrate an inline, compact MS solution for deeper insights. Analysts can gain orthogonal mass-based insights to complement UV detection, streamlining impurity identification and method development.4,5
This study demonstrates how this LC-UV/MS setup enables faster, more confident optimization for oligonucleotide impurity analysis. Two representative full-length products, FLP-PO (phosphodiester) and FLP-PS (phosphorothioate) (Figure 1B), were used to showcase the platform’s capabilities.
Experimental
LC-MS grade water, methanol and acetonitrile solvents were purchased from Honeywell®. Dibutylamine (DBA) and triethylamine (TEA) were purchased from Sigma-Aldrich®. 1,1,1,3,3,3-Hexafluoro-2-propanol (HFIP) was purchased from Honeywell-Fluka®.
FLP-PO and FLP-PS and their relative (n-1) shortmer samples, were purchased from integrated DNA Technologies® (IDT). FLP-PO and FLP-PS were prepared at a concentration of 0.1 mg/mL in water. (n-1) shortmer was spiked in at 10%.
LC System Conditions
|
LC system: |
ACQUITY Premier System (QSM variant) |
|
Detection: |
TUV, Ti FC, λ=260 nm, 5 mm flow cell |
|
Column: |
ACQUITY™ Premier™ Oligonucleotide BEH™ C18 Column, 130 Å, 2.5 µm, 4.6 x 150 mm (p/n: 186009903) |
|
Column temperature: |
70 °C |
|
Sample temperature: |
10 °C |
|
Injection volume: |
5 µL |
|
Flow rate: |
0.200 mL/min |
|
Mobile phase: |
A: water B: methanol/acetonitrile = 50/50 C: 20 mM DBA/150 mM HFIP (pH 8.5) or 40 mM TEA/300 mM HFIP (pH 8.5) |
|
Chromatography software: |
Empower™ 3.8.1 |
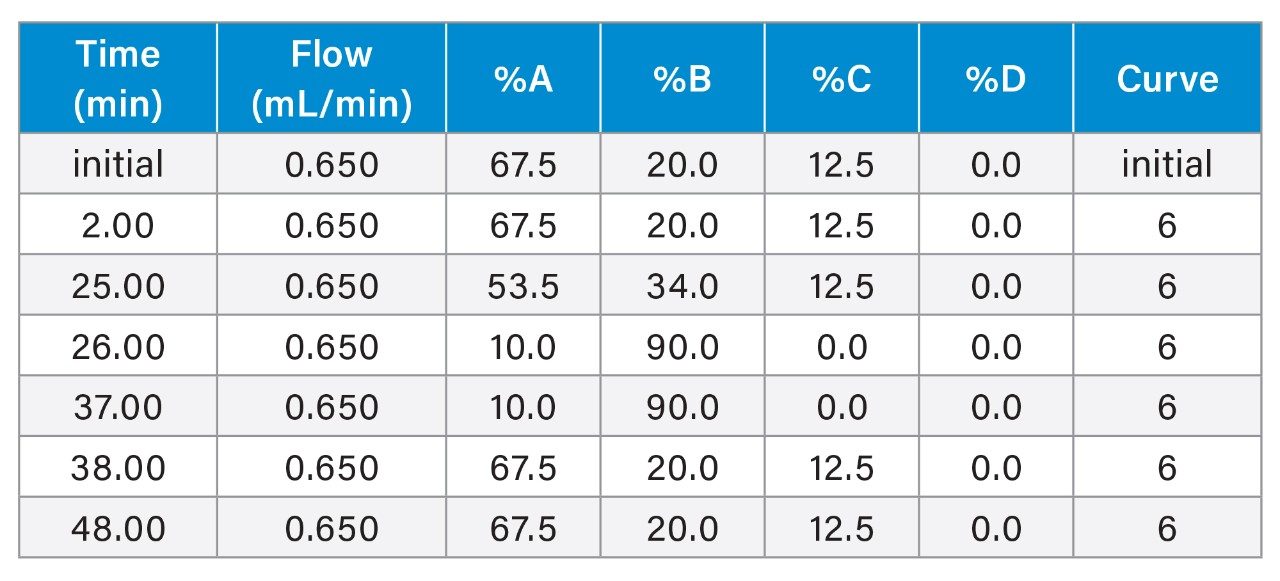
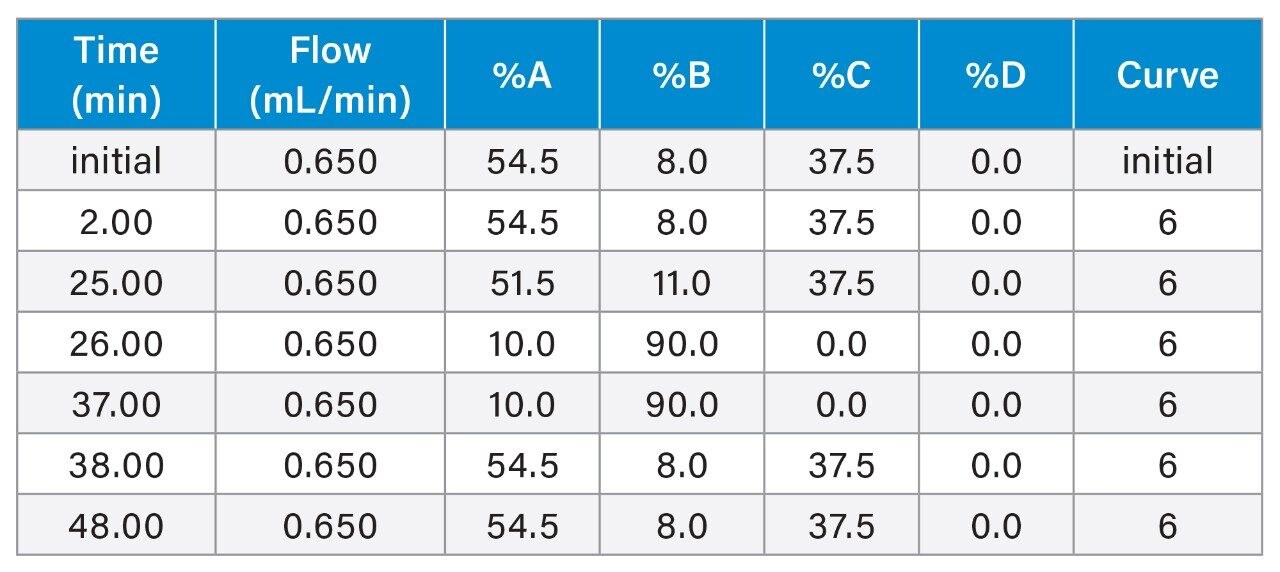
Gradient Table
PO backbone
PS backbone
MS Detector Settings
|
MS detector: |
ACQUITY QDa II Mass Detector |
|
Scan mode: |
Negative Electrospray (ES-) |
|
Data collection mode: |
Continuum |
|
Scan rate: |
5 Hz |
|
Scan range: |
350–1500 m/z |
|
Probe temperature: |
600 °C |
|
Capillary voltage: |
1.5 kV |
|
Cone voltage: |
20 V |
Selected Ion Recording (SIR)
Results and Discussion
LC-UV/MS methods are frequently used for comprehensive oligonucleotide analysis, however method optimization can be time-consuming and labor-intensive because both the chromatography and MS require optimization with ion-pairing selection and gradient to facilitate adequate separation of impurities while maintaining good MS-response for identification. In this study, method development was streamlined by integrating LC-UV/MS workflow using a quaternary pump system configuration and a compact mass detector.
Optimization for Phosphodiester Oligonucleotides (FLP-PO)
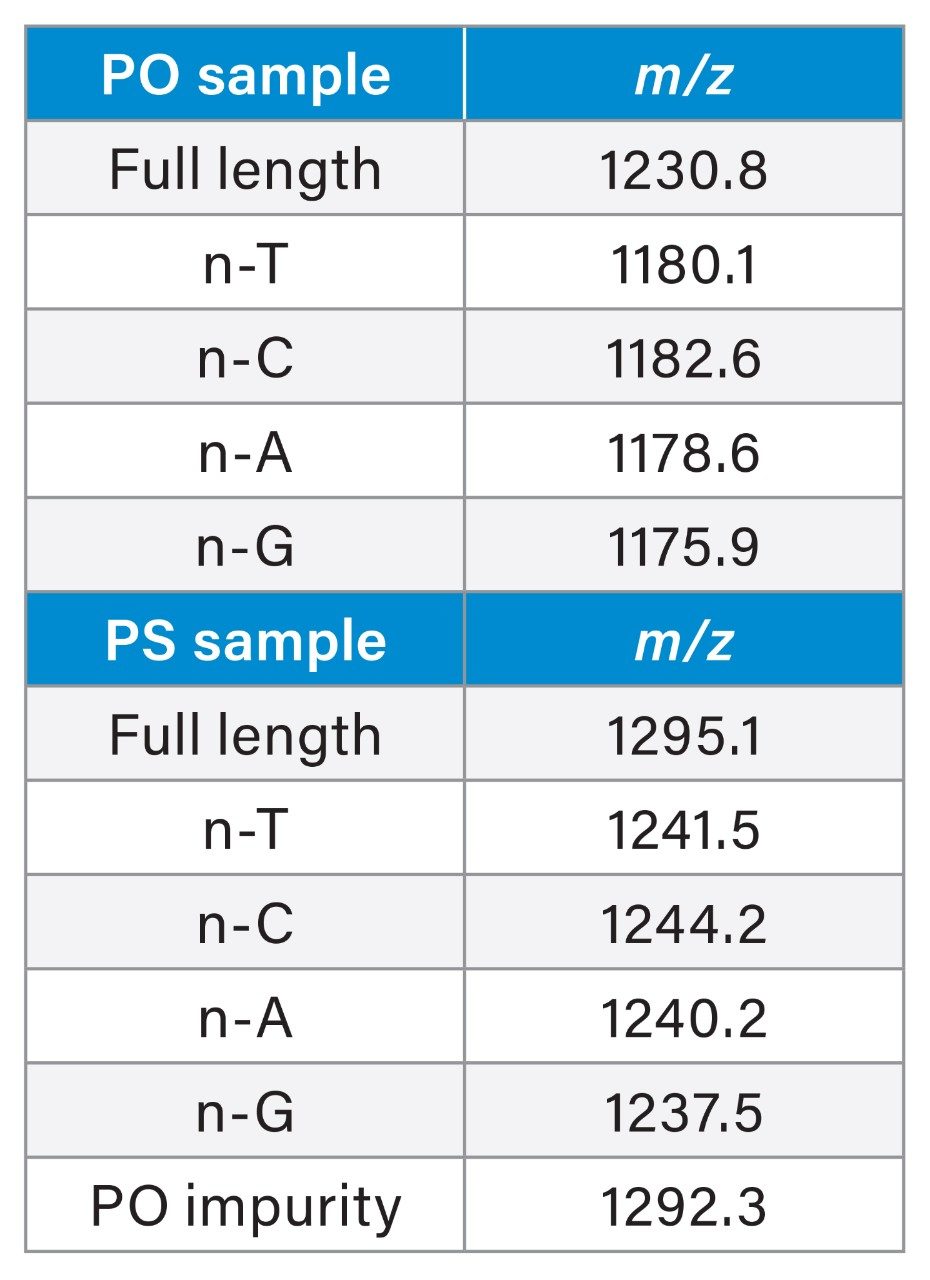
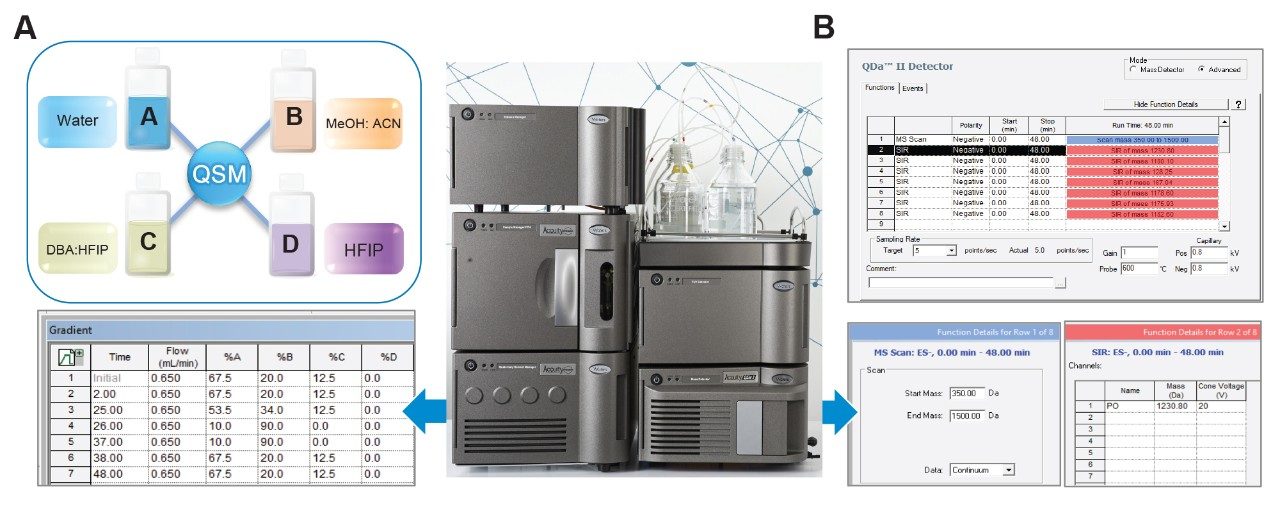
As shown in Figure 3, the Empower 3 Software consolidates instrument control for all modules within the instrument method settings. Users have access to all four mobile phase reservoirs of the ACQUITY Premier QSM System allowing for quaternary solvent blending for enhanced flexibility and efficiency in method optimization. To demonstrate the utility of quaternary solvent blending, water and organic solvents (ACN/MeOH = 50/50) were configured in mobile phases A and B. A concentrated ion-pairing stock solution of 20 mM DBA: 150 mM HFIP (pH 8.5) was prepared as mobile phase C. Mass detection was performed using the ACQUITY QDa II Mass Detector (Figure 3B), which offers a full scan channel for analytes up to 1500 m/z. Additionally, it can monitor associated impurity ions using SIR for increased specificity and sensitivity. In this study, users can understand how the lower charge state [M-6H]-6 m/z ions were selected for monitoring the corresponding FLP and n-1 impurities to minimize ion overlap for increased accuracy.
Impact of Ion-Pairing Concentration
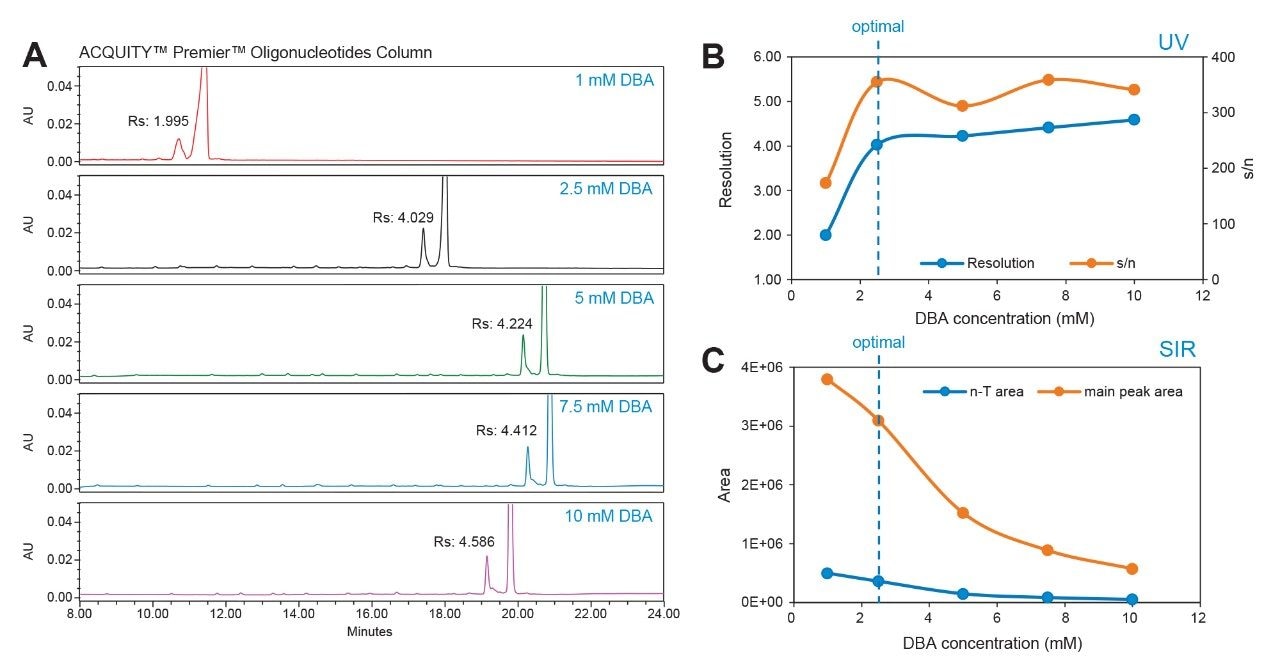
A mixture of FLP-PO oligonucleotides with shortmer (n-T) was spiked at 10% for optimization of detector response and separation efficiency. A consistent 20-34% organic gradient was used to evaluate DBA concentrations using a single mobile phase preparation by altering the composition percent (%) of reservoir line C. As shown in Figure 3 where line C at 12.5% represents 2.5 mM of ion-pairing in the mobile phase. Using this approach to screen IP concentration, as illustrated in Figure 4A, DBA concentrations between 1 mM and 10 mM achieved baseline resolution with a USP resolution greater than 1.5. Resolution was observed to increase with elevated DBA concentrations (Figure 4B), however, the ion pairing reagent impacted the ionization efficiency of oligonucleotides, leading to significant suppression of the MS signal as shown in DBA concentrations at 5 mM and above (Figure 4C). Therefore, a concentration of 2.5 mM DBA emerged as the optimal balance - showing sufficient resolution while minimizing MS signal suppression.
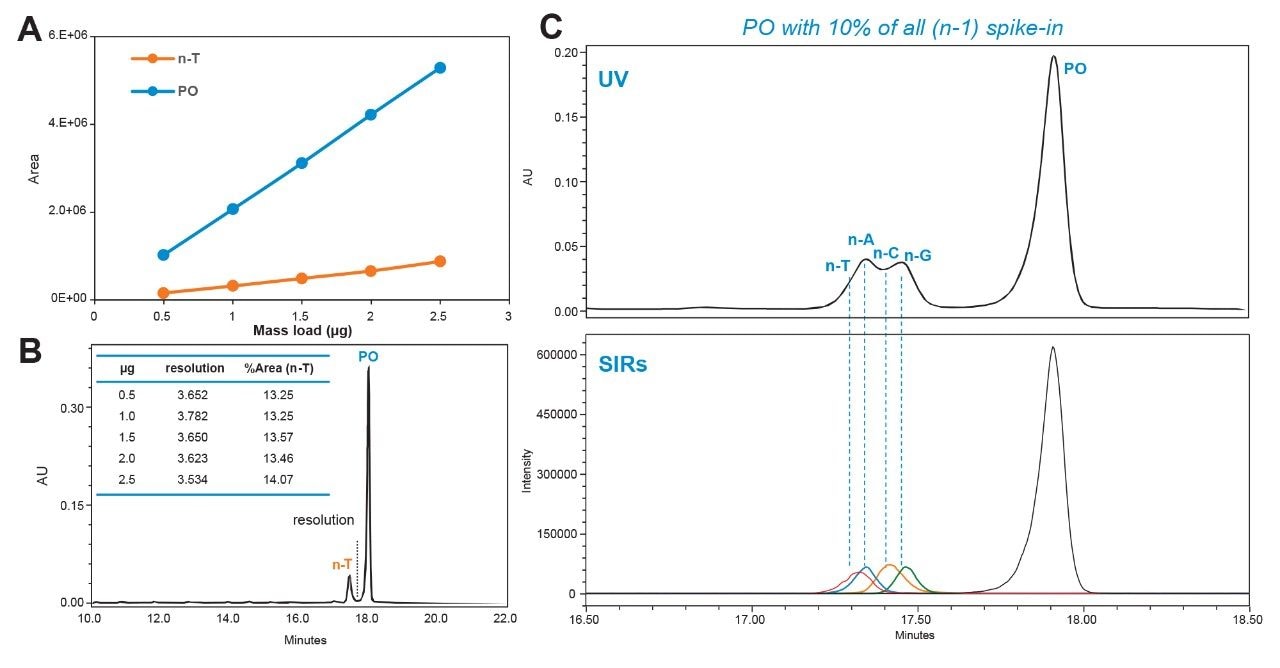
For quality control and regulatory compliance, it is crucial to assess the robustness of the optimized method. In this instance, mass load impact on peak resolution was evaluated for the optimized method. As shown in Figure 5A and 5B, the method scaled linearly and was able to maintain the desired peak resolution with increasing mass load. This demonstrates that the optimized method is reliable and can be consistently reproduced across development and manufacturing processes, ensuring best practices. For thorough identification of shortmer impurities, the optimized method was verified using a combination of FLP-PO oligonucleotides spiked with all possible n-1 sequences, including n-A, n-C, n-G, and n-T. As shown in Figure 5C, the ACQUITY QDa II Mass Detector, which is configured in-line, enables quick confirmation that the individual n-1 species are completely resolved from the FLP.
Impurity Profiling of FLP-PO with LC-UV/MS
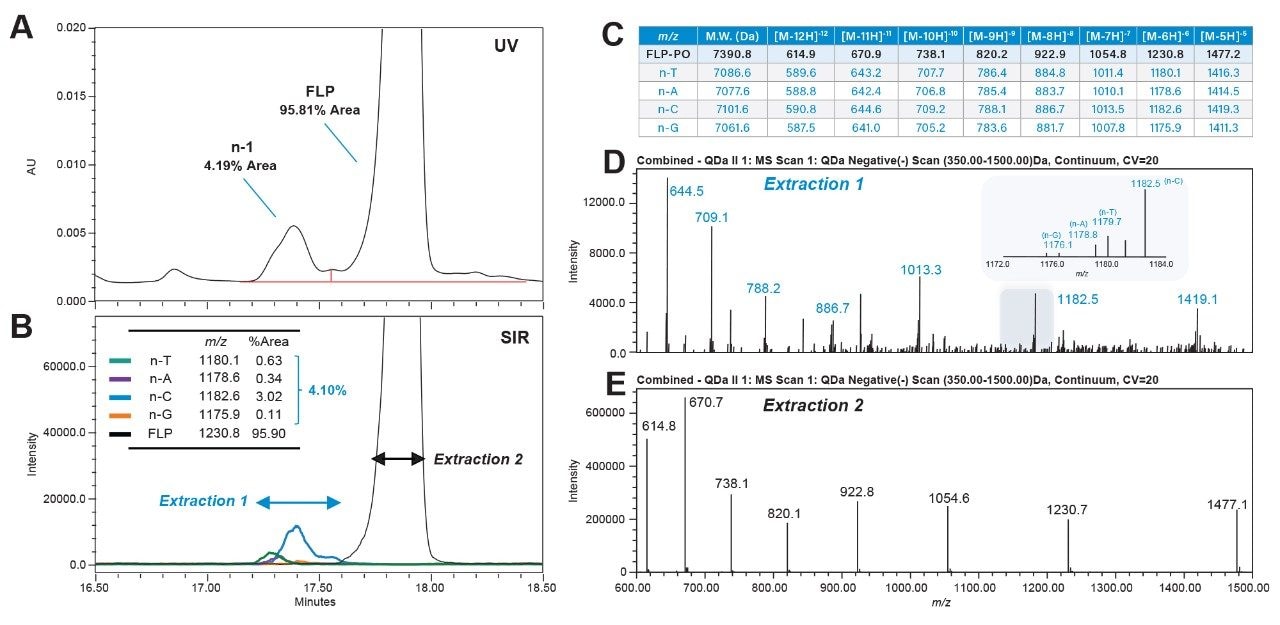
After confirming the method's accuracy using spike-in standards, the optimized method was applied to the full-length product (FLP) to analyze intrinsic impurities. The non-spike-in FLP-PO profile was analyzed using 2.5 mM DBA (Figure 6). The SIR peaks of each n-1 impurity were integrated, yielding an overall area percentage of 4.10%, consistent with the 4.19% impurity peak integrated from the UV spectrum (Figure 6A, B). The consistency between SIRs and UV spectra highlights the transferability of this robust, optimized method to routine QC environment analysis.
In addition to SIR monitoring, a full scan of the analyte was acquired from 350 to 1500 m/z. Extraction of total ion chromatography (TIC) and the comparison of the charge table in Figure 6C to the extracted spectrum shown in Figure 6D, indicates that the impurity peak that elutes prior to the FLP is predominantly comprised of the n-C shortmer. As shown in the inset of Figure 6D, n-T, n-A, and n-G are also shown with relatively low abundance based on detected ion series for the [M-6H]-6 charge state. Similarly, as seen in Figure 6E, the combined spectra for the FLP (Extraction 2, Figure 6B) matches with the expected ions based on the calculated ion series for the FLP-PO as shown in the table data. In this example, the ACQUITY QDa II Mass Detector provides an efficient solution to expedite method development and quickly confirm peak identity via orthogonal mass detection for impurity profiling.
Optimization for Phosphothioated Oligonucleotides (FLP-PS)
To verify the capability of the ACQUITY QDa II Mass Detector in characterization of modified oligonucleotides, the phosphorothioated sample (FLP-PS) with a 10% spike-in of shortmer (n-T) was analyzed using the same approach. In this instance, TEA/HFIP was used to facilitate separation of the FLP-PS sample and its associated impurities.6,7 Partial resolution of the PO impurity was achieved where a concentration of 15 mM TEA/HFIP was observed as a good balance between peak resolution and MS detector response (Figure 7). Using these conditions, the gradient has further improved the separation of major impurities from the PS sample.
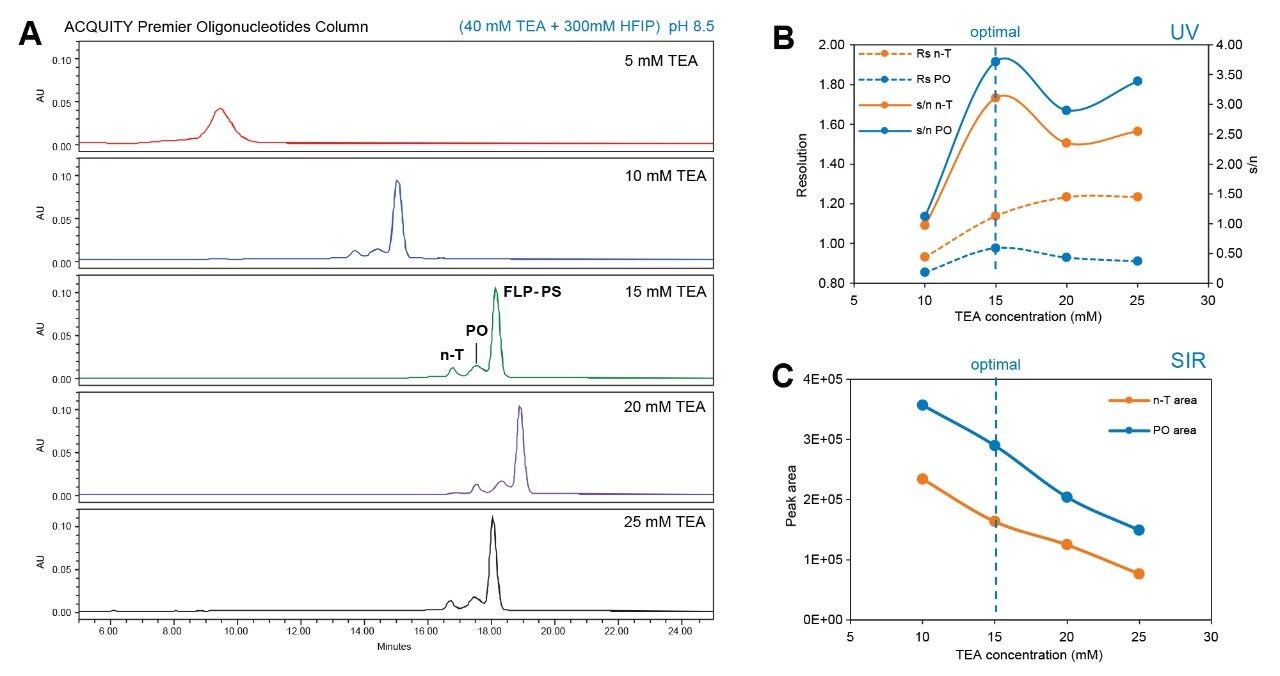
Figure 7. A) TEA/HFIP concentration screening for the separation of FLP-PS from n-T and PO impurities. Resolution and signal-to-noise ratio from UV spectra (B) and peak area of SIR channels (C) with the increasing of TEA concentration.
*A temperature pre-screening was performed at 45 °C, 60 °C, and 70 °C, with 70 °C brings the best separation. All data presented in this application note were collected at 70 °C.
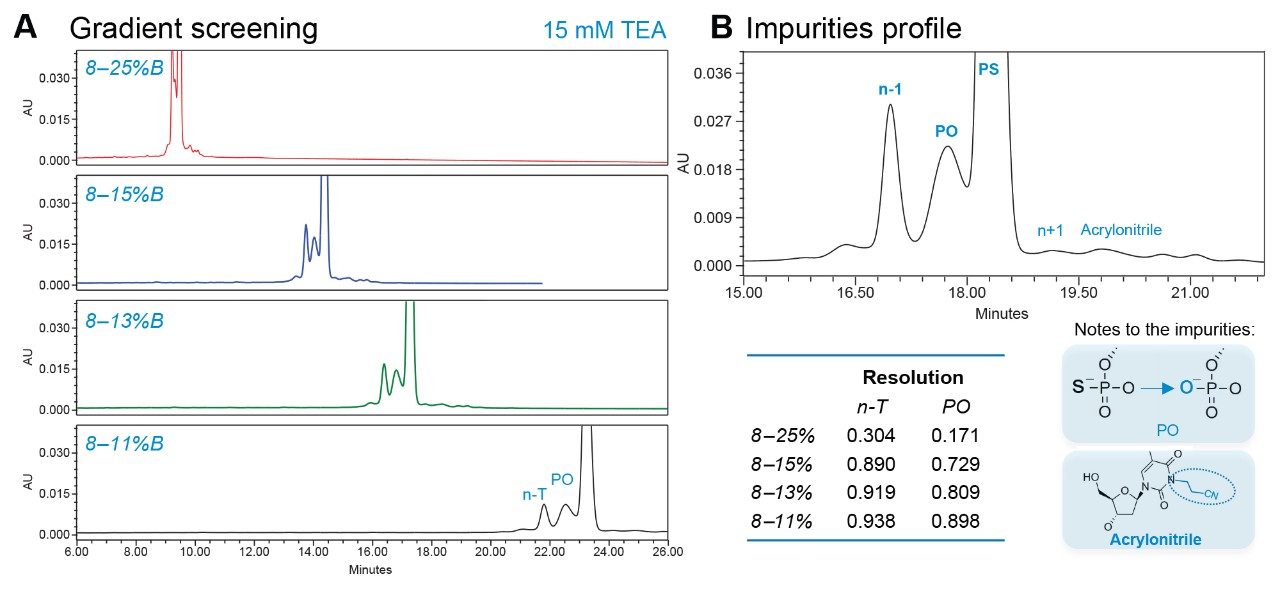
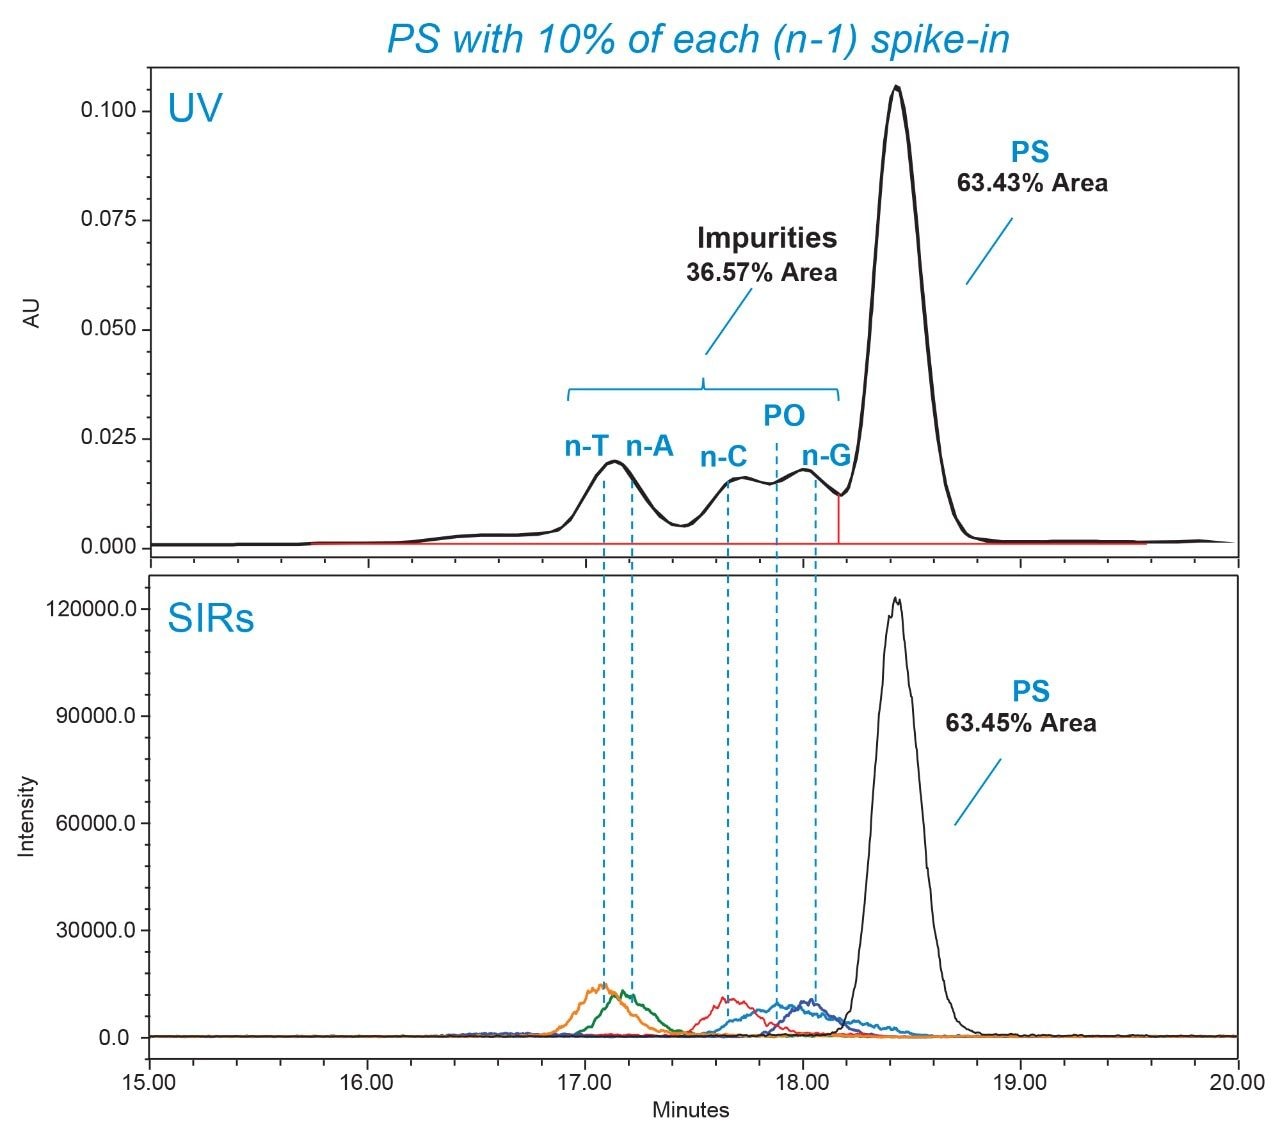
As indicated in Figure 8, a gradient for 8–11% offered optimal resolution of PO impurities without overly extending analysis time and lowering overall sensitivity through band broadening. Longmer (n+1) impurities and the acrylonitrile impurities were confirmed to be separated from the FLP under increased mass load (Figure 8B). The optimized conditions were similarly evaluated using a spike-in panel of n-1 impurities with the ACQUITY QDa II Mass Detector in-line. As shown in Figure 9, the impurity levels are in good agreement between the UV and SIR channels in the spike-in sample. Mass detection enhances specificity, revealing that the PO impurity causes co-elution and shouldering in the UV response. This detailed understanding allows for more accurate PO quantification and aids future method improvement.
Impurity Profiling of FLP-PS with LC-UV/MS
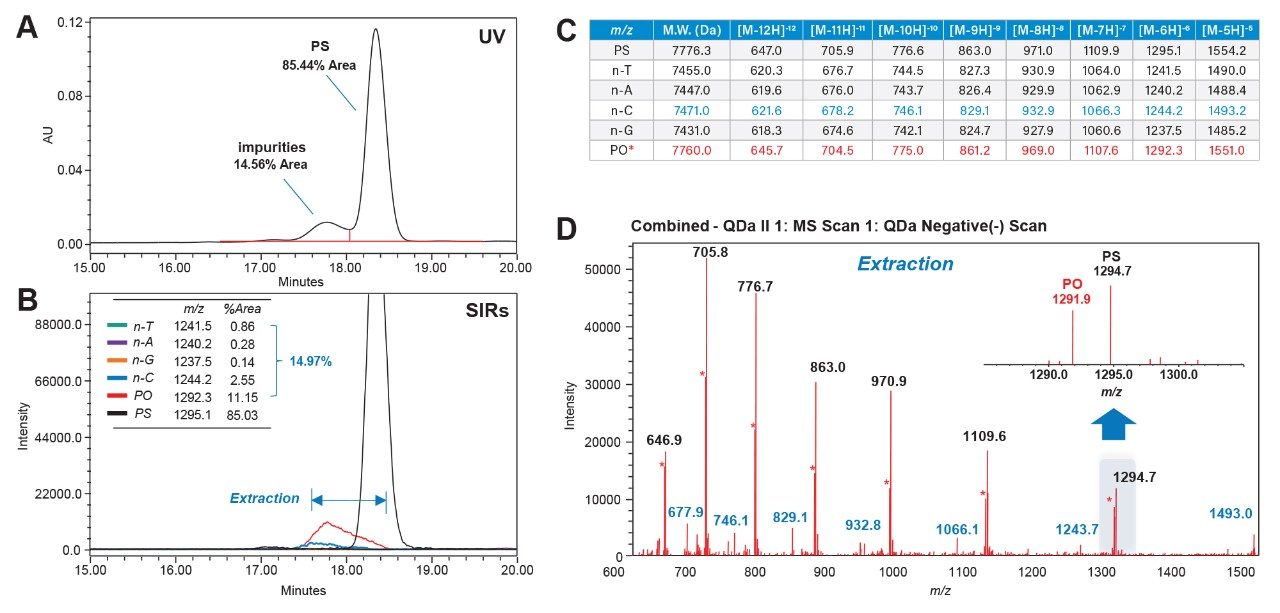
This is shown in the analysis of the stock FLP-PS sample. In Figure 10A, the UV spectrum reveals a broad impurity peak (14.56% of the total area). With the increased specificity of the ACQUITY QDa II Mass Detector in SIR mode, individual impurities are distinguished for more accurate assessment. Figure 10B shows that the peak is mainly comprised of oxidized PO impurity (11.15%) and n-C shortmer (2.55%), with other impurities at negligible levels. Full scan data (Figure 10D inset) confirms no ion overlap between the PO impurity (1291.9 m/z) and FLP ion (1294.7 m/z), as well as for n-C shortmer. This data demonstrates the ACQUITY QDa II Mass Detector’s ability to identify PO impurities that would be obscured in UV detection, improving impurity quantification. The integration of quaternary solvent blending and MS offers an efficient method development platform for consistently monitoring oligonucleotide impurities in manufacturing environments.
Conclusion
In summary, this integrated LC-UV/MS workflow tackles the common challenges users may face in oligonucleotide method development - particularly the need for faster optimization, confident analyte identification, and robust impurity profiling. The ACQUITY Premier LC System with quaternary solvent capabilities, coupled with the ACQUITY QDa II Mass Detector, streamlines method development by enabling both UV and mass-based detection, reducing setup time and analytical complexity.
With extended mass range and sensitivity, the workflow described in this application note enables more comprehensive analysis of larger oligonucleotide species and related impurities, helping scientists meet stringent regulatory and QC requirements more efficiently. Additionally, this approach addresses a growing need for scalable, reproducible workflows that can be readily adopted in routine quality control environments.
References
- N. M. El Zahar, N. Magdy, A. M. El-Kosasy, M. G. Bartlett. Chromatographic approaches for the characterization and quality control of therapeutic oligonucleotide impurities. Biomedical Chromatography. 2018, 32, e4088.
- F. Eckstein. Phosphorothioates, essential components of therapeutic oligonucleotides. Nucleic Acid Ther. 2014, 24 (6), 374–387.
- S. M. McCarthy, M. Gilar. Hexylammonium Acetate as an Ion-Pairing Agent for IP-RP LC Analysis of Oligonucleotides. Waters Application Note. 720003361. 2016.
- R.E. Birdsall, X. Du, K. Nyholm. Extending the Analytics of Biopharmaceutical QA/QC Labs with the ACQUITY™ QDa™ II Mass Detector. Waters Application Note. 720008386. 2024.
- P. Bigos, X. Du, R.E. Birdsall, K. Nyholm. Advancing Sensitivity and Efficiency in Released N-Linked Glycan Analysis With the ACQUITY™ QDa™ II Mass Detector. Waters Application Note. 720008631. 2024.
- Z. Kadlecová, K. Kalíková, E. Eva Tesařová, M. Gilar. Phosphorothioate oligonucleotides separation in ion-pairing reversed-phase liquid chromatography: effect of ion-pairing system. J. Chromatogr. A. 2022, 1676, 463201.
- K.J. Fountain, M. Gilar, J.C. Gebler. Analysis of native and chemically modified oligonucleotides by tandem ion-pair reversed-phase high-performance liquid chromatography/electrospray ionization mass spectrometry. Rapid Commun. Mass Spectrom. 2003, 17, 646–653.
720008796, April 2025