• Application Note

Triple Quadrupole Mass Spectrometry (Xevo TQ-XS) for the Quantification of Monoclonal Antibody Light Chains in Plasma

Triple Quadrupole Mass Spectrometry (Xevo TQ-XS) for the Quantification of Monoclonal Antibody Light Chains in Plasma

  • Caitlin Dunning
  • Mary E. Lame
  • Mark D. Wrona
  • Waters Corporation

For research use only. Not for use in diagnostic procedures.

Abstract

The work herein describes the development and optimization of sample preparation and LC-MS/MS methodology for the sensitive quantification of mAb subunit light chains using selective column chemistry and triple quadrupole mass spectrometry.

Benefits

  • Fast, reproducible, and simple sample preparation methods for the partial reduction of mAbs to light and heavy chain subunits
  • High analytical sensitivity quantification of adalimumab light chains (~23 kDa) via an ACQUITY UPLC I-Class PLUS System, BioResolve RP mAb Polyphenyl Columns, and Xevo TQ-XS Mass Spectrometer
  • Achieving 25 ng/mL LLOQs from 10 μL of rat plasma

Introduction

The increasing complexity of biotherapeutics is driving the need for more informative, selective, sensitive quantitative methods and sample preparation techniques. Although surrogate peptide methodology remains popular and has become increasingly easier to deploy, more direct measurements of monoclonal antibodies or their subunits is increasingly desired.1 This is an area where high resolution mass spectrometers demonstrate utility largely due to their extended mass range and resolution capabilities, however there are many instances where it may be appropriate and possible to transfer these assays to triple quadrupole mass spectrometers.2 Triple quadrupole instruments are ubiquitous in bioanalytical labs, robust, reliable, and suitable for large studies. Instruments with a mass range up to 2000 m/z can accommodate the identification and quantification of relatively large proteins including mAb subunit light chains (~23 kDa). An ongoing challenge in the analysis of larger molecules that must also be addressed is adequate chromatographic separation, especially at the low concentration levels required of many bioanalytical studies. The work herein describes the development and optimization of sample preparation and LC-MS/MS methodology for the sensitive quantification of mAb subunit light chains using selective column chemistry and triple quadrupole mass spectrometry. Extracted from 10 μL of rat plasma, lower limits of quantification of 25 ng/mL of adalimumab subunit light chains were achieved.

Experimental

Sample preparation

Preparation of samples, calibration standards, and QC samples

Calibration curve standards and quality control (QC) samples of adalimumab were prepared in commercially available rat plasma at various concentration levels (25–100,000 ng/mL). All calibration curve standards and blanks were prepared in triplicate, and all QC levels were prepared in quintuplicate. With the exception of blanks, all samples were spiked with cetuximab as the internal standard (ISTD).

Immunopurification

Adalimumab and its ISTD were extracted from plasma with biotinylated goat anti-human Fc antibody coupled to streptavidin coated magnetic beads (Promega P/Ns V7830 and V7820). 25 μL of bead slurry was aliquoted, washed, and equilibrated with tris buffered saline (TBS, 25 mM Tris, 150 mM NaCl, pH 7.2) prior to incubation with biotinylated antibody. 15 μL of biotinylated antibody was diluted to 100 μL with TBS and incubated for one hour with mixing (1200 rpm) at room temperature. Following incubation, beads were washed and equilibrated with TBS. 10 μL of rat plasma samples, 10 μL of ISTD, and 80 μL of TBS were combined with the anti-human Fc antibody charged streptavidin beads. Samples were incubated with mixing (1200 rpm) for one hour at room temperature, washed two times with TBS, and then washed two times with water to remove salts. The immunopurified samples were eluted from the beads with a 0.1% formic acid solution (50 μL), which was mixed for 15 min. Eluates were transferred to a clean PCR plate and then neutralized to pH 8.0 with 500 mM ammonium bicarbonate (5 μL).

Reduction and alkylation

Following affinity purification, samples were reduced and alkylated with reagents from the ProteinWorks Auto-eXpress Reduction/Alkylation Kit (p/n 186008889). Dithiothreitol (DTT) and iodoacetamide (IAM) were prepared in 50 mM ammonium bicarbonate at ProteinWorks kits’ stock concentrations of 70 mM and 142 mM respectively. These stocks were then diluted further with 50 mM ammonium bicarbonate to 12 mM and 78 mM respectively immediately prior to addition to samples. Affinity purified samples (55 μL) were reduced with 5 μL DTT (final concentration 1 mM) for 20 minutes at 37 °C, then alkylated with 5 μL of IAM (final concentration 6 mM) for 30 minutes at room temperature in the dark. Samples were acidified with 5 μL of formic acid (final concentration 1% v/v) and injected (10 μL) for LC-MS/MS analysis.

LC-MS/MS method conditions

LC system:

ACQUITY UPLC I-Class PLUS (Fixed Loop)

Detection:

Xevo TQ-XS Mass Spectrometer, ESI+

Column:

BioResolve RP mAb Polyphenyl Column 450 Å, 2.7 μm, 2.1 × 50 mm

Column temp.:

80 °C

Sample temp.:

15 °C

Injection volume:

10 μL

Mobile phases:

A: 0.1% Formic acid in water

B: 0.1% Formic acid in acetonitrile

MS system:

Xevo TQ-XS

Capillary:

2.4 kV

Cone:

60 V

Source offset:

30 V

Source temp.:

150 °C

Desolvation temp.:

600 °C

Cone gas flow:

150 L/hr

Desolvation gas flow:

1000 L/hr

Collision gas flow:

0.15 mL/min

Nebulizer gas flow:

7 bar

System calibration: Low resolution (FWHM 1.0 Da)

Data management:

MassLynx (v4.2)

Quantification software:

TargetLynx

LC gradient:

Time (min)

Flow rate (mL/min)

%A

%B

Curve

Initial

0.300

85.0

15.0

6

1.00

0.300

85.0

15.0

6

1.50

0.300

75.0

25.0

6

4.00

0.300

70.0

30.0

6

5.50

0.300

10.0

90.0

6

6.50

0.300

10.0

90.0

6

7.00

0.300

85.0

15.0

6

8.50

0.300

85.0

15.0

6

Results and Discussion

Measurement of subunits presents several opportunities over intact quantification, including a decrease in the complexity of data analysis and quantification. However, there are inherent limits to this type of analysis including mass range and resolution which make it more difficult to measure heavy chain Fc/2 subunits which may be glycosylated, adding complexity to the mass spectra. Quantification of the light chain region is desirable because it contains the CDR, or variable region, which can be used to differentiate mAbs which have high sequence homology with each other or endogenous IgGs.3 Measurement of the light chain enables quantification of larger portions of the mAb and negates the need to identify unique surrogate peptides. Due to their size, light chain quantification assays can be transferred to triple quadrupole mass spectrometers enabling robust and reproducible quantification for large bioanalytical studies.

Sample preparation

Affinity purification combined with sample preparation for the mAb of interest is increasingly required for all LC-MS assays in order to remove matrix interferences and achieve the highest levels of sensitivity. Adalimumab and its internal standard cetuximab were extracted from rat plasma using a selective affinity capture method (Figure 1.)4 Following immunopurification, a simple and fast sample preparation protocol was developed for the partial reduction of mAbs to their light and heavy chain subunit components. Partial reduction cleaves the light chains from the heavy chain at the hinge region, and leaves internal disulfide bonds intact. During method development, stability studies (not shown) demonstrated that partially reduced light chains had stable signal over a large pH range (~1–10) when alkylated. In contrast, light chains were only stable under very low pH conditions, which may not be suitable for all types of analyses. To enable the use of this method under a variety of experimental conditions, alkylation was employed. The experiments described here seek to explore the feasibility of sensitive and rapid quantification of larger proteins via triple quadrupole mass spectrometry.

Figure 1. Sample preparation workflow for the quantification of adalimumab from rat plasma. Samples were immunopurified from 10 μL rat plasma using biotinylated goat anti-human Fc antibody coupled to streptavidin coated magnetic beads. Immunopurification eluates were reduced to subunits with DTT, alkylated with IAM, and quenched with formic acid prior to LC-MS/MS analysis.4

Chromatography

It is necessary to achieve complete chromatographic separation between the mAb of interest and its internal standard. This can be difficult to achieve with traditional columns and the short gradients desired for efficient bioanalytical analysis of potentially 100’s of samples. Although full separation of these subunits can be achieved by increasing the length of the chromatographic gradient, we found that using alternative column chemistry can achieve the same goal. Shown in Figure 2, we were able to successfully separate adalimumab from its internal standard cetuximab using a BioResolve RP mAb Polyphenyl Column5 with a cycle time of only 8.5 min. Furthermore, we demonstrate that BioResolve RP columns can be utilized for the sensitive quantification of mAb light chains with very little total protein on column (35.7 pg). Use of this column enabled a 2× reduction in total cycle time, and drastically improved light chain separation, enabling sensitive, fast, and reproducible quantification of adalimumab.

Figure 2. Representative chromatographic separation of mAb subunit light chains liberated from adalimumab and its internal standard cetuximab. Light chains were separated over a 2.5 min gradient using a BioResolve RP mAb Polyphenyl, 450 Å, 2.7 μm, 2.1 × 50 mm Column.

Mass Spectrometry

Characterization via Xevo G2-XS QTof

During assay development, adalimumab and cetuximab were well characterized via experiments performed on a Xevo G2-XS QTof high resolution mass spectrometer. Figure 3, Panels A and B demonstrate that full scan spectra collected using a triple quadrupole and high resolution mass spectrometer produce the same charge state envelopes, indicating that the most abundant precursors can be isolated and fragmented using either instrument. The Xevo G2-XS QTof Mass Spectrometer was used to discover and confirm selective product ions originating from the mAb subunit light chains, and accurately determine the identity of these product ions (Figure 3, Panel C).

Figure 3. Representative mass spectrometry full scan spectra of adalimumab collected on a Xevo TQ-XS triple quadrupole Mass Spectrometer (Panel A) and a Xevo G2-XS QTof high resolution Mass Spectrometer (Panel B). MS/MS fragmentation of adalimumab precursor 1304.64 m/z (+18) collected on the Xevo G2-XS QTof Mass Spectrometer (Panel C) was used to determine the identity of some of the most abundant fragment ions which were also observed on the Xevo TQ-XS Mass Spectrometer.

To aid in this, third party software ProSight Lite (Northwestern University)6 and Protein Prospector MS-Product function (UCSF)7 were leveraged to: identify light chain precursor ions, survey MS/MS scans to find selective b and y ions originating from the light chains, and confirm the cleavage sites of these fragments. During this phase of method development, a sensitive product ion of the +18 and +19 precursors was identified at 1329.85 m/z, corresponding to the y-ion cleavage between Phe-118 and Pro-119 (Figure 4, Panel A). The region in which this cleavage occurs corresponds to a portion of the light chain sequence which is conserved across many humanized IgG biotherapeutics, including adalimumab and cetuximab (Figure 4, Panel B). For this reason, this intense product ion is shared between the two mAbs and can be used for the quantification of both. A secondary, selective product ion corresponding to the b-ion cleavage of Val-115 and Phe-116 was identified at 1554.39 and 1556.24 m/z for adalimumab and cetuximab respectively. These product ions were used as qualifiers.

Figure 4. Fragment identification and MS parameters for adalimumab and cetuximab MRM transitions (Panel A). A common MS/MS fragment (1329.85 m/z, P119-y96) was identified from the conserved region of the adalimumab and cetuximab light chains, represented in Panel B.8

Quantification via Xevo TQ-XS

This assay was then transferred to the Xevo TQ-XS, a triple quadrupole mass spectrometer. Full scan MS (Figure 3, Panel A) and MS/MS experiments (not shown) were performed on this instrument to confirm that the most abundant precursor and fragment ions were the same on the high resolution and triple quadrupole mass spectrometers. Once confirmed, cone voltages and collision energies for the MRM transitions were optimized for the Xevo TQ-XS system (Figure 4, Panel A). To further improve sensitivity, the system was calibrated at low resolution, 1.0 Da at FWHM for both quadrupoles (in contrast to the standard ‘unit’ resolution of 0.75 Da at FWHM). This change in resolution settings improved assay sensitivity ~1.5 x with no significant changes to MS and MS/MS spectra quality. The Xevo TQ-XS System enabled fast, robust, and reproducible quantification of adalimumab light chains while maintaining the ease of use of triple quadrupole mass spectrometers.

Linearity, precision, and accuracy

Sample preparation, LC, and MS methods were developed and optimized to enable linear, precise, and accurate quantification of adalimumab. Extracted from 10 μL of rat plasma, lower limits of quantification (LLOQs) of 25 ng/mL were achieved. Calibration curves were linear (r2>0.99) from 25–100,000 ng/mL using a 1/x2 fit (Table 1) and accurate within ±15%, as well as QCs which achieved CVs <7%. QC performance is highlighted in Table 2 and chromatographic performance at the LLOQ is demonstrated in Figure 5.

Table 1. Linear dynamic range and standard curve statistics for adalimumab light chains extracted from rat plasma.
Table 2. QC quantitative performance for adalimumab light chains extracted from rat plasma.
Figure 5. Representative blank, LLOQ, and LQC chromatograms for adalimumab light chains extracted from rat plasma.

Conclusion

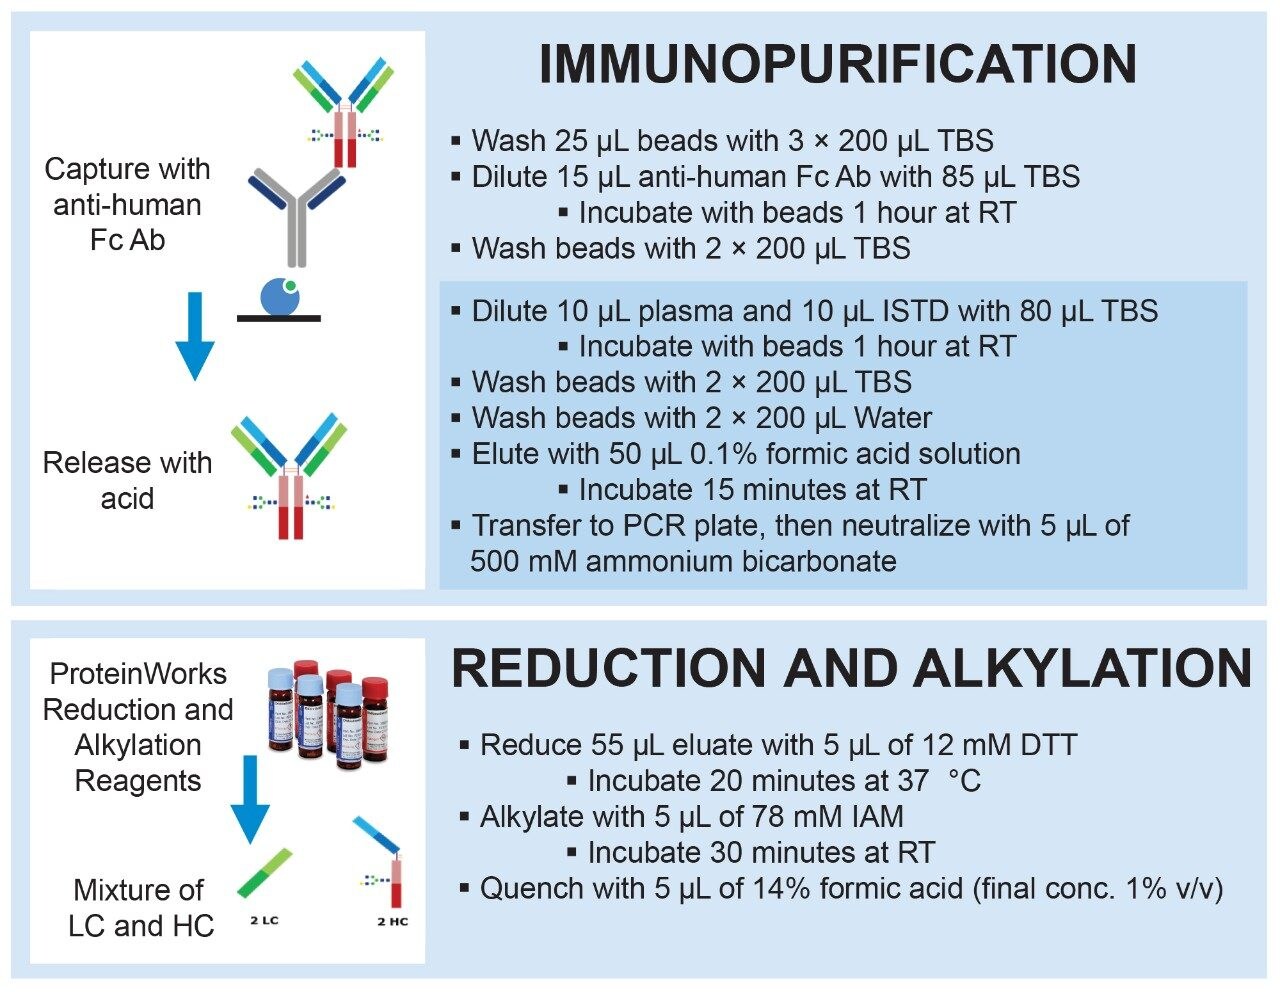
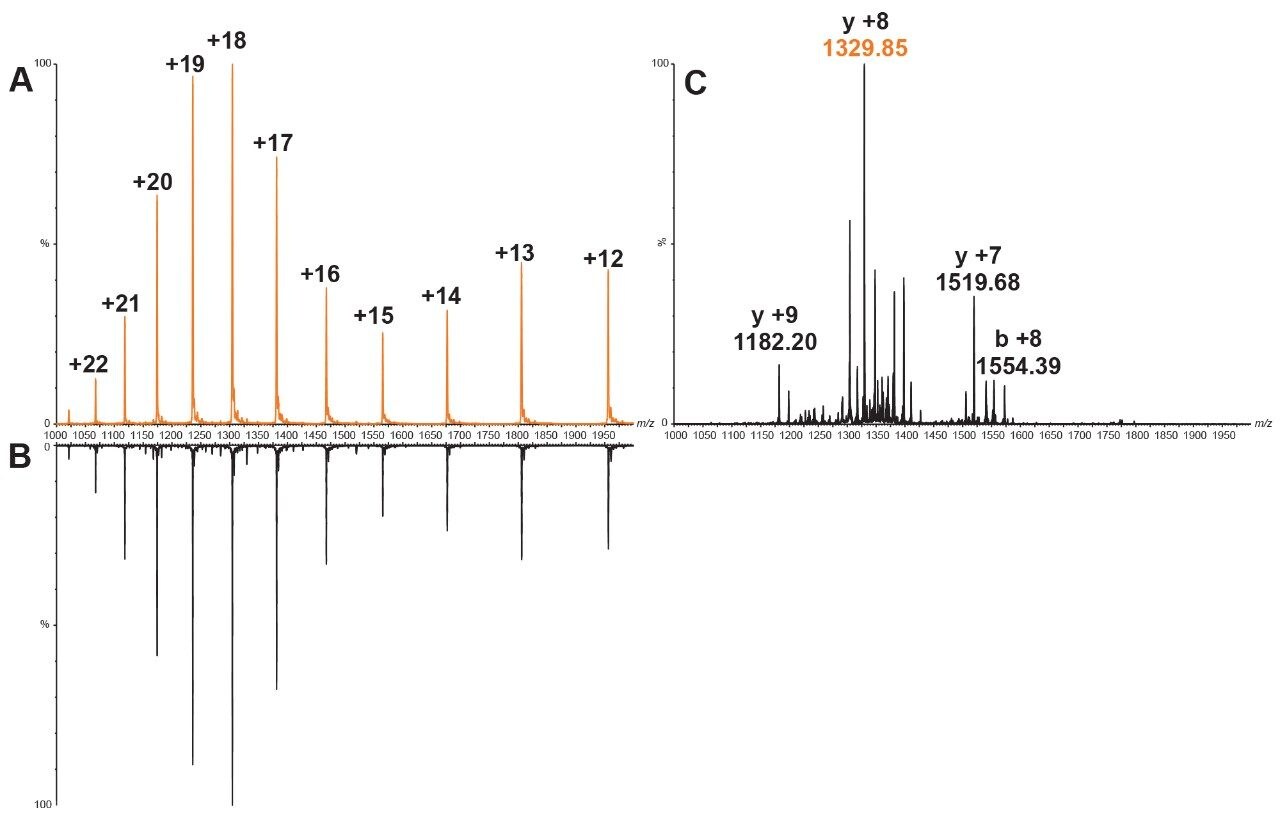
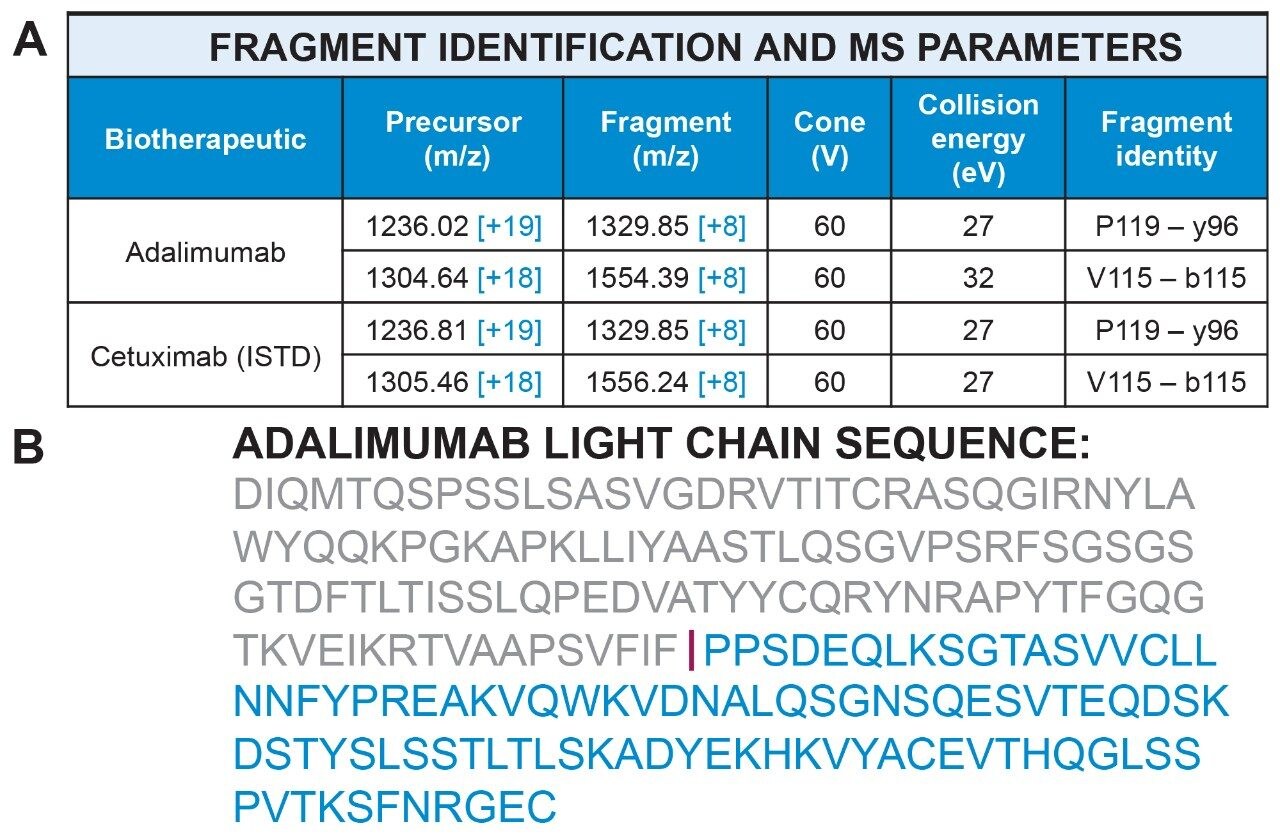
Current biotherapeutics are both complex in structure and typically have high sequence homology to endogenous proteins and antibodies. Due to this, there may be very few peptides which are completely unique to a particular monoclonal antibody, such as adalimumab. Therefore, many peptides may suffer from matrix interferences which can hinder the lower limits of quantification. This provides an opportunity for proteins to be quantified at the intact or subunit level in order to avoid issues arising from the surrogate peptide method of analysis and the complex workflows associated with it. The work described here employs selective and specific sample preparation workflows and superior chromatographic separation of mAb subunit light chains. Combined with the identification of generic and sensitive MS/MS fragments, these methods enabled the high sensitivity, and accurate quantification of mAb subunit light chains via triple quadrupole mass spectrometry.

■ Highly specific immunoaffinity capture techniques and a simple workflow for the partial reduction of monoclonal antibodies were developed and optimized

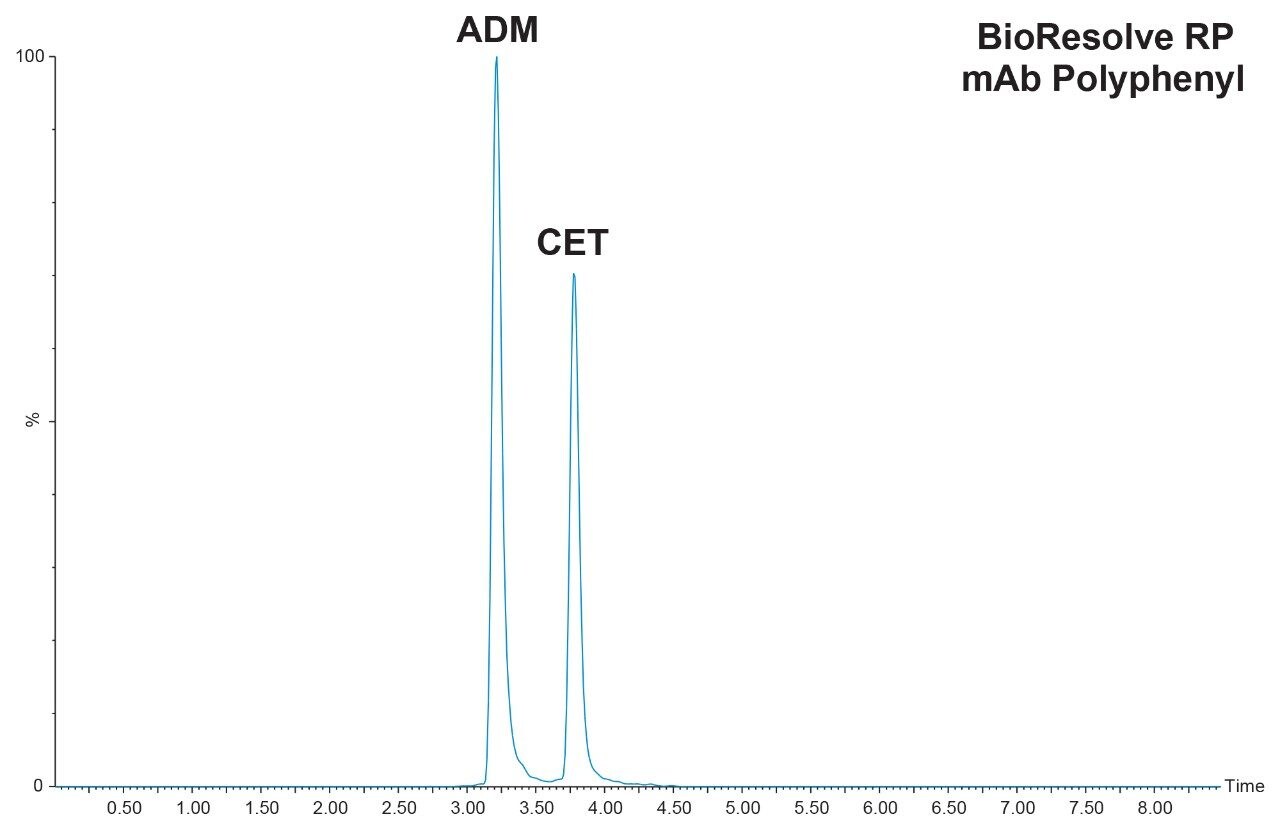
■ BioResolve RP mAb Polyphenyl columns successfully resolved and enabled fast (8.5 minute cycle time) chromatographic separation of the mAb subunit light chains for both adalimumab and cetuximab

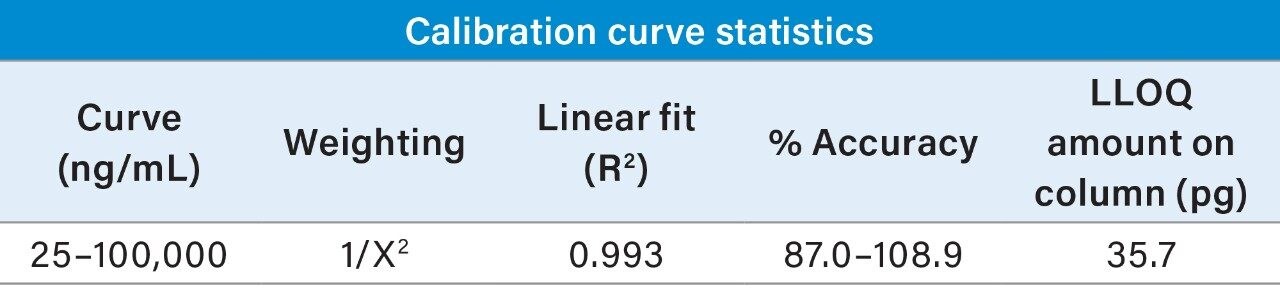
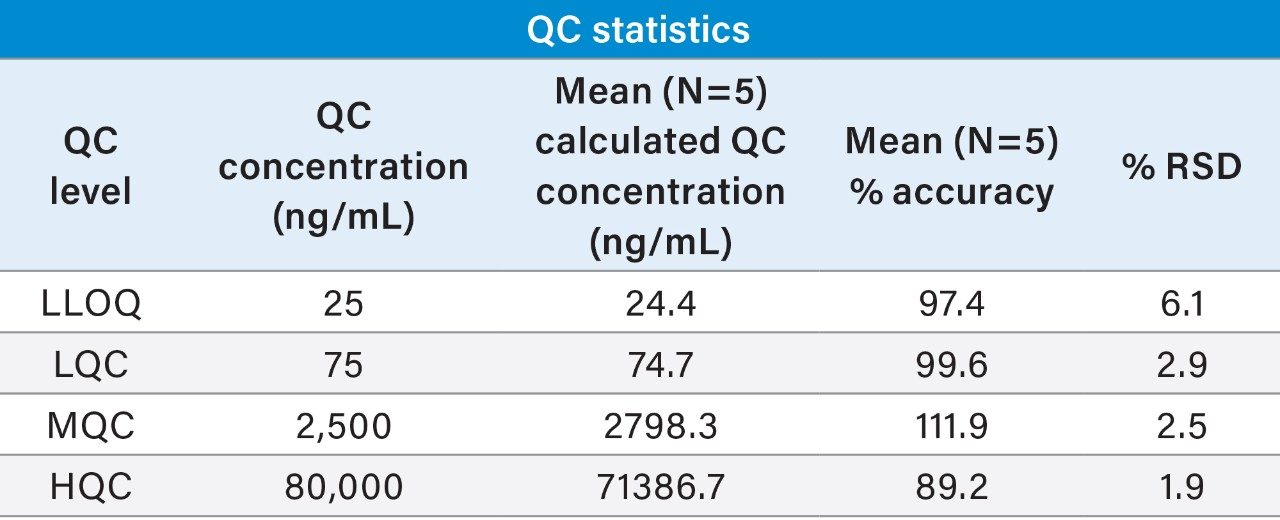
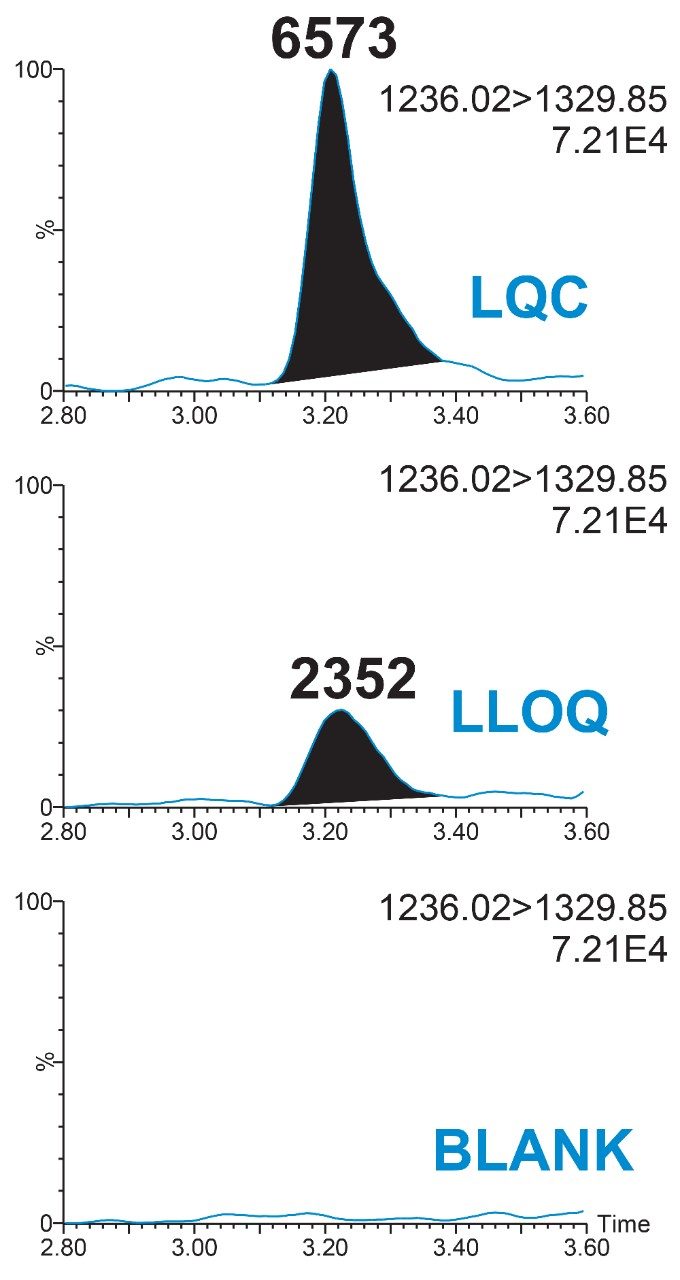
■ Using only 10 μL of rat plasma, adalimumab subunit light chains can be quantified reliably, achieving LLOQs of 25 ng/mL and a linear dynamic range >3.5 orders of magnitude

References

  1. Ladwig, P.M.; Barnidge, D.R.; Willrich, M.A.V; Mass Spectrometry Approaches for Identification and Quantitation of Therapeutic Monoclonal Antibodies in the Clinical Laboratory. Clinical and Vaccine Immunology (CVI). 24.5 (2017): e00545–16.
  2. Wang, E.H.; Combe, P.C.; Schug, K.A.; Multiple Reaction Monitoring for Direct Quantitation of Intact Proteins Using a Triple Quadrupole Mass Spectrometer. J. Am. Soc. Mass Spectrom. 27 (2016): 886–896.
  3. Mills, J.R.; Cornec, D.; Dasari, S.; Ladwig, P.M.; Hummel, A.M.; Cheu, M.; Murray, D.L.; Willrich, M.A.; Snyder, M.R.; Hoffman, G.S.; Kallenberg, C.G.M.; Langford, C.A.; Merkel, P.A.; Monach, P.A.; Seo, P.; Spiera R.F.; St. Clair, E.W.; Stone, J.H.; Specks, U.; Barnidge, D.R.; Using Mass Spectrometry to Quantify Rituximab and Perform Individualized Immunoglobulin Phenotyping in ANCA-Associated Vasculitis. Analytical Chemistry. 88 (2016): 6317–6325.
  4. Dunning, C.M.; Lame, M.; Wrona, M.; Haynes, K.; Tackling Non-Specific Binding of Biotherapeutics Using LC-MS Compatible QuanRecovery Sample Plates with MaxPeak High Performance Surfaces. Waters Application Note 720006528EN, March 2019.
  5. Nguyen, J.M.; Kizekai, L.; Walsh, D.; Cook, J.; Lauber, M.A.; A Novel Phenyl Bonded Phase for Improved Reversed-Phase Separations of Proteins. Waters Application Note 720006169EN, January 2018.
  6. Fellers, R.T.; Greer, J.B.; Early, B.P.; Yu, X.; LeDuc, R.D.; Kelleher, N.L.; Thomas, P.M.; ProSight Lite: Graphical Software to Analyze Top-Down Mass Spectrometry Data. Proteomics. 15.7 (2015): 1235–1238. Accessed July 2018 from http://prosightlite.northwestern.edu/.
  7. Protein Prospector, “Proteomics Tools for Mining Sequence Databases in Conjunction with Mass Spectrometry Experiments.” Accessed July 2018, v. 5.22.1, at http://prospector.ucsf.edu/prospector/ mshome.htm.
  8. Adalimumab, protein sequence. Retrieved 15 Aug 2018 from https://www.drugbank.ca/drugs/DB00051.

720006716, November 2019

Back To Top Back To Top