• Application Note

Analysis of Microcystins in Urine with 2D-LC-MS/MS – Part III

Analysis of Microcystins in Urine with 2D-LC-MS/MS – Part III

  • Beatriz Renner
  • Sabra R. Botch-Jones
  • Claude R. Mallet
  • Boston University School of Medicine
  • Waters Corporation

Abstract

This application demonstrates the effectiveness of captive SPE extraction process for microcystins by 2D-LC-MS/MS from urine.

Benefits

  • Extraction protocol optimization <30 minutes.
  • Effective elimination of time-consuming evaporation and reconstitution steps with 2D-LC-MS/MS.

Introduction

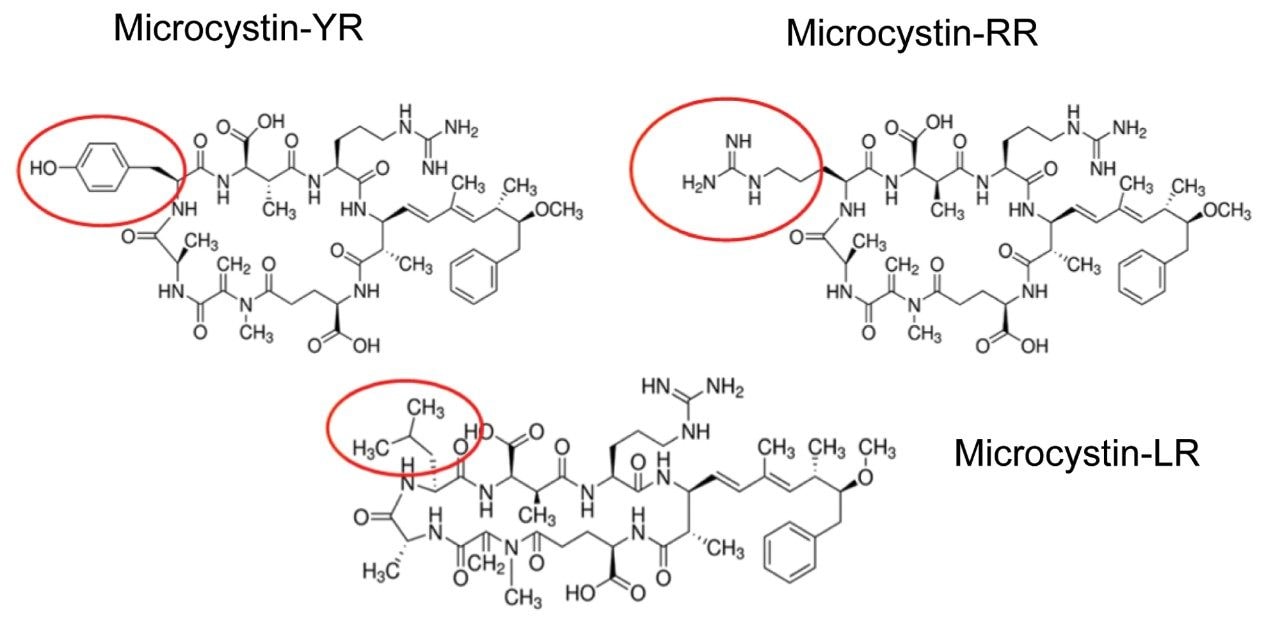
Algae “super blooms” are a commonly encountered environmental issue in fresh water that occurs due to the buildup of cyanobacteria. Their presence is predominantly linked to excess nutrients (fertilizers) from water runoff. Many of the commonly encountered cyanobacteria produce potent cyanotoxins that pose serious health threats and even death to local wild life and humans. Microcystins are produced by the most notable and widespread cyanobacteria1,2 “Microcystis aeruginosa” from which the toxins take their name. When released, microcystins may persist for weeks to months, because they are nonvolatile, hydrophilic, stable in sunlight, and stable over a wide temperature/pH range. Chemically, microcystins are cyclic heptapeptides produced through non-ribosomal peptide synthases. Microcystins consist of a seven-membered peptide ring which is made up of five non-protein amino acids and two protein amino acids. It is these two protein amino acids that distinguish microcystins from one another, while the other amino acids are more or less constant between variant microcystins. Using amino acid single letter code nomenclature, each microcystin is designated a name depending on the variable amino acids which complete their structure. Microcystin-LR is named for containing the variable amino acids leucine (L) and arginine (R). Microcystin-LR was the first identified and is the most commonly studied to date. Other common microcystins include RR, YR for Tyrosine (Y), and LA for Alanine (A).

Microcystins in drinking water are not regulated by the US EPA, however, they are unregulated microbial drinking water contaminants listed on the US EPA Contaminant Candidate Lists (CCLs) 1 and 2 as cyanobacteria and their toxins. Certain cyanotoxins, specifically anatoxin-A, microcystin-LR and cylindrospermopsin, are on the US EPA CCL3. The World Health Organization3 (WHO) conducted an evaluation of the tolerable daily intake (TDI) level, based on a non-cancer endpoint. The obtained value of 0.04 micrograms per kilogram body weight per day (μg/kg/d), is based on the results of liver toxicity studies in mice. A TDI is the maximum daily dose of microcystins that is considered safe. Using this TDI, the WHO also developed a drinking water concentration limit of 1.5 μg/L for microcystin LR. For this study, they assumed that a 60 kg (132 lbs.) person drinks two liters of water each day and that 80% of the two liters is from a contaminated source. Furthermore, microcystin contaminated fresh-water that empties into the ocean has been shown to also lethally affect marine life in the area of contamination.

Human consumption of tainted sea life can lead to microcystin exposure and even death. Several analytical techniques that have been developed for the analysis of microcystins include the mouse bioassay,4 phosphatase inhibition5 assay, enzyme-linked immunosorbent assay (ELISA),6 and reversed-phase high performance liquid chromatography (RP-HPLC),7-8 just to name a few. Little has been done with multi-dimensional chromatography, thus a method was developed for forensic postmortem analysis in biological fluids of microcystins RR, LR, and YR by 2-dimensional (2D) liquid chromatography mass spectrometry (LC-MS/MS).9-11

Experimental

Two MRM transitions (quantification and confirmation) for each microcystin were selected and optimized. The MRM conditions are listed in Table 1. For this application, finding the optimum extraction and chromatographic conditions for this multi-residue analysis posed a significant challenge. The chromatographic conditions were tested on several trapping chemistries (Oasis HLB, XBridge C18, and XBridge C8) and one separation chemistry (BEH C18) from Waters Corporation, Milford, MA, USA. The loading (low pH, high pH, and neutral pH) and eluting mobile phase (methanol or acetonitrile at low and high pH) were also optimized using an automated 6 × 6 process. All microcystin standards were purchased from Enzo Lifesciences (Figure 1). All solvents were LC grade or higher and obtained from Fisher Scientific (Fair Lawn, NJ, USA). The formic acid and ammonium hydroxide were purchased from Sigma Aldrich (St. Louis, MO, USA). The extraction process was performed on pre-conditioned reversed-phase sorbent (Oasis HLB SPE 3 cc 60 mg barrel, Waters Corporation, Milford, MA, USA) for the captive extraction for the screening extraction.

Table 1. MRM transitions for YR, LR, and RR.
Figure 1. Chemical structure for YR, LR, and RR.

Loading conditions

Column:

Oasis HLB 20 μm–80 mg, 2.1 × 30 mm

Loading:

MilliQ water (pH 7, no additives)

Flow rate:

2 mL/min

At-column dilution:

5% (0.1 mL/min loading pump and 2 mL/min diluting pump)

UPLC conditions

System:

ACQUITY UPLC with 2D Technology configured for trap and elute with at-column dilution

Runtime:

10 min

Column:

ACQUITY UPLC BEH C18, 1.7 μm, 2.1 × 50 mm (p/n: 186002350)

Column temp.:

60 °C

Mobile phase A:

Water + 0.5% formic acid

Mobile phase B:

Acetonitrile + 0.5% formic acid

Elution:

5 min linear gradient from 5% (B) to 95% (B)

Flow rate:

0.500 mL/min (elution pump)

Injection volume:

100 μL

MS conditions

System:

Xevo TQ-S

Ionization mode:

ESI+

Capillary voltage:

3.0 kV

Cone voltage:

90.0 V

Source temp.:

150 °C

Desolvation temp.:

550 °C

Desolvation gas:

1100 L/hr

Cone gas:

50 L/hr

Results and Discussion

Separation and Detection

The separation conditions were optimized for each microcystin according to a 2D-LC 6 × 6 elution scheme (Figure 2) for both aqueous and organic standards. Microcystins are heptapeptides, and these molecule types have the potential to show zwitterionic behaviour and possibly lead to adsorption or solubility issues. When utilizing multidimensional chromatography, a wide range of options become available, not seen with single dimension separations. At-column dilution (ACD) allows for the option of injecting 100% organic extracts which in turn yields a 50% reduction during sample preparation. In Figure 3, a side-by-side comparison of a 15 μL acetonitrile injection in 1D versus 100 μL acetonitrile injection in 2D clearly shows the versatility of the multidimensional chromatography technique. The breakthrough effect of an organic extract in 1D is a known fact and has been well documented for years. Therefore, the large volume injection of a 100% organic extract capability of a 2D system with a trap-and-elute ACD configuration, can have a significant positive impact on sample preparation protocol.

Figure 2. Grid for 6 x 6 method optimization.
Figure 3. 1D vs 2D for YR, LR, and RR.

The results of the 6 × 6 grid are shown in Figure 4. With the optimization of four key parameters, a target analyte can be focused in a tight narrow band on the first dimension and transfer onto the second dimension with a Gaussian profile. The compilation of the 36-method variants gave an in-depth understanding of a target analyte’s separation behaviour. The grid is colour coded to give a strong visualization effect to identify which condition will produce a Gaussian profile (green box). If a set of conditions produces a signal with any type of chromatography distortion (i.e., leading, split, tailing, shoulder, etc.), the corresponding result is flagged by a yellow box. All absence of signal is highlighted by a red box. Overall, microcystin YR shows that up to 25 methods (aqueous and organic standards) or 29 (organic standards only), out of 36 total, will yield a Gaussian profile. The rationale behind an aqueous versus methanol or acetonitrile standard is to investigate the possibility of adsorption or non-specific binding onto the glass surface, if standards are stored in glass vials and under aqueous conditions. Once all 36-method results are compiled for each microcystin, the next phase is to identify which method can be used for all three target analytes. In this instance, since there are only three analytes plus an internal standard, the results in Figure 5 cross reference all 36 methods against the methanol and acetonitrile standards for each microcystin. The compilation eliminated all yellow and red results and concentrated only on Gaussian profile (green box) and highest intensities. Each method is given a score, and for each method producing a maximum score, the result is highlighted in the far end column, listing which methods can be used for the application. In this instance, 28 methods can be selected for the analysis of microcystins YR, LR, and RR, including nodularin as internal standard. For this application, method 14 was selected for highest signal intensities across all four analytes for both methanol and acetonitrile standards.

Figure 4. The 6 × 6 grid target hit for YR.
Figure 5. Cumulative 6 × 6 hit for YR, LR, and RR.

Single Stage 2D Captive Extraction

Once the LC and MS optimization phases were completed, the next steps focused on sample cleanup, enrichment, and retention behavior. In this instance, mapping the retention behavior at the sample preparation level produces cleaner extracts. This strategy relies on identifying key elution points (0–100% recovery) against the target analyte’s pKa and solubility. Figure 6 shows a threestep sequential elution, with three elution strengths and two pH values. The experimental workflow utilized two SPE cartridges for three elution solvents (methanol, acetonitrile, and acetone) with a 10% elution incremental from 0–100% at pH 3 and 10. Each elution cut was analyzed by the 2D-LC trap and elute with an ACD system without any need for solvent evaporation and reconstitution. The results are tabulated in Table 2. The rationale of using pH 3 and 10 was to understand the retention behavior of microcystins according to their pKa values. For example, under neutral elution conditions, it is expected to see high k’ values, thus requiring a higher percentage of organic for a total release of the target analyte from the extraction sorbent and vice versa under ionized conditions. This separation behavior would fit if the target analyte is comprised of basic moieties. For microcystin RR, at pH 3 elution with acetonitrile, the analyte is completely eluted between 20%–40%, with the bulk of the analyte eluting at 30%. However, at pH 10, RR elutes in a tighter elution cut between 20%–30%. This result suggests that RR behaves as an acidic entity (low k’ at pH 3 and high k’ at pH 10). The microcystins LR and YR are producing similar profiles under low and high pH elution, but at different elution profiles. The acetone and methanol showcase pH profiles but at higher elution percentages, thus giving insight on the microcystin’s solubility.

Figure 6. Single-stage 2D extraction protocol.
Table 2. Elution profile of YR, LR, and RR with methanol and acetonitrile.

As the workload progressed, a discrepancy during the optimization of the extraction protocol was noticed. In Figure 8, three standards of YR, LR, and RR in 100% water methanol and acetonitrile are shown. Since microcystins are peptides in nature, the aqueous standard shows excellent signal. However, the acetonitrile standard shows a complete loss of signal for RR and a 50% reduction for LR. Due to their peptide nature, microcystins exhibit a peculiar solubility trend12 as seen in Figure 7. For acetonitrile and acetone, it appears that at low (<50%) and high (>75%) percentages of organic solvent, the response factor for YR, LR, and RR can drop as must as 50% in area count. These results had an impact on the end protocol for the extraction phase. Thus, the elution profile shown in Table 2 was re-evaluated, and the third solvent (acetone) was added to complete at this point. The diagram in Table 3 shows an updated elution chart for YR, LR, and RR. A new extraction protocol was also identified from those results.

Figure 7. A 2D-LC-MS/MS chromatogram for YR, LR, and RR in water, methanol, and acetonitrile.
Figure 8. Elution profile of YR, LR, and RR with methanol, acetonitrile, and acetone.
Table 3. Elution profile of YR, LR, and RR with methanol, acetonitrile, and acetone.

The results for the first extraction method with a wash step at 30% methanol at pH 3 followed by an elution at 40% acetonitrile at pH 10 (Figure 9), showing drastic low recovery values for RR and LR when extracting from urine. This confirms the trend seen in Figure 8, therefore an updated method was chosen in which the elution solvent is methanol to avoid solubility issues during extraction. The final SPE conditions chosen comprised of two wash steps at 40% methanol at both pH 3 and pH 8, and an elution step of 70% methanol at pH 10, yielded excellent recoveries for YR, RR, and LR in urine (Figure 10).

Figure 9. Extraction protocol 1 – wash at 30% methanol at pH 3 and elution with 40% acetonitrile at pH 10.
Figure 10. Extraction protocol 2 – wash with 40% methanol at pH 3 and pH 10; elution with 70% methanol at pH 10.

Conclusion

This application demonstrates the effectiveness of captive SPE extraction process for microcystins by 2D-LC-MS/MS from urine. The 6 × 6 chromatography method optimization was completed over ~18 hours. The option of direct large volume injections of up to 100% organic extracts made it possible to optimize an extraction protocol with a total work time of <30 minutes. This added benefit of 2D-LC-MS/MS allows direct injections of aqueous and organic extracts at various percentages to effectively eliminate time-consuming evaporation and reconstitution steps. The captive extraction protocol produced a 90% recovery of microcystins YR, LR, and RR in urine.

References

  1. Theiss, W. W.; Carmichael, J.; Wyman, J.; Brunner, R. Blood Pressure and Hepatocellular Effects of the Cyclic Heptapeptide Toxin Produced by Freshwater Cyanobacterium (Blue-Green Alga) Micocystis Aeruginosa Strain PCC-7820. Toxicon. 1988, 26, 603–613.
  2. Runnegar, M. T. C.; Andrews, J.; Gerdes, R. G.; Falconner, I. R. Injury to Hepatocytes Induced by Peptide Toxin from the Cyanobacterium Microcystis Aeruginos. Toxicon. 1987, 25, 1235–1239.
  3. Gupta, S. WHO Guidelines for Drinking Water Quality: Recommendations, 2nd ed., Addendum to vol. 1. World Health Organization, Geneva, Switzerland, 1998, p. 36.
  4. Codd, G. A.; Poon, G. K. Biochemistry of the Algea and Cyanobacteria, Clarendon Press, Oxford, U.K., 1988, p. 283.
  5. Rapala, J.; Erkomaa, K.; Kukkonen, J.; Sivonen, K.; Lahti, K. Detection of Microcystin with Protein Phosphate Inhibition Assay, High-Performance Liquid Chromatography-UV Detection and Enzyme-Linked Immunosorbent Assay Comparison of Methods. Anal. Chim. Acta 2002, 466, 213–231.
  6. Fischer, W. J.; Garthwaite, J.; Miles, C. O.; Ross, K. M.; Aggen, J. B.; Chamberlin, A. R.; Towers, N. R.; Dietrich, D. R. Congener-Independent Immunoassay for Microcystins and Nodularins. Environ. Sci. Technol. 2001, 35, 4849–4856.
  7. Zhang, L.; Ping, X.; Yang, Z. Determination of Microcystin LR in Surface Water Using High Performance Liquid Chromatography/Tandem Electrospray Ionization Mass Detector. Talanta 2004, 62, 196–200.
  8. Mila, M.; William, L. B. A LC/MS Method for the Determination of Cyanobacteria Toxins in Water. Anal. Chem. 2004, 76, 1342–1352.
  9. Mallet, C. R.; Botch-Jones, S. Illicit Drug Analysis Using Two-Dimension Liquid Chromatography/ Tandem Mass Spectrometry. J. Anal. Toxicology 2016, 40 (8), 1–11.
  10. Mallet, C. R. Multi-Dimensional Chromatography Compendium: Trap & Elute vs At-column Dilution. White Paper-Waters Corporation, 720005339EN (2015).
  11. Mallet, C. R. Analysis of Pharmaceuticals and Pesticides in Bottled, Tap and Surface Water Using the ACQUITY UPLC with 2D Technology. Application Note-Waters Corporation, 720005167EN (2014).
  12. Hyenstrand, P.; Metcalf, J. S.; Beattie, K. A.; Codd, G. A. Effects of Adsorption to Plastics and Solvent Conditions in the Analysis of the Cyanobacterial Toxin Microcystin-LR by High Performance Liquid Chromatography. Water Res. 2001, 35 (14), 3508–3511.

720006684, October 2019

Back To Top Back To Top