• Application Note

UPC2 Strategy for Scaling from Analytical to Preparative SFC Separations

UPC2 Strategy for Scaling from Analytical to Preparative SFC Separations

  • Christopher J. Hudalla
  • Abhijit Tarafder
  • Jo-Ann M. Jablonski
  • Kenneth J. Fountain
  • Waters Corporation

Abstract

The application of a systematic approach using density modulation facilitates the efficient transfer of SFC methods between different column configurations (length and/or particle size). In addition, this approach provides more flexibility in manipulating method conditions to explore broader flow rate regimes while maintaining chromatographic integrity. With application to both isocratic and gradient methods, this methodology is suitable for both chiral and achiral separations. This is especially pertinent for chiral method development in which multiple chiral columns may be screened against multiple modifier combinations using analytical configurations in a very short period of time. The resulting method can then be scaled up efficiently for preparative purifications, yielding predictable, reproducible chromatography. The ability to perform method development on the analytical scale before scaling directly to preparative chromatography represents a substantial savings in time and resources.

Benefits

  • Scaling strategy based on density modulation can be used to efficiently transfer methods across different SFC system/column configurations.
  • Density modulation can be used to offset changes in density caused by changes in mobile phase flow rate.
  • Density modulation enables the fast method development of SFC applications on the analytical scale using UPC2 with subsequent transfer to preparative SFC while maintaining chromatographic integrity.

Introduction

Scaling of chromatographic methods is a routine necessity to utilize different instrumentation or column configurations for a successful separation method. A common example of this would be the fast development of a chromatographic method on the analytical scale with the goal of transferring the separation to the preparative scale. For liquid chromatography (LC) applications, this scaling methodology is well understood and the guidelines for transferring methods are straight forward. For chromatographic methods using CO2 as the principal component of the mobile phase, the scaling process is not as well understood. This is due to the high compressibility of the CO2 mobile phase which makes many of the scaling methodologies developed for LC invalid. Therefore, most of the current scaling strategies used for supercritical fluid chromatography (SFC) are based on empirical observations and often times require additional method manipulation on the transferred system.

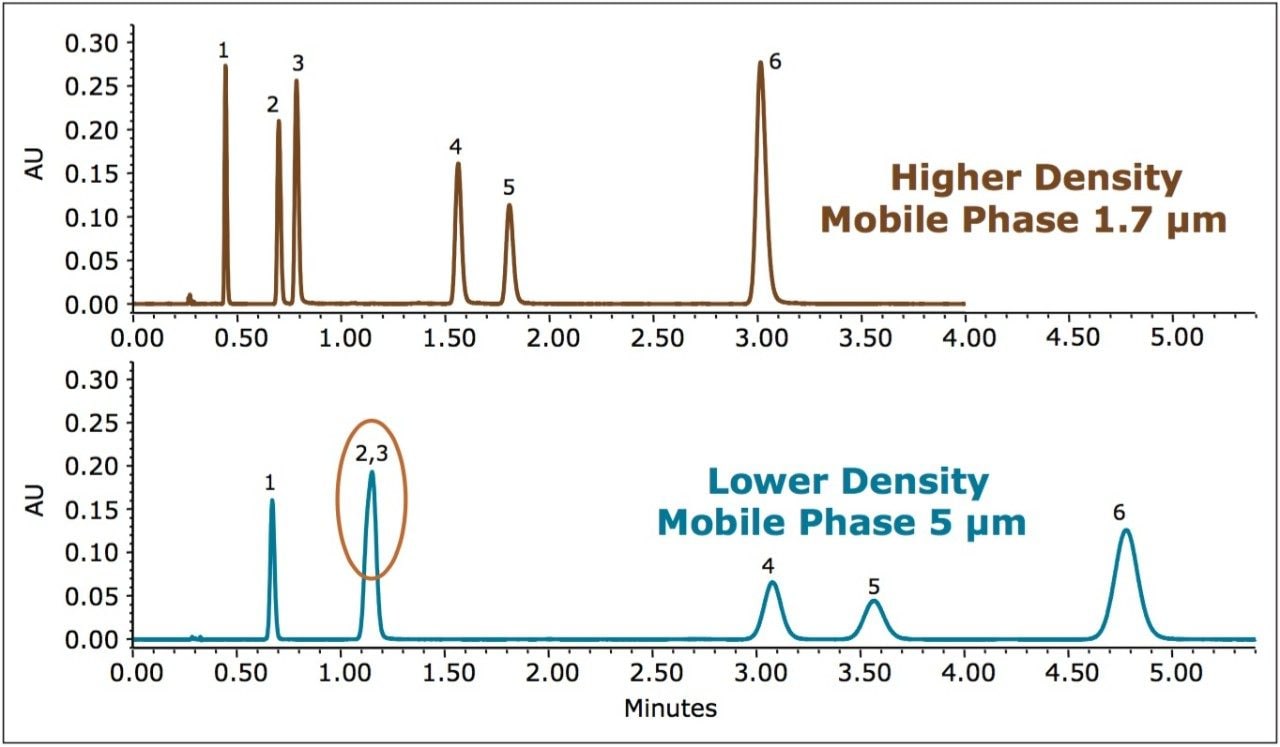
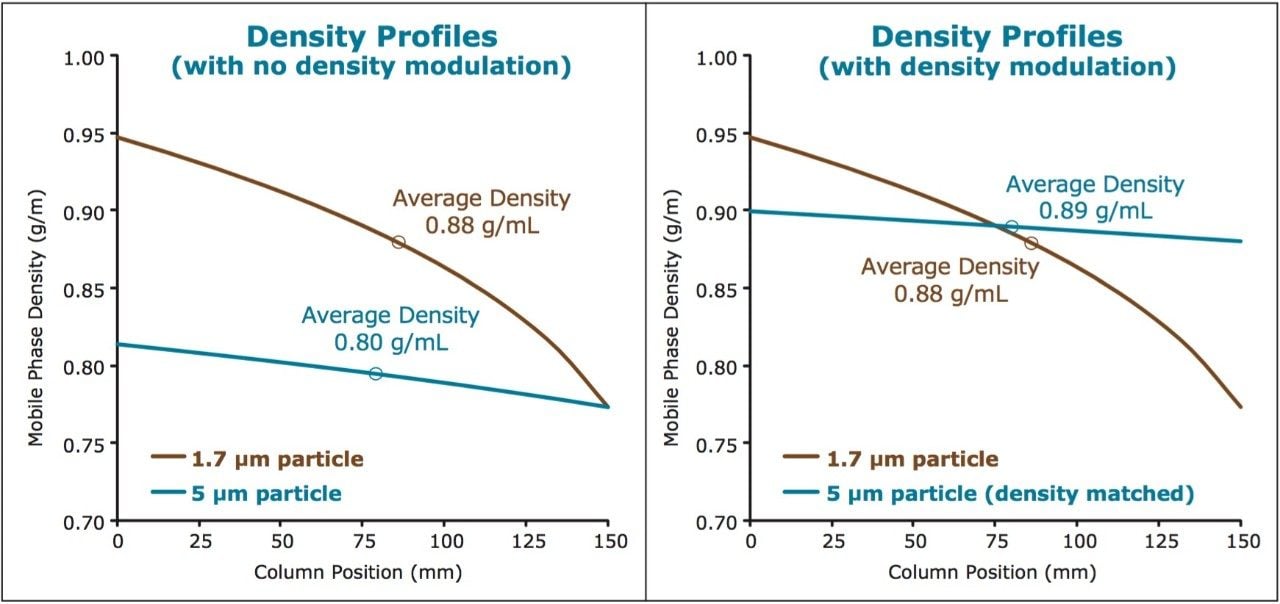
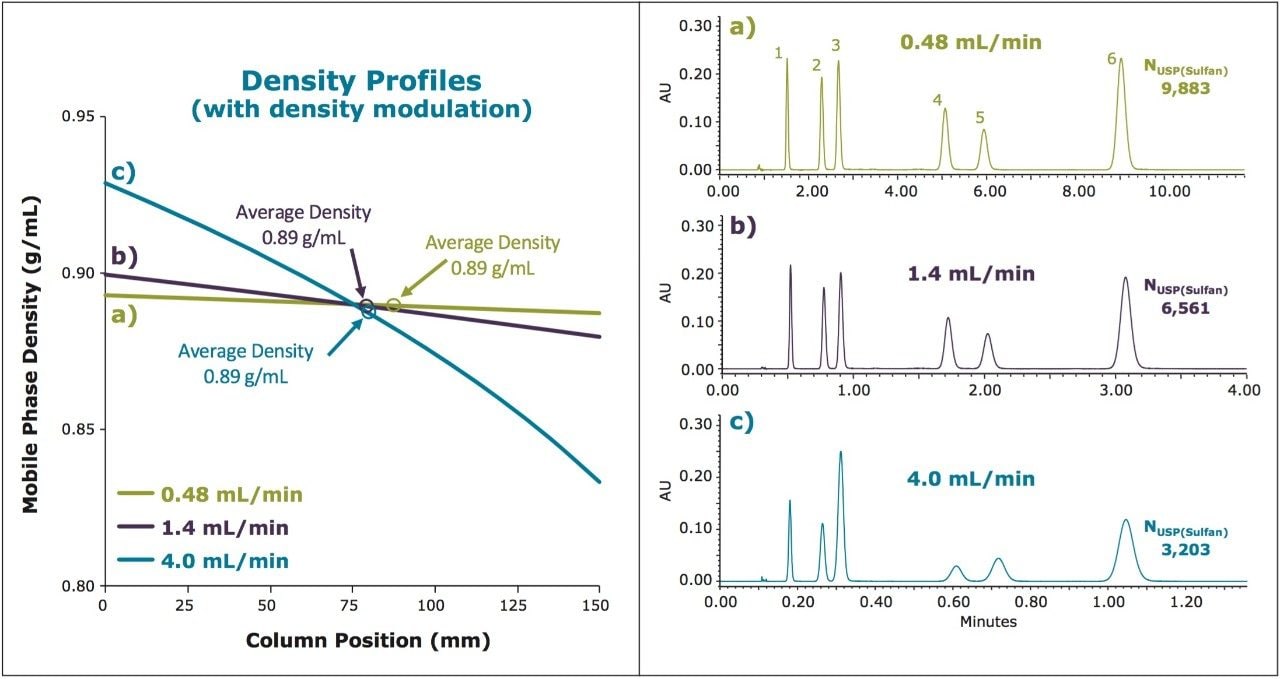
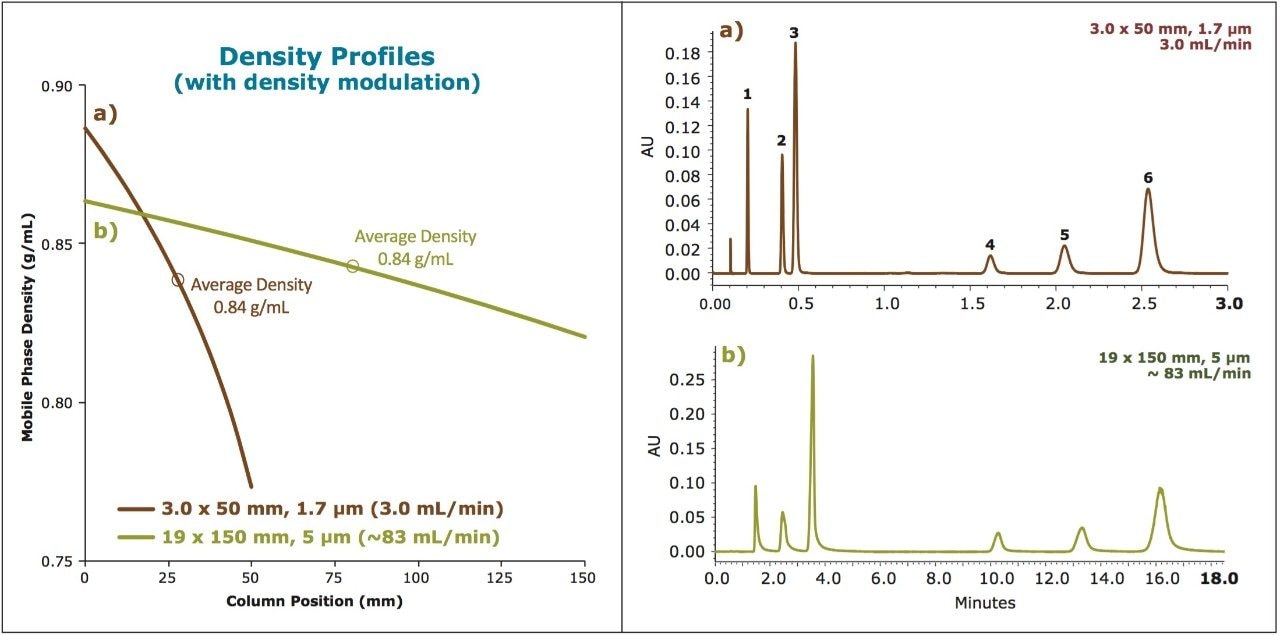
It is well known that for separations using CO2 as the principal mobile phase component, analyte retention factors are influenced largely by the mobile phase density and temperature. Because of the high compressibility of CO2 under standard operating conditions, the density can change significantly with changes in pressure (under isothermal conditions), with retention factors increasing with decreasing mobile phase density (pressure). In addition, the selectivity and resolution of the analytes may be impacted as they respond differently to the same changes in mobile phase density. This can present a challenge when attempting to transfer a method between different column configurations that involve changes in column length or stationary phase particle size, which in turn alters the pressure (density) profile along the column. This is best exemplified when analytical scale separations, developed using UltraPerformance Convergence Chromatography (UPC2) on sub-2-μm stationary phases, are scaled up for preparative SFC conditions using 5 μm particle size stationary phases. The difference in the density profiles across the column, between the analytical and the preparative system, may lead to very different chromatography unless the scale-up procedure is guided by a systematic approach.

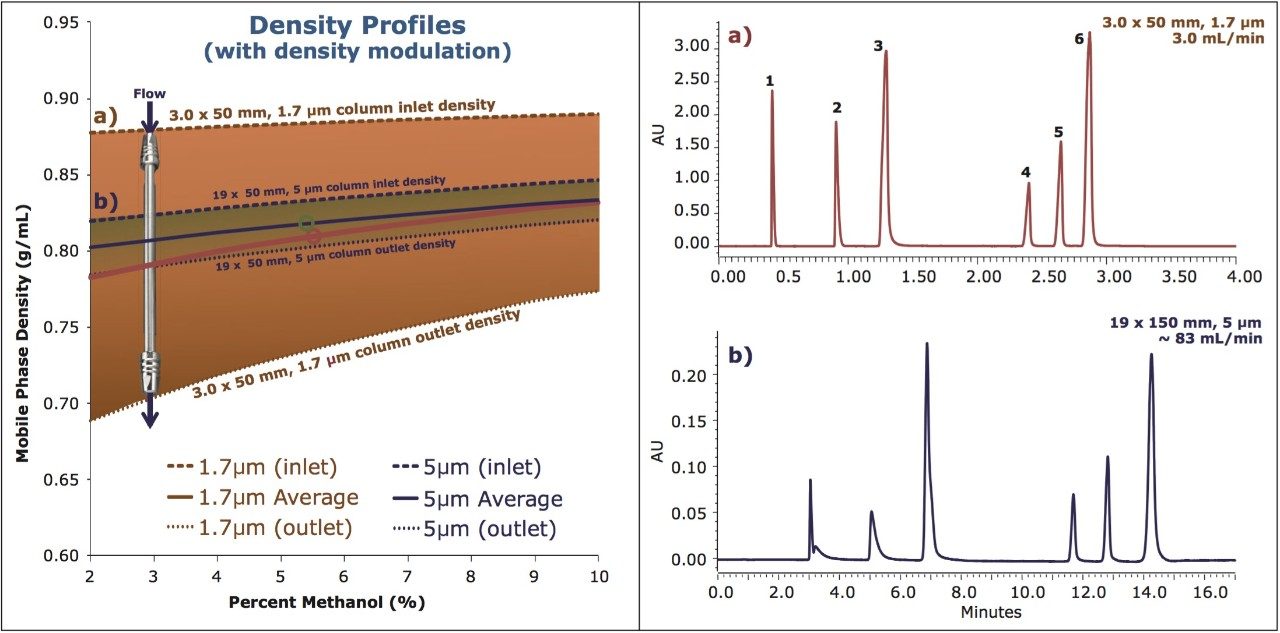
Here we present a strategy for scaling SFC separations between various system, condition, and column configurations by employing density modulation to maintain similar average density profiles between separations. The ability to scale methods efficiently enables the rapid screening of methods on the faster analytical scale (using UPC2), with the direct transfer of the final method to preparative chromatography while maintaining chromatographic integrity between separations. The net result is a scalable, predictable separation with significant savings in time and mobile phase costs (raw materials and disposal of waste).

Experimental

Sample preparation

For development of the scaling strategy, a standard sample mix was prepared with caffeine (1), carbamazepine| (2), uracil (3), hydrocortisone (4), prednisolone (5), and sulfanilamide (6), using methanol as diluent. For the analytical evaluations, the concentration of analytes in the mixture was 0.2 mg/mL each. For preparative scale separations the concentration of analytes was 3.75 mg/mL each. The numbers in parentheses are used in labeling all chromatograms presented in this application note.

UPC2 conditions

System:

ACQUITY UPC2 with PDA Detector

Columns:

ACQUITY UPC2 BEH 2-Ethylpyridine, 1.7 μm, 2.1 x 150 mm column (P/N:186006579);

ACQUITY UPC2 BEH 2-Ethylpyridine, 1.7 μm, 3.0 x 50 mm column (P/N:186006580);

Viridis BEH 2-Ethylpyridine, 5 μm, 2.1 x 150 mm column (P/N:186006545);

Viridis BEH 2-Ethylpyridine OBD Prep, 5 μm, 19 x 150 mm column (P/N:186005764)

Mobile phase A:

CO2 (tank, medical grade)

Mobile phase B:

Methanol

Column temp.:

40 °C

ABPR:

Varied (noted in each figure)

UV detection:

254 nm (compensated 380–480 nm) [40 pts/sec]

Injection volume:

1.5 μL

Strong needle wash:

2-Propanol (IPA)

Weak needle wash:

2-Propanol (IPA)

Seal wash:

2-Propanol (IPA)

Vials:

LCMS Certified Max Recovery Vials (P/N:600000749CV)

Preparative SFC conditions

System:

Waters Prep 100q SFC system with PDA detection

Columns:

Viridis BEH 2-Ethylpyridine OBD Prep, 5 μm, 19 x 150 mm, (P/N:186005764)

Mobile phase A:

CO2 (house CO2 delivery system)

Mobile phase B:

Methanol

Column temp.:

40 °C (unless otherwise noted)

ABPR:

Varied (noted in each figure)

UV detection:

254 nm

Injection volume:

240 μL

Wash solvent:

Methanol

Results and Discussion

It has been well established that mobile phase density plays a predominant role in the retention mechanisms governing analyte retention in SFC. The importance of understanding this behavior for development of a scaling strategy is demonstrated in Figure 1 for the separation of a standard mix on analytical columns of the same chemistry and dimension, with different particle sizes (1.7 μm and 5 μm). While the separation configurations differ only by the stationary phase particle size, the resulting chromatography is significantly different, with changes in selectivity and resolution for the analytes. The difference in retention factors and resolution can be attributed to the higher density mobile phase resulting from the increased pressure (increased resistance to flow) with the smaller 1.7 μm particle size (flow rate and temperature were kept constant). To understand this better, it is necessary to understand the density drop across the column which can be calculated with available chromatographic method and system parameters (e.g., modifier, temperature, pressure).

Isocratic separations of a standard mix
Figure 1. Isocratic separations of a standard mix on the ACQUITY UPC2 BEH 2-EP, 1.7 μm Column (top) and on a Viridis BEH 2-EP, 5 μm Column (bottom). Both separations were performed using a 2.1 x 150 mm column dimension under isocratic conditions with 10% methanol modifier at 1.4 mL/min. The temperature was 40 °C and the Automated Back Pressure Regulator (ABPR) setting was 1500 psi.

Density Simulations

The simulation of the density profiles presented here were conducted based on the assumption that the variation of pressure profile along the column is linear, which is true for most of the experimental operating conditions used in SFC.1,2 The densities of the CO2/methanol mixtures were calculated using the REFPROP software from NIST.3 REFPROP calculates the neat CO2 density following the Span and Wagner equation of state (EOS) and calculates the CO2/MeOH mixture density using the Kunz and Wagner model.4,5 Under typical SFC operating conditions, the errors in the estimation of CO2 density using Span and Wagner EOS range between 0.03 and 0.05% for CO2 pressures up to 4,350 psi and temperatures up to 250.°C.3 For methanol, the errors on the values provided by REFPROP are 1% for the density of the dilute gas and between 0.6 and 3% for that of the liquid at pressures up to 14,500 psi and temperatures between 0 and 70.°C.3 No specific information regarding the estimation of errors made by the Kunz and Wagner mixing rule is available.

For the chromatography shown in Figure 1, the density profile simulations were performed and are shown below in Figure 2 (left). From these simulations, it is clear that the analytes experience different average mobile phase density during the separations. Using density calculations, appropriate chromatographic conditions can be determined to modulate the density profile inside the column in such a way that the analytes experience nearly the same average mobile phase density (Figure 2, right).

Density simulations
Figure 2. Density simulations showing the mobile phase density drop across the 150 mm columns. The left figure represents the calculations for the separations shown in Figure 1 with no density modulation. The figure on the right includes the same calculations for the 1.7 μm particle, but uses density modulation for the 5 μm particle to achieve approximately the same average density for the two separations.

Implementation of the density modulation as shown in Figure 2 (right) yields the chromatography shown below in Figure 3 (bottom chromatogram). Minor chromatographic differences can be attributed to the approach of using density profile averages instead of exact density profiles, which would be difficult, if not impossible, to achieve. Despite the minor differences, the overall chromatographic integrity of the initial separation (top chromatogram) is nearly preserved, with similar retention and resolution obtained on both particle sizes, contrary to the example without density modulation.

Comparison of the original 1.7 μm separation with the separation on the 5 μm particle size column
Figure 3. Comparison of the original 1.7 μm separation (top), from Figure 1, with the separation on the 5 μm particle size column (bottom), with density modulated to approximate the same average density calculated for the 1.7 μm separation. The ABPR settings were 1500 and 3390 psi, respectively.

Variations in Flow Rate

This strategy can be applied more broadly to deal with any system or method alteration that has a direct impact to the density profile of a separation. One example would be an alteration of flow rate. At flow rates faster than the optimum linear velocity, chromatographic efficiency decreases in SFC, similar to what is observed for LC applications. But often times this decrease in efficiency is an acceptable trade-off for the decrease in run time. However, for SFC applications, any alteration in flow rate will alter the pressure, and therefore the density profile of the separation, potentially altering the resulting chromatography. The use of density modulation to match the density profile averages can be used to mitigate chromatographic  changes, as demonstrated in Figure 4.

 Isocratic separations of the standard mix on the Viridis Column
Figure 4. Isocratic separations of the standard mix on the Viridis BEH 2-EP, 5  μm, 2.1 x 150 mm Column under isocratic conditions of 10% methanol at flow rates of 0.48 mL/min (a), 1.4 mL/min (b), and 4.0 mL/min (c). For each separation, the density was modulated so that the mobile phase density profile for each separation had approximately the same average density (0.89 g/mL). The ABPR settings were 3600, 3390, and 2311 psi, respectively.

For the 5 μm SFC particle size, in a 2.1 x 150 mm column configuration, the optimum linear velocity is achieved at a flow rate of approximately 0.48 mL/min (Figure 4a). As the flow rate is increased to 1.4 and 4.0 mL/min (Figures 4b and 4c), the decrease in chromatographic efficiency is obvious, but expected due to the predominant mass transfer term of the van Deemter equation at the faster flow rates. This example demonstrates the utility of this approach to maintain chromatographic selectivity of a separation in the presence of configuration/method alterations that have a direct impact on the density profile of a separation.

Scaling from analytical to preparative conditions

One of the most obvious and beneficial applications of this strategy would be to the scale-up of analytical applications to preparative chromatography. Figure 5 demonstrates the initial separation, developed on the 1.7 μm particle size column, with subsequent transfer to analytical 5 μm and preparative 5 μm columns with density modulation to match the density profile averages. The flow rates for the 5 μm separations were decreased for the lower optimum linear velocity of the larger particle.

Isocratic separations of the standard mix on the ACQUITY UPC2 BEH 2-EP, 1.7 μm Column
Figure 5. Isocratic separations of the standard mix on the ACQUITY UPC2 BEH 2-EP, 1.7 μm Column (a), and on Viridis BEH 2-EP, 5 μm Columns in analytical (b) and preparative (c) configurations. Density modulation was used for the isocratic separations with 10% methanol at flow rates of 1.40 mL/min, 0.48 mL/min, and 83.00 mL/min. The ABPR settings were 1500, 3600, and 3191 psi, respectively.

For the preparative example, a 240 μL injection volume was used with analytes at 3.75 mg/mL each. With approximately 1 mg each on column, the effects of the higher loading can be seen in the chromatography, but selectivity is maintained.

Another common scaling strategy involves maintaining the ratio of column length to particle size (L/dp) between separations. This approach can be used in combination with density modulation as shown below in Figure 6 with the direct transfer of a method from a 3.0 x 50 mm, 1.7 μm column to a preparative 19 x 150 mm, 5 μm column (L/dp ~ 30,000).

Isocratic separations of the standard mix on the ACQUITY UPC2 BEH 2-EP, 1.7 μm Column
Figure 6. Isocratic separations of the standard mix on the ACQUITY UPC2 BEH 2-EP, 1.7 μm Column (a), and on Viridis BEH 2-EP, 5 μm OBD Prep Column (b) configurations. Density modulation was used for the direct scale up from analytical to preparative conditions, using 6% methanol at flow rates of 3 mL/min and 83 mL/min. The ABPR settings were 1500, 3600, and 3191 psi, respectively.

Gradient Methods

For the previous isocratic examples, although the density varied across the column, the variation was static because the composition of the mobile phase did not change. For gradient methods, the situation is more complicated because the density not only varies along the column, but also changes with time. The increasing modifier concentration during the gradient results in increases in mobile phase viscosity and therefore pressure, which in turn impacts the mobile phase density profile. For gradient separations, the density modulation strategy should consider the changing density profile as the modifier transitions from lower to higher concentrations. Figure 7 (left) shows the results from density simulations at the column inlet and outlet for both the analytical and preparative configurations. For the preparative configuration, the density was modulated to yield approximately the same average density profile as for the analytical configuration. As in the previous isocratic examples, density modulation under gradient conditions yields similar chromatography for the analytical and preparative separations, with similar resolution and selectivity for the individual compounds. Differences observed between the two examples can be attributed to differences in system dwell volume or injection mode (modifier stream vs. mixed stream injection), neither of which were considered for these experiments.

Gradient separations of the standard mix on the ACQUITY UPC2 BEH 2-EP, 1.7 μm Column
Figure 7. Gradient separations of the standard mix on the ACQUITY UPC2 BEH 2-EP, 1.7 μm Column (a), and on Viridis BEH 2-EP, 5 μm OBD Prep Column (b) configurations. Density modulation was used for the direct scale up from analytical to preparative conditions, using a gradient from 2-10% methanol at flow rates of 3 mL/min and 83 mL/min. The gradient times (3.0 minutes and 13.5 minutes) were scaled to yield the same number of column volumes for each gradient separation. The ABPR settings were 1500 and 2103 psi, respectively.

Conclusion

The application of a systematic approach using density modulation facilitates the efficient transfer of SFC methods between different column configurations (length and/or particle size). In addition, this approach provides more flexibility in manipulating method conditions to explore broader flow rate regimes while maintaining chromatographic integrity. With application to both isocratic and gradient methods, this methodology is suitable for both chiral and achiral separations. This is especially pertinent for chiral method development in which multiple chiral columns may be screened against multiple modifier combinations using analytical configurations in a very short period of time. The resulting method can then be scaled up efficiently for preparative purifications, yielding predictable, reproducible chromatography. The ability to perform method development on the analytical scale before scaling directly to preparative chromatography represents a substantial savings in time and resources.

References

  1. A. Tarafder, K. Kaczmarski, M. Ranger, D. Poe, and G. Guiochon, J. Chrom. A, 1238:132-145, 2012.
  2. 2. A. Tarafder, K. Kaczmarski, D. Poe, and G. Guiochon, J. Chrom. A, 1258:136-151, 2012.
  3. 3. E.W. Lemmon, M. Huber, M.O. McLinden, D.G. Friend, National Institute of Standards and Technology, Standard Reference Data Program, Gaithersburg 9.1.
  4. 4. R. Span, W. Wagner, J. Phys. Chem. Ref. Data, 25(6):1509-1596, 1996.
  5. 5. O. Kunz, W. Wagner, J. Chem. Eng. Data, 57(11):3032-3091, 2012.

720004818, October 2013

Back To Top Back To Top