• Application Note

ACQUITY UPLC for the Rapid Analysis of Anthocyanidins in Berries

ACQUITY UPLC for the Rapid Analysis of Anthocyanidins in Berries

  • Matthew Hynes
  • Andrew J. Aubin
  • Waters Corporation
Berries on wooden table

Abstract

This application note demonstrates UPLC method for the rapid analysis of anthocyanidins in berries.

Introduction

Anthocyanins are plant pigments that provide vibrant blues and reds in fruits, fruit juices, wine, and vegetables. Konczak et al. has reported that anthocyanins are rich in antioxidant compounds and provide great health benefits to the consumer.1

There are reports of more than 600 anthocyanins identified in food samples, including berries, thus making direct analysis of these compounds very challenging. However, the analysis of these compounds can be simplified by converting them into their aglycon form (anthocyanidin) by performing an acid hydrolysis on the sample.

Acid hydrolysis will convert any of the 600+ anthocyanins into one of the six common anthocyanidins: delphinidin, cyanidin, petunidin, pelargonidin, peonidin, and malvidin. Estimation of the relative abundance of anthocyanins through the analysis of anthocyanidins then becomes a simpler task.

Previously, methods for analyzing anthocyanidins have been shown to take anywhere from 34 minutes on a SuperPac Pep-S RP C18 Column (4 x 250 mm, 5 μm), to 55 minutes on a C18 Inertsil ODS-3 Column (4.0 x 150 mm, 3 μm).2,3

A breakthrough method developed on the Waters ACQUITY UPLC System completes this analysis in just 2.1 minutes with an ACQUITY UPLC BEH C18 Column (2.1 x 50 mm, 1.7 μm) – 16 to 26 times faster than the above-described HPLC methods, respectively – while still maintaining baseline resolution of all six anthocyanidins (Figure 1).

UPLC separation of the six anthocyanidins.

Experimental

Materials

A variety of fresh, frozen, and dried berry samples were purchased from a local store. All samples were then stored in a freezer. Anthocyanidin standards were purchased from ChromaDex (Santa Ana, CA). Hydrochloric Acid Gold, Phosphoric Acid, and Acetonitrile Optima were purchased from Fisher Scientific (Agawam, MA). Water was purified with a MilliQ system (Millipore, Billerica, MA).

UPLC Conditions

The ACQUITY UPLC System consisted of the ACQUITY UPLC Binary Solvent Manager (BSM), the ACQUITY UPLC Sample Manger (SM) fitted with a 10 μL loop, and the ACQUITY UPLC Tunable UV (TUV) Detector. The system was controlled and data was collected and analyzed using Empower 2 Software.

Separations were performed on a 2.1 x 50 mm, 1.7 μm ACQUITY UPLC BEH C18 Column at a flow rate of 1.00 mL/minute. Column temperature was set at 40 °C and injection volumes for all samples and standards were 2 μL.

Water/Acetonitrile (95:5) was used as the weak wash solvent and a mixture of Acetonitrile/Isopropyl Alcohol/Water (7:2:1) was used as the strong wash solvent. Mobile phase components and gradient conditions are outlined in Table 1.

Gradient separation conditions.

Detection was set at 525 nm, which is common to all anthocyanidins, using a sampling rate of 20 points per second and a filtering constant of 0.1 seconds.

Calibration

A standard solution of cyanidin, petunidin, pelargonidin, and peonidin (0.100 mg/mL) was prepared from crystalline material in methanol. A seven-point standard curve was created from 0.100 mg/mL to 0.001 mg/mL.

A second standard solution was created for delphinidin from a pre-dissolved purchased sample, as the crystalline material was not available. The concentrations of delphinidin were the same as those of the previously mentioned standard solution.

A third standard solution for malvidin (0.300 mg/mL) was prepared from crystalline material in methanol. A five-point standard curve was created covering a range of 0.300 mg/mL to 0.001 mg/mL. Calibration curves were created for each standard and fit to linear equations with R2 values shown in Table 2. A UPLC chromatogram of all six anthocyanidin standards is shown in Figure 1.

R2 values for the standard calibration curves.

Sample Preparation Extraction Procedure:

Anthocyanidins were extracted from the samples by weighing out 25 0.3 g of berries into a weighing boat. The berries were then transferred into a 100 mL graduated cylinder and 30 mL of extraction solution (80/20 acetonitrile/0.3% phosphoric acid in water) was added. The berries were then homogenized using a Janke & Kunkel homogenizer for 1.5 minutes. This duration ensured that all 25 grams of sample would be completely homogenized. The homogenized liquid was then transferred into a graduated centrifuge tube. The graduated centrifuge tube was centrifuged for 10 minutes at 2,500 rpm.

Hydrolysis Procedure

A 2 mL aliquot of the supernatant was pipetted into a 4 mL vial along with 200 μL of concentrated hydrochloric acid. The vial was then capped with a cap that contained a self-sealing septum to minimize loss of liquid to evaporation during hydrolysis. The vial was then placed on a vortex mixer for 5 seconds, and then placed into a chemical oven at 150 ± 2 °C for 30 minutes.

After 30 minutes, the vial was removed and placed into a freezer for 10 minutes at 0 °C to stop the hydrolysis. Samples were removed from the freezer and allowed to come to room temperature. Once the vial reached room temperature, the berry sample was filtered through a 0.45 μm filter into a 2 mL vial. The vial was capped and then analyzed by the ACQUITY UPLC System.

Results and Discussion

Area counts from injections of hydrolyzed berry extracts, Figures 3 to 8, were compared to the standard calibration curves, and the amounts (mg/mL) of each component were calculated using Empower 2 Software. These amounts were then used to back-calculate to the original concentration of anthocyanidins in the berries as dry weight, Tables 3 and 4. Dry weight was determined by taking a representative sample of each berry (~15 g), accurately weighing it, and then placing it into a chemical oven at 40 °C overnight to remove the water content. The change in weight was considered to be the water content of the berry.

Comparison of total anthocyanidin content in berry samples.
UPLC separation of low-bush blueberries.
UPLC separation of wild low-bush blueberries.
UPLC separation of frozen blackberries.
UPLC separation of frozen raspberries.
UPLC separation of frozen strawberries
UPLC separation of frozen cranberries.
Quantitative comparison of blueberry samples.
Quantitative comparison of other berry samples.

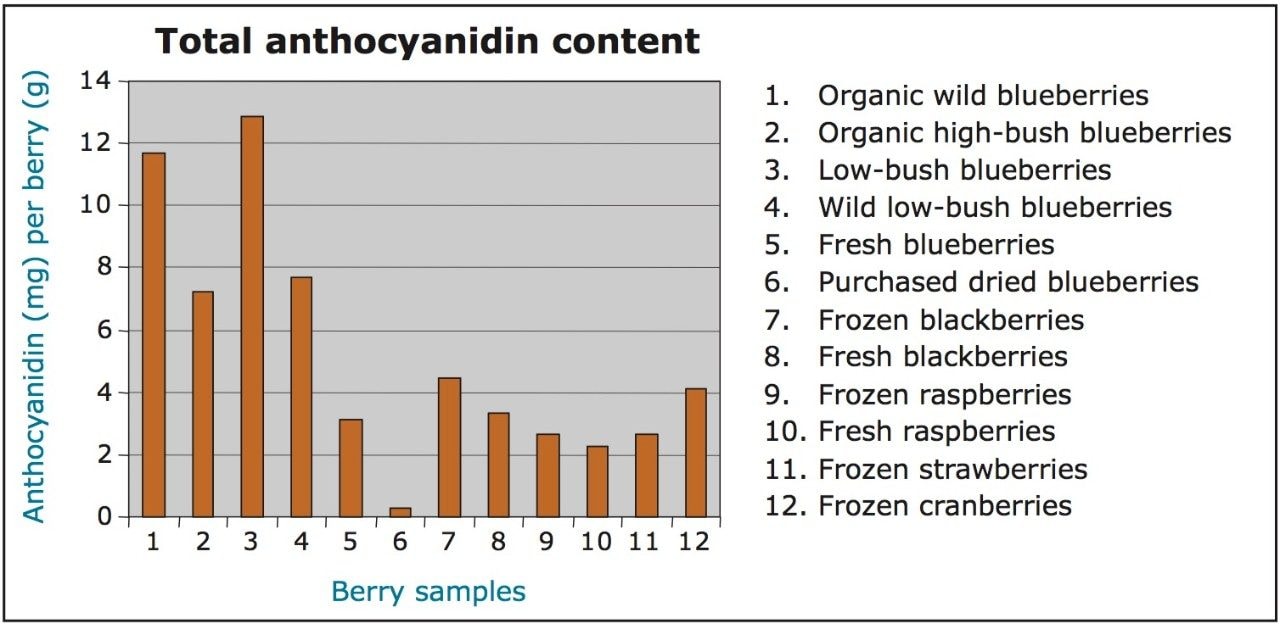
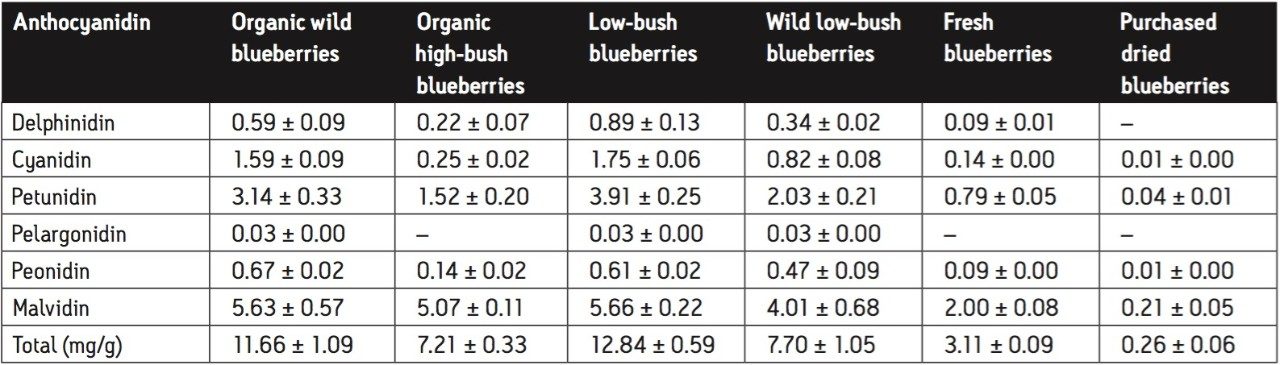
The results for this experiment were consistent with those of Wu et al.4 As shown in Figure 2, low-bush blueberries contained the highest total concentration (12.84 ± 0.59 mg/g) of anthocyanidins per gram of dry berry, while purchased dried blueberries contained the lowest (0.26 ± 0.06 mg/g).

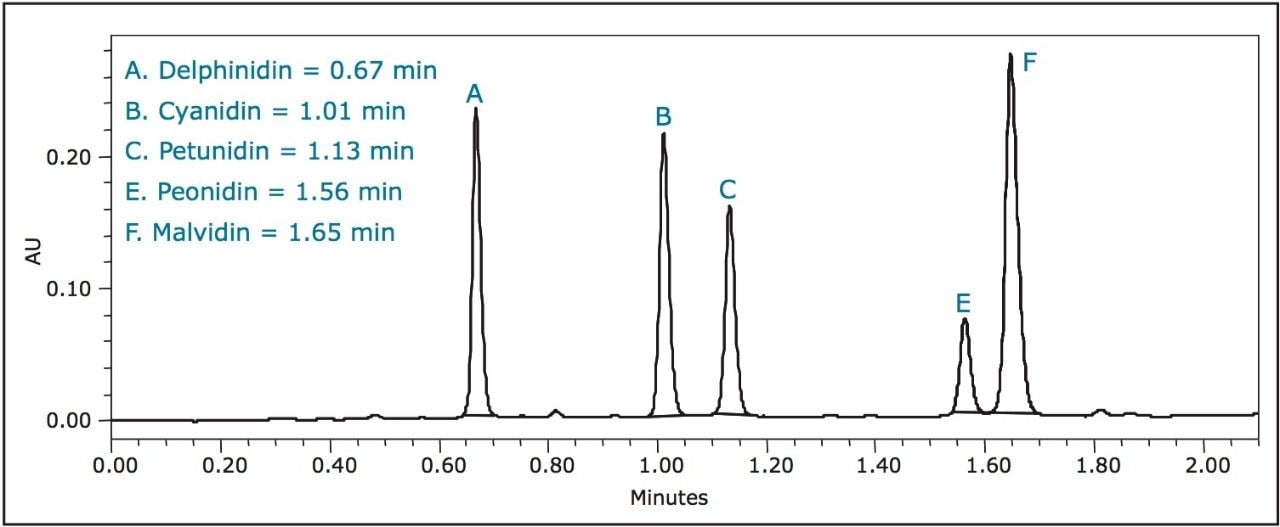
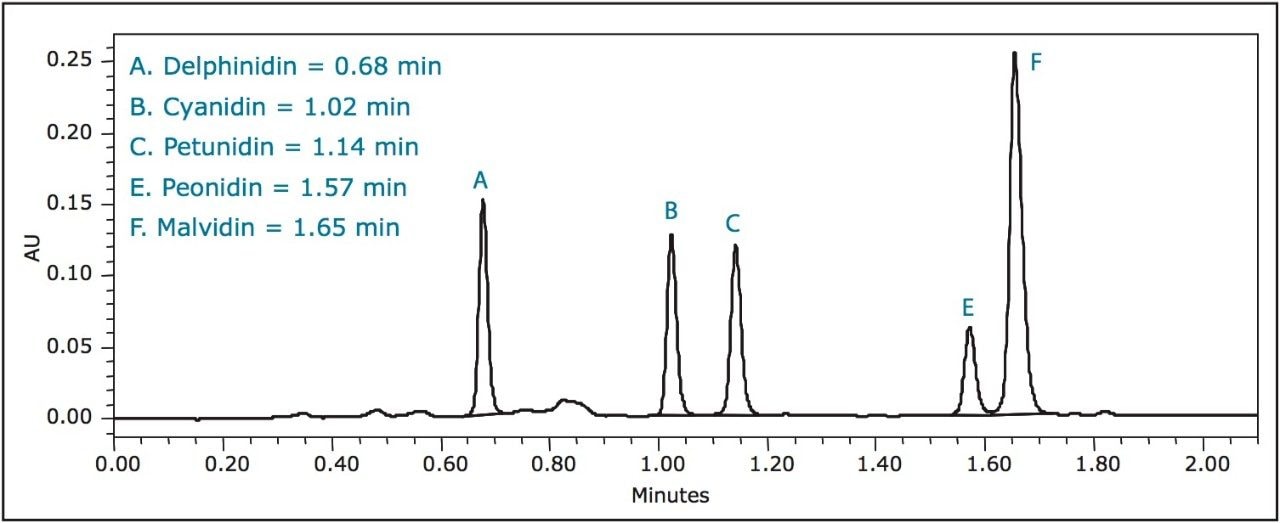
Tables 3 and 4 outline the concentration of each anthocyanidin and the total anthocyanidin concentration for each berry sample tested. Each berry sample was tested in triplicate. The results reported in Table 3 and 4 are the mean of the three trials with standard deviations.

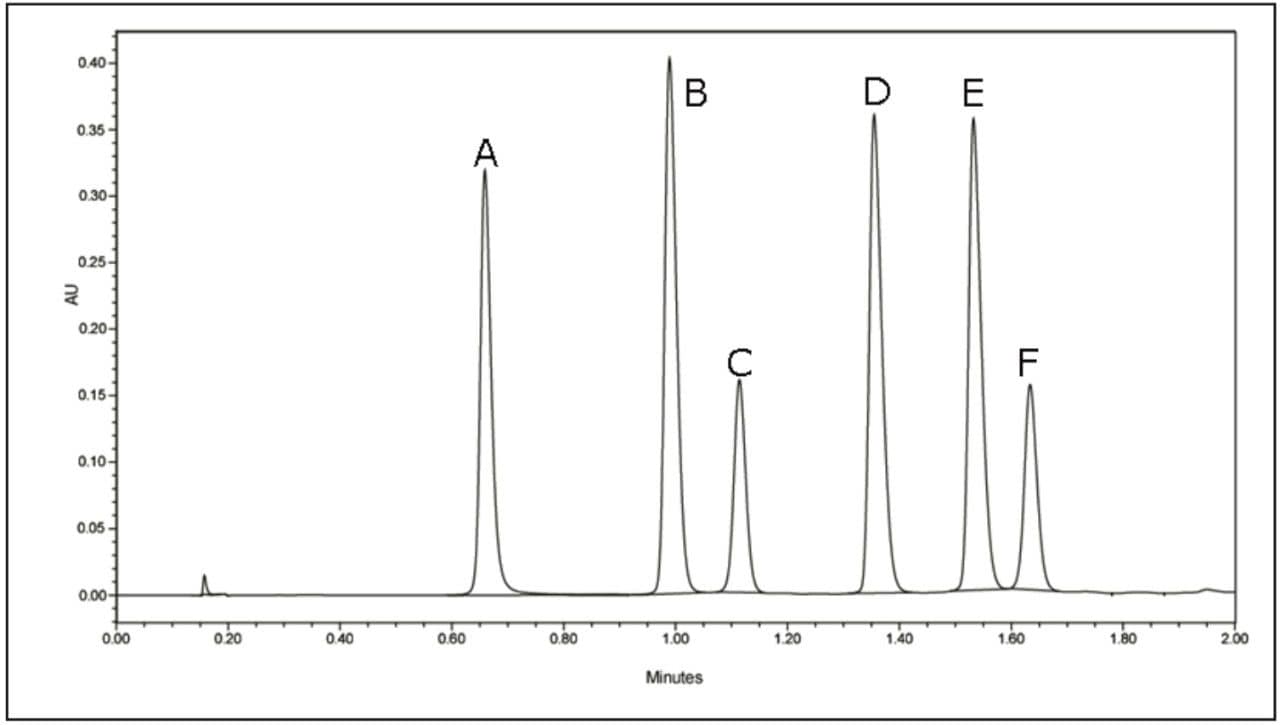
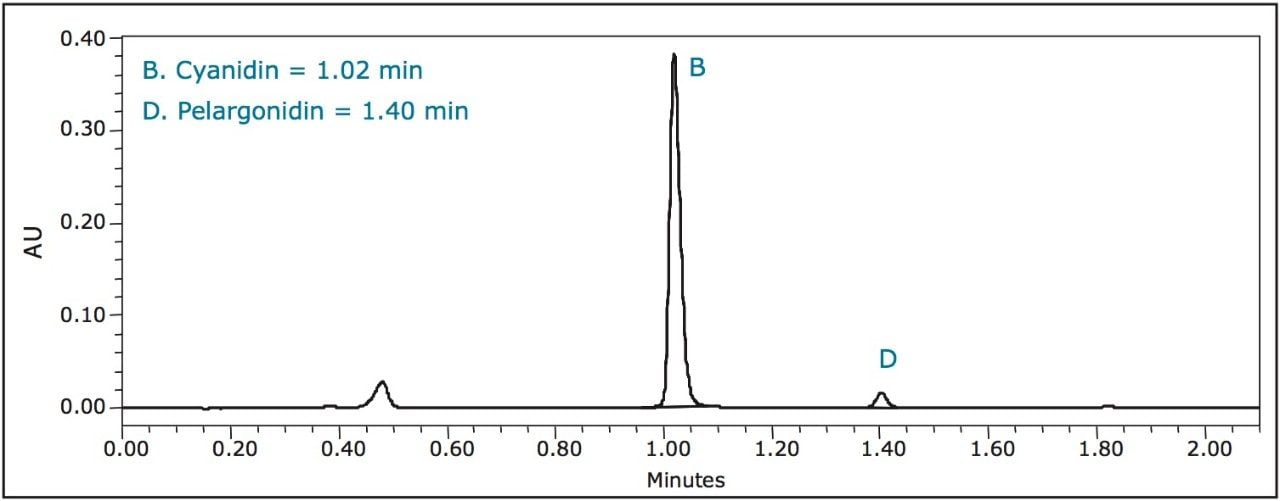
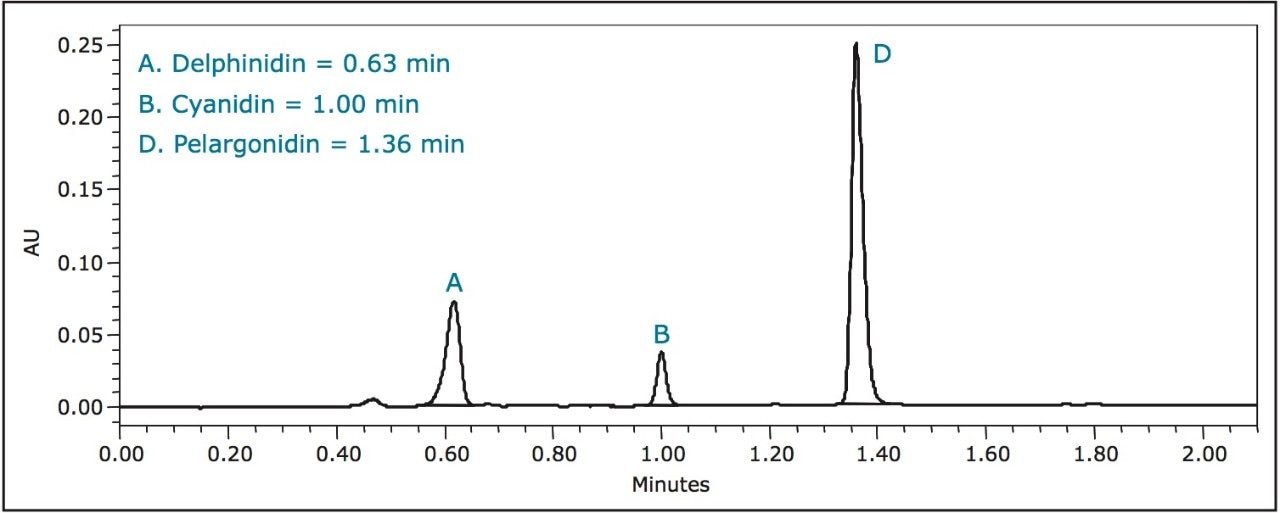
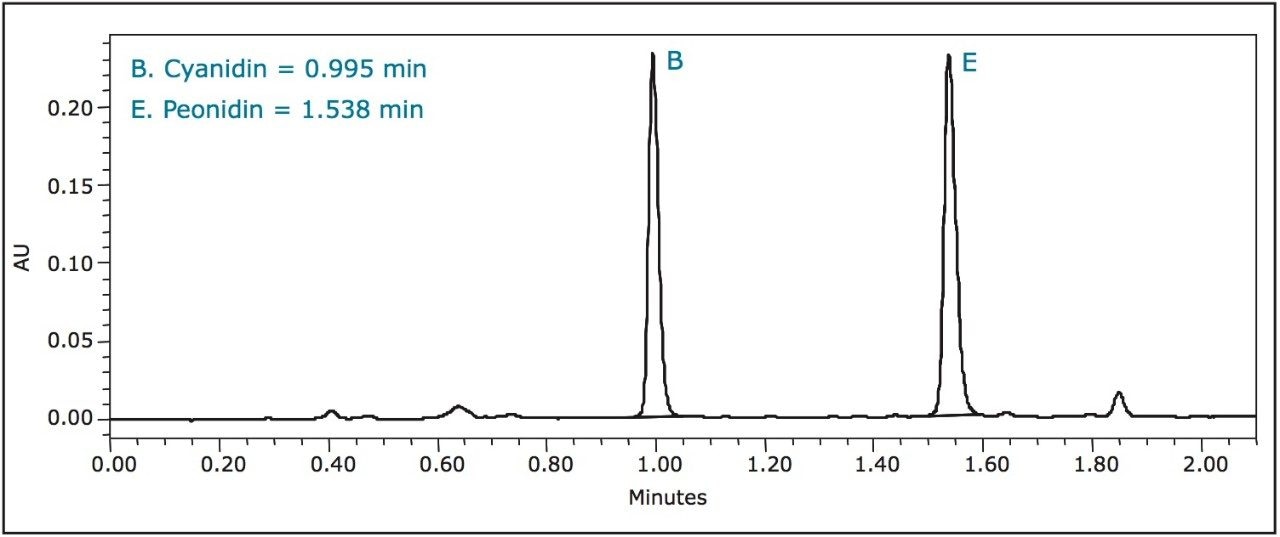
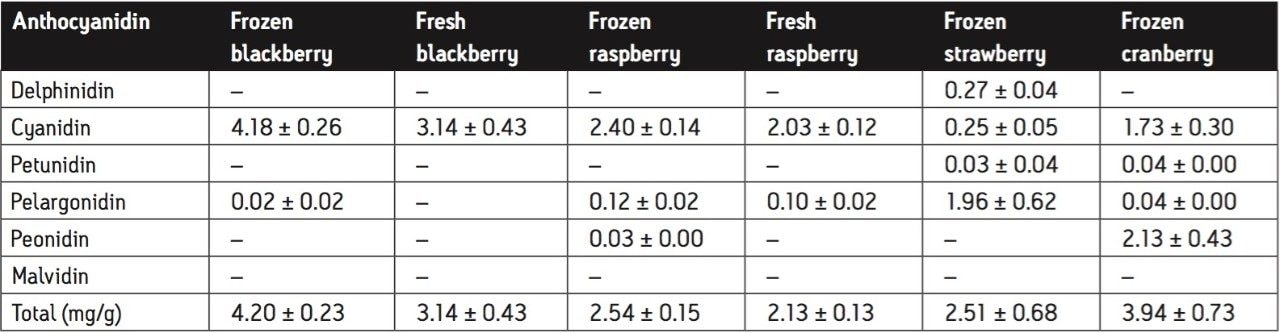
Blueberries contain the highest concentration of anthocyanidin, as can be seen in Figures 3 to 8. Blueberries contain either five or all six anthocyanidins, while other berries contain anywhere from one to four. Notably, each berry contained one of the six anthocyanidins in a much higher concentration than the rest of the berries. In the case of blueberries, malvidin is present at almost twice the concentration of any other anthocyanidin. In addition, blueberries were the only berry to contain malvidin.

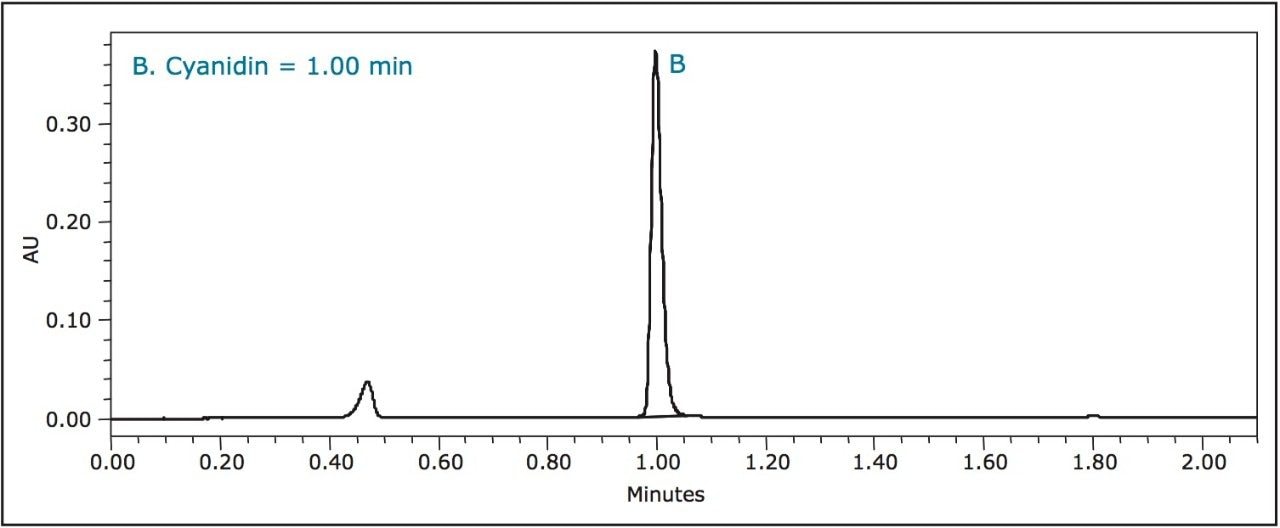
Fresh blackberries contained primarily cyanidin, while frozen blackberries contained both cyanidin and a slight trace of pelargonidin. Cyanidin in blackberries was two to three times higher than in any other berry.

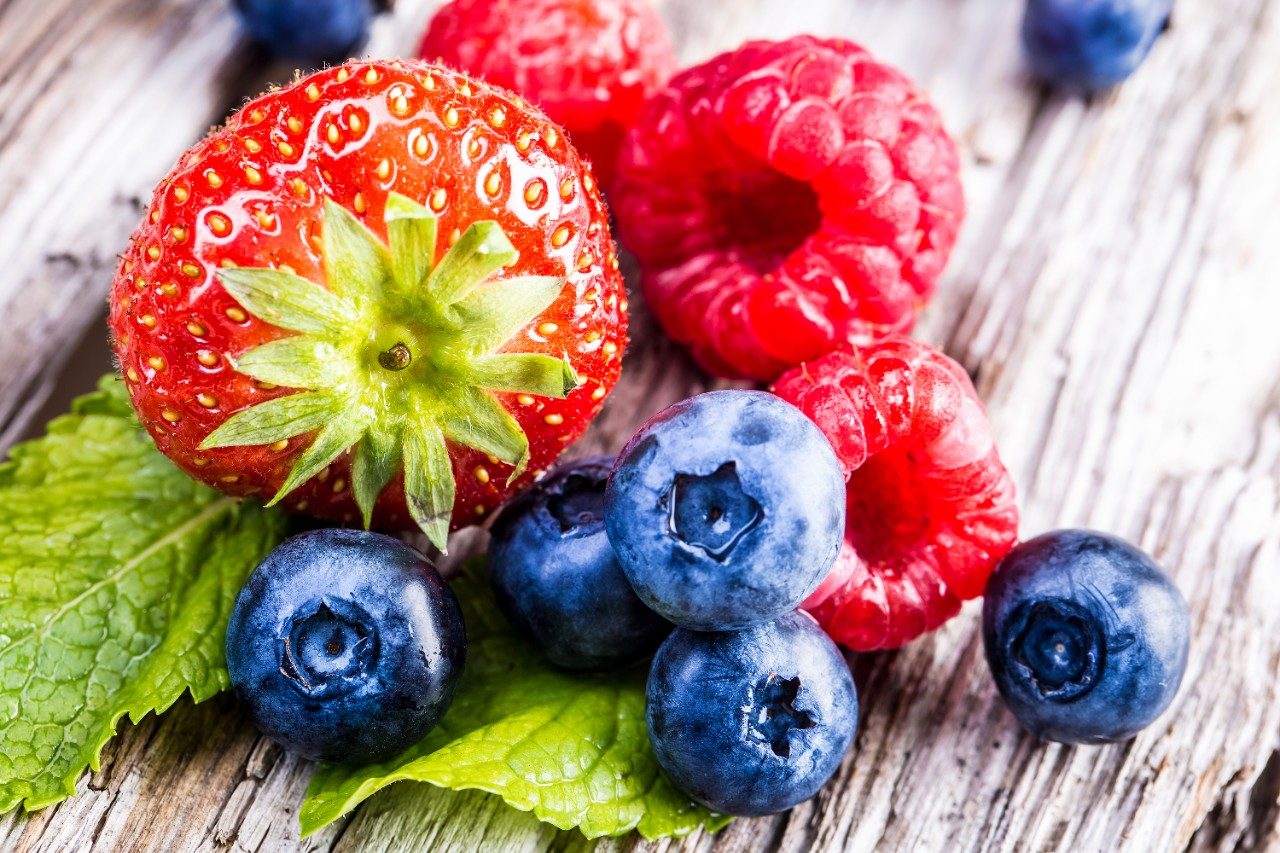
Strawberries gave a distinct pelargonidin peak, while other berries only contained trace amounts of it.

The concentration of peonidin in cranberries was three to four times higher than in blueberries, while most other berries contained no peonidin at all.

Cyanidin was the major anthocyanidin in raspberries, but was contained at concentrations approximately half of those found in blackberries.

Even though these differences gave each berry a unique chromatogram, cyanidin was one common anthocyanidin present in each berry sample.

Each berry tested contained one of the six anthocyanidins at a higher concentration than the rest of the berries. However, blueberries had the highest total anthocyanidin content compared to the other berries. Among the blueberries tested, low-bush blueberries contained the highest concentrations of total anthocyanidins per gram of dry berry. Following blueberries, blackberries contain the highest concentrations, followed by cranberries, raspberries, and strawberries, respectively.

Conclusion

The ACQUITY UPLC System combined with ACQUITY UPLC BEH Column technology provides rapid analysis of anthocyanidins and baseline resolution of each of the six standard anthocyanidin components. The ability to dramatically decrease analysis times while maintaining resolution creates more efficient and productive laboratories. UPLC technology, when applied to the burgeoning field of natural products research, opens possibilities for more rapid and extensive analysis of natural compounds than ever before.

References

  1. Konczak I, Wei Z. J. Biomed Biotechnol. 2004; (5): 239–240.
  2. Nyman N.A., Kumpulainen J. J. Agric. Food Chem. 2001; 49 (9): 4183–87.
  3. Gao L., Mazza G. J. Agric. Food Chem. 1994; 42: 118–25.
  4. Wu X. et al. J. Agric. Food Chem. 2004; 52: 4026–37.

720001870, June 2008

Back To Top Back To Top