Identification and Quantitation of N-Nitrosamines in Normal Saline Intravenous Infusion bags Using UHPLC-MS/MS
Marian Twohig
Waters Corporation, United States
Published on May 08, 2026
Abstract
N-nitrosamines (nitrosamines) have been a major pharmaceutical safety concern since 2018, beginning with small molecule dialkyl nitrosamines such as N-Nitrosodimethylamine (NDMA) and N-Nitrosodiethylamine (NDEA) and later expanding to include NDSRIs. Regulatory guidance has evolved accordingly.
In 2025, the U.S. FDA’s Center for Drug Evaluation and Research (CDER) reported an emerging issue: N-nitrosodibutylamine (NDBA) was detected in drug products packaged in intravenous (IV) infusion bags, potentially originating from bag materials or external packaging. The FDA communication describes an ongoing investigation into possible sources of leachable nitrosamines and recommends that manufacturers assess and, where appropriate, test affected products using suitably sensitive analytical methods. IV bags represent a sterile parenteral dosage form often packaged with flexible medical grade containers. Although infusion bags represent less than lifetime exposure, potential prolonged treatments are possible with certain medical conditions.
This work presents an approach for quantifying small molecule dialkyl nitrosamines in IV infusion bags containing normal saline using UHPLC combined with atmospheric pressure chemical ionization detection (APCI) and a Xevo™ TQ Absolute XR Mass Spectrometer (MS). The method achieved low pg/mL quantitation detection limits, with method development, data processing and review managed through waters_connect™ Software.
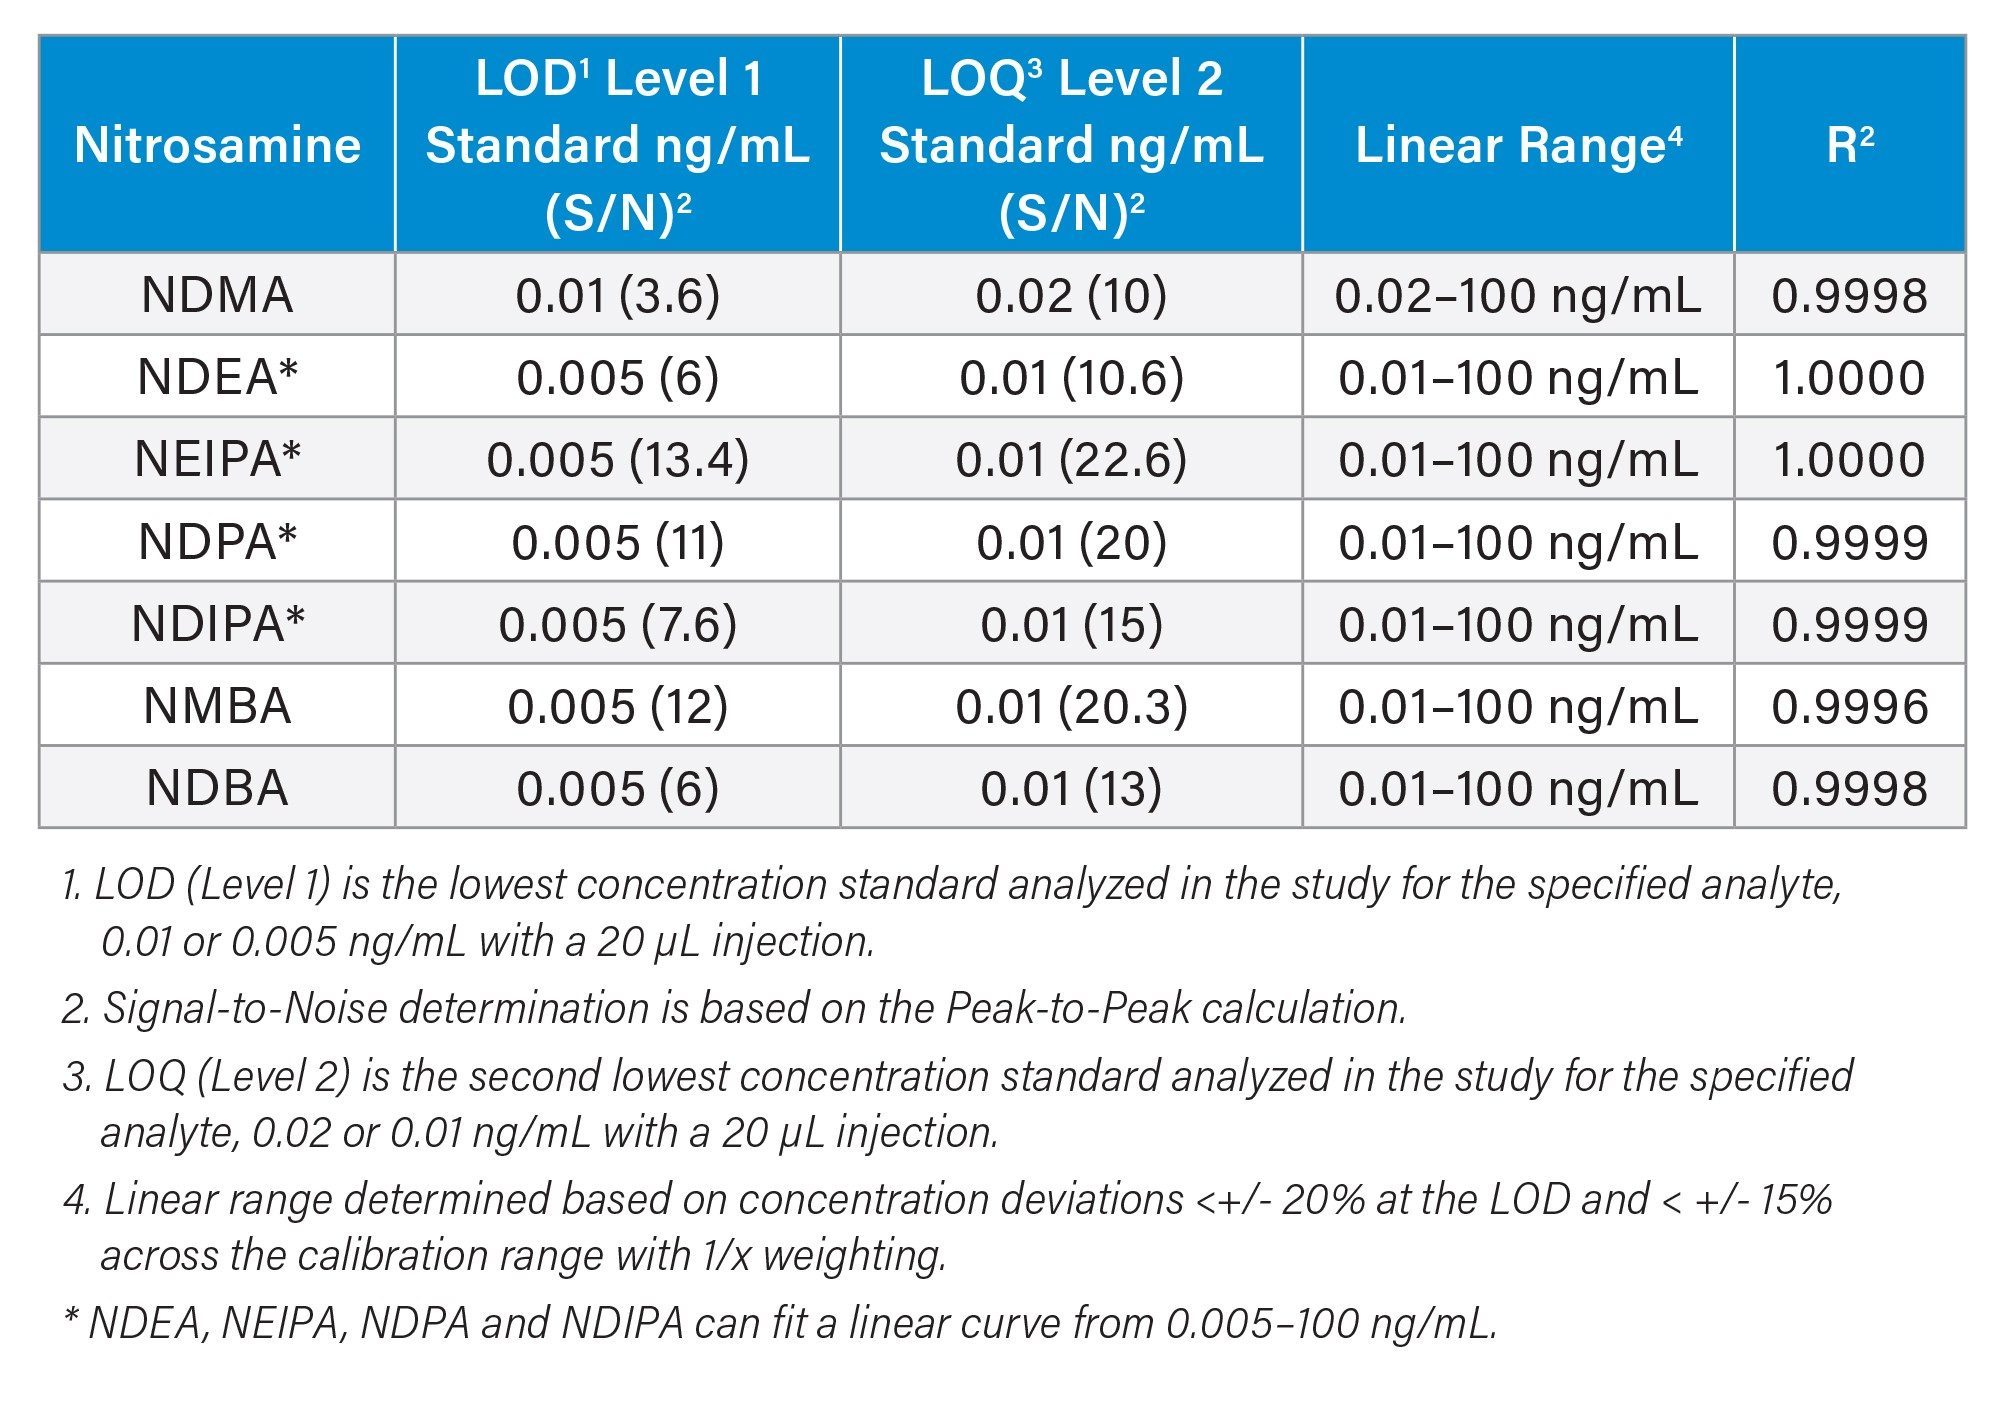
The methodology demonstrated linear calibration curves for seven nitrosamines over the range test, from 0.01 or 0.02–100 ng/mL with R2 values > 0.99 using 1/x weighting. Quality control samples, prepared in matrix (n=6) at four concentration levels from 0.075–75 ng/mL were measured against the matrix curve. The mean accuracies for QCs were between 88–110% with CVs between 0.033–5.5%.
Benefits
- Trace level detection of nitrosamines using the Xevo TQ Absolute XR Mass Spectrometer in MRM acquisition mode.
- Retention and chromatographic resolution of seven nitrosamine impurities including isobaric NDPA and NDIPA (m/z 130) using the ACQUITY™ Premier HSS T3 Column and the ACQUITY™ Premier UPLC™ System.
- The use of a delay column to assist in persistent interference in the MRM transitions of NDBA.
- Increased confidence in the identification of N-nitrosamines in IV bags using MRM ion ratio flags.
- Targeted MS/MS allows spectral information to be derived from unknown components.
- waters_connect Quantitation Software offers compliant-ready workflows for the acquisition, processing, review, and reporting of quantitative data for N-nitrosamines.
Introduction
Since 2018, considerable attention has been directed toward the potential health risks posed by N-nitrosamines (nitrosamines) detected as impurities in pharmaceuticals.1–4 Nitrosamines are impurities that have been identified by regulatory authorities as requiring risk‑based assessment and control within pharmaceutical products.2 Initially, the focus was on the small molecule nitrosamines including NDMA and NDEA. The scope of the studies expanded to Nitrosamine Drug Substance Related Impurities (NDSRIs) which share structural features with the drug substance itself.4–5 Regulatory guidance for assessing drug products for nitrosamine impurities was first issued in 2020 and has been revised multiple times as scientific understanding has advanced.6–8
In August of 2025, CDER made an announcement detailing an emerging issue: NDBA, a small molecule nitrosamine impurity, had been detected in certain drug products packaged in intravenous (IV) infusion bags.9 Infusion bags represent a sterile parenteral dosage form often packaged with flexible medical grade containers. In its August 2025 Emerging Scientific and Technical Information notice, CDER stated that it is investigating the presence of NDBA and other small‑molecule nitrosamines in certain drug products packaged in IV infusion bags and has requested additional data to better understand potential sources and scope.10 In a previous study, Golob et al. reported the discovery of NDMA and NDEA in a finished drug product, but not in the bulk drug substance, prompting investigation of the packaging. The study revealed that nitrocellulose used as a primer in lidding foil can act as a nitrosating agent, reacting with secondary amines in printing inks to form N-nitrosamines, which can potentially contaminate the drug product.11
An Acceptable Intake (AI) limit, as defined in ICH M7(R2), is a health-based intake derived from conservative quantitative risk assessment. It corresponds to an estimated excess lifetime cancer risk of one additional case per 100,000 individuals, assuming daily exposure to a mutagenic impurity in drug substances or drug products over a lifetime.8
Compound-specific AI limits for nitrosamines have subsequently been established and refined through successive regulatory evaluations and guidance updates, incorporating compound specific toxicological data, structure–activity relationships, read across approaches, and evolving scientific understanding.6–8,12,13 IV infusion bags are typically associated with less‑than‑lifetime exposure, although some therapeutic applications may involve extended or repeated administration.8,9
This study describes analytical methodologies that facilitate the analysis of small dialkyl nitrosamines in normal saline (0.9% NaCl) IV infusion bags. Ultra high-performance liquid chromatography (UHPLC™) and a Xevo TQ Absolute XR Mass Spectrometer (MS) in positive ion APCI mode were used to deliver low pg/mL levels of quantitation. The MS data was acquired and managed using waters_connect Software.
Experimental
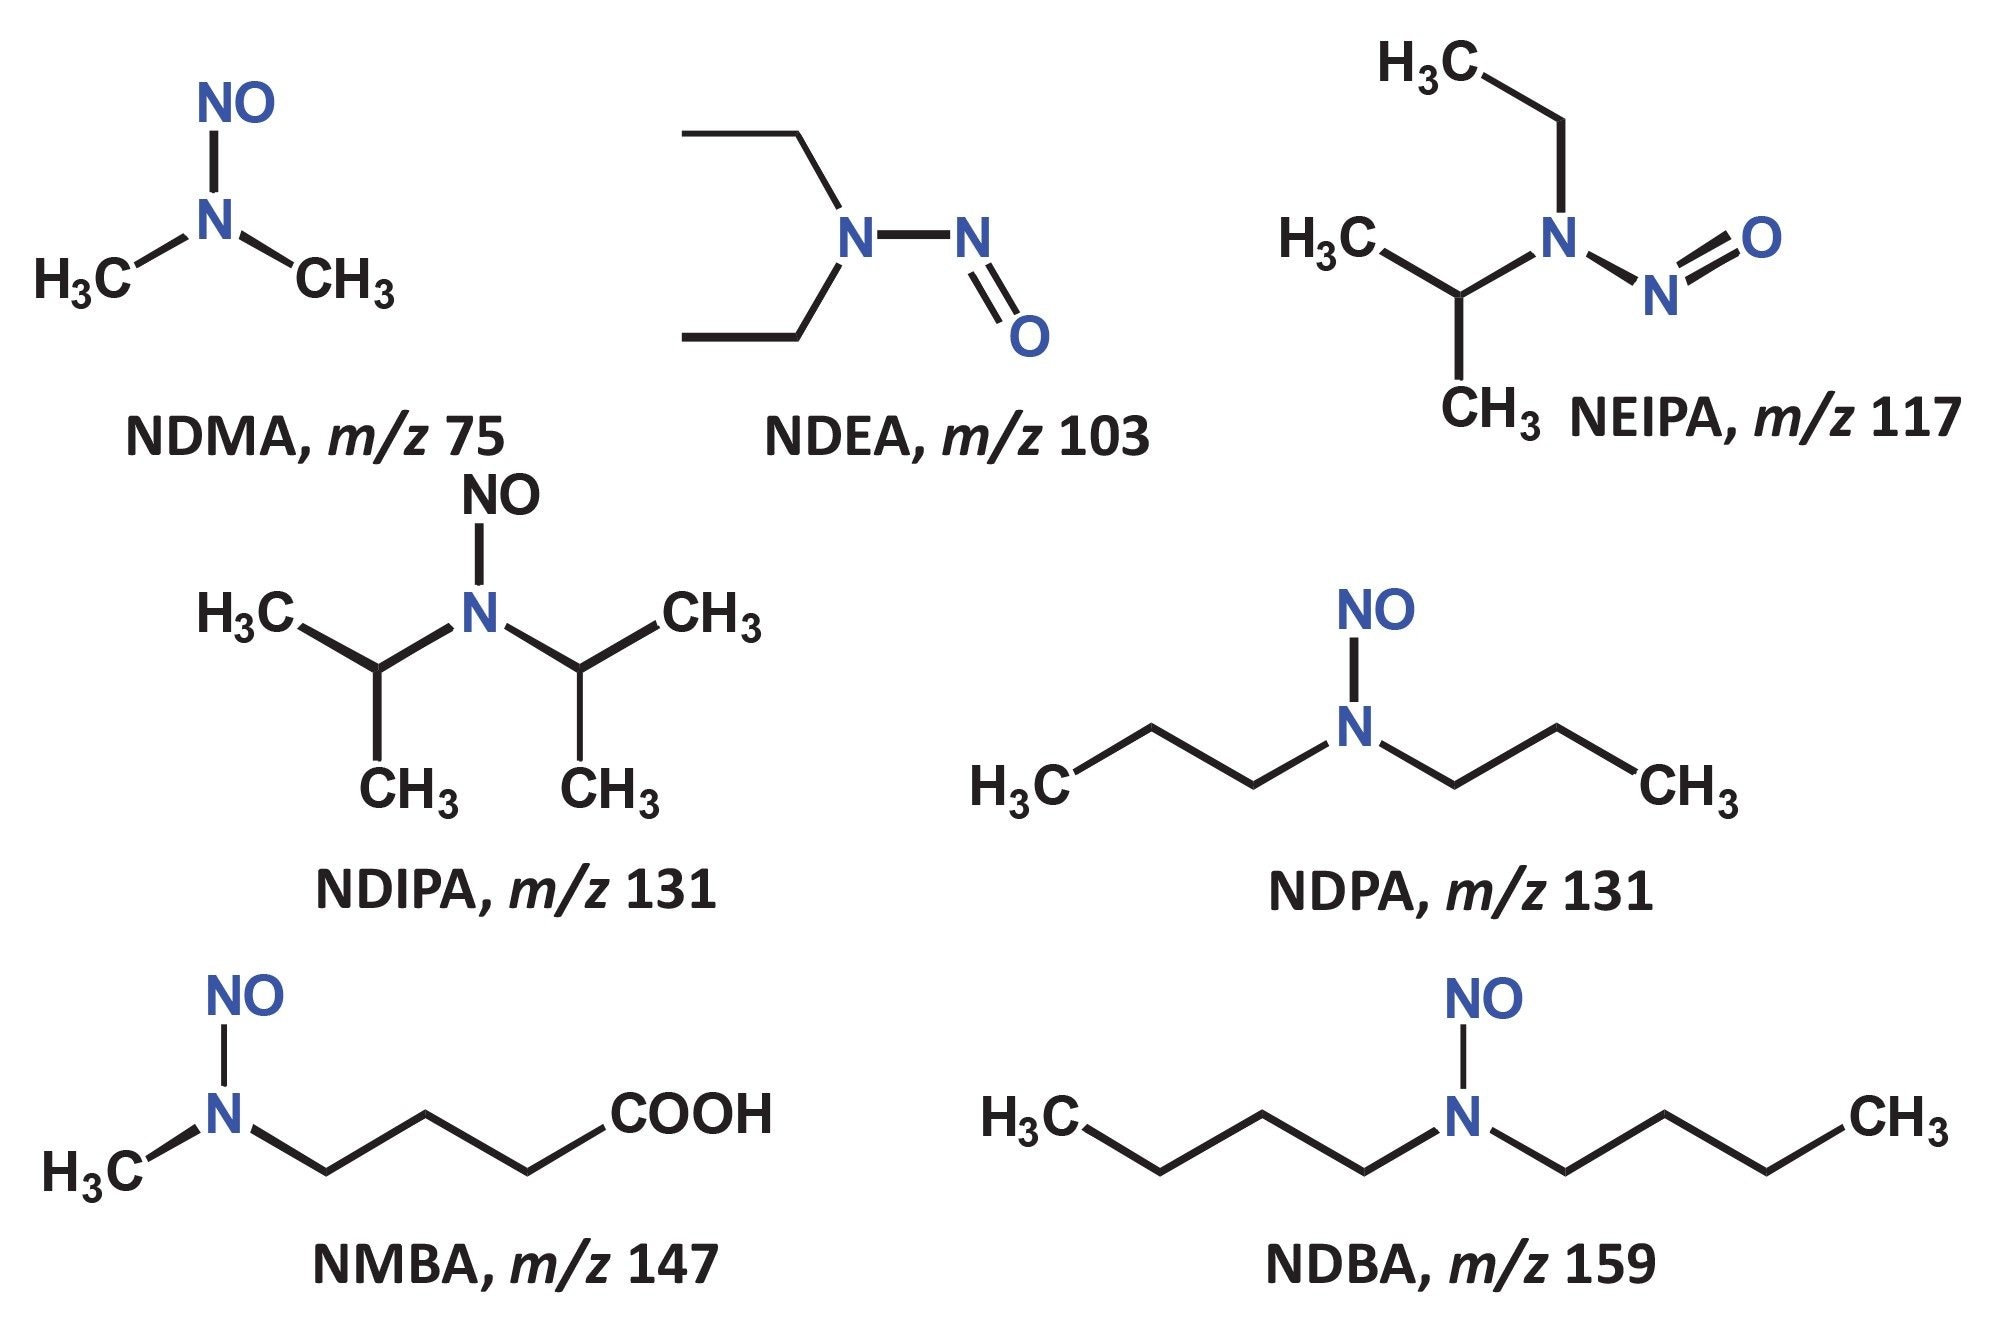
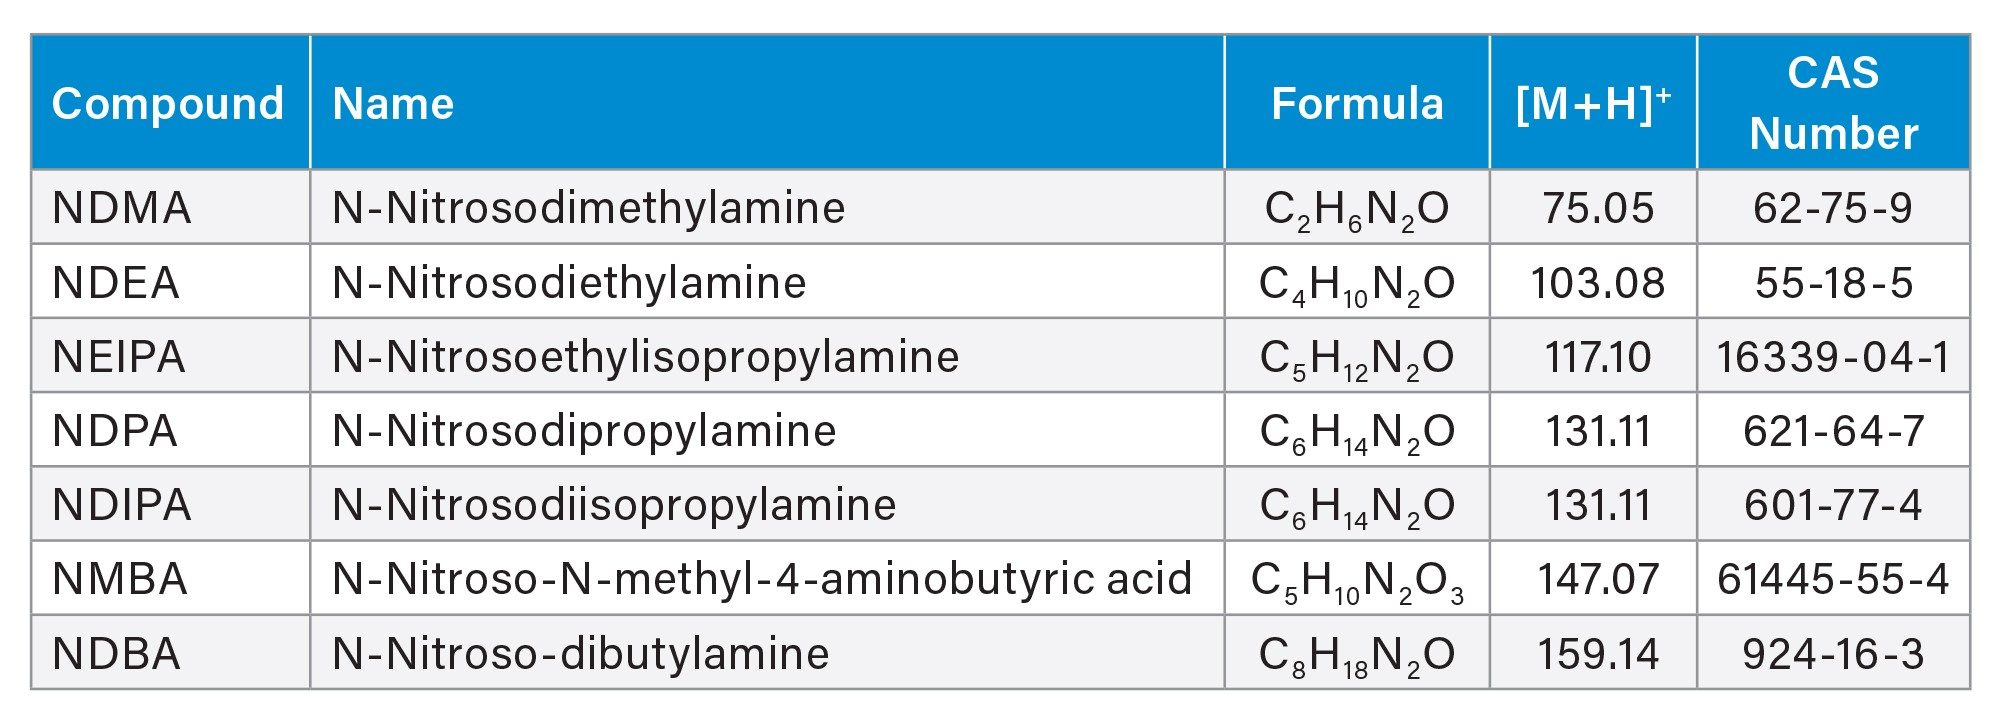
The NDMA, NMBA, NDEA, NEIPA, NDPA, NDIPA and NDBA standards, (Figure 1, Table 1) were purchased from Millipore Sigma (St Louis, MO, USA). Sodium chloride solution (0.9%) BioXtra (S8776-20mL), LC/MS grade ammonium formate (70221-25G-F), LC/MS grade methanol (900688-1L) and water (900682-1L) were purchased from Millipore Sigma. Optima LC/MS grade formic acid (A117-50) was purchased from Fisher Scientific. The 0.9% NaCl IV bags 100 mL were procured online from a commercial vendor (Sample Set 1). In addition, 500 mL 0.9% NaCl IV bags were obtained with authorization from a pharmacy supply chain (Sample Set 2). It is important to note that the normal saline IV bags purchased with authorization from a pharmacy supplier tested negative for all seven nitrosamines.
Sample Preparation
The seven authentic nitrosamine standard solutions were combined and diluted with methanol to create a working stock solution at 10 µg/mL. The working stock was subsequently diluted in 95:5 water/methanol to make a solvent curve ranging in concentration from 0.005 ng/mL–100 ng/mL. The matrix curve was created over the same concentration range using the working stock solution (10 µg/mL), with subsequent dilutions performed in nitrosamine free 0.9% NaCl. The normal saline IV bags were perforated at the valve, and the solution was transferred to autosampler vials in preparation for analysis by LC/MS.
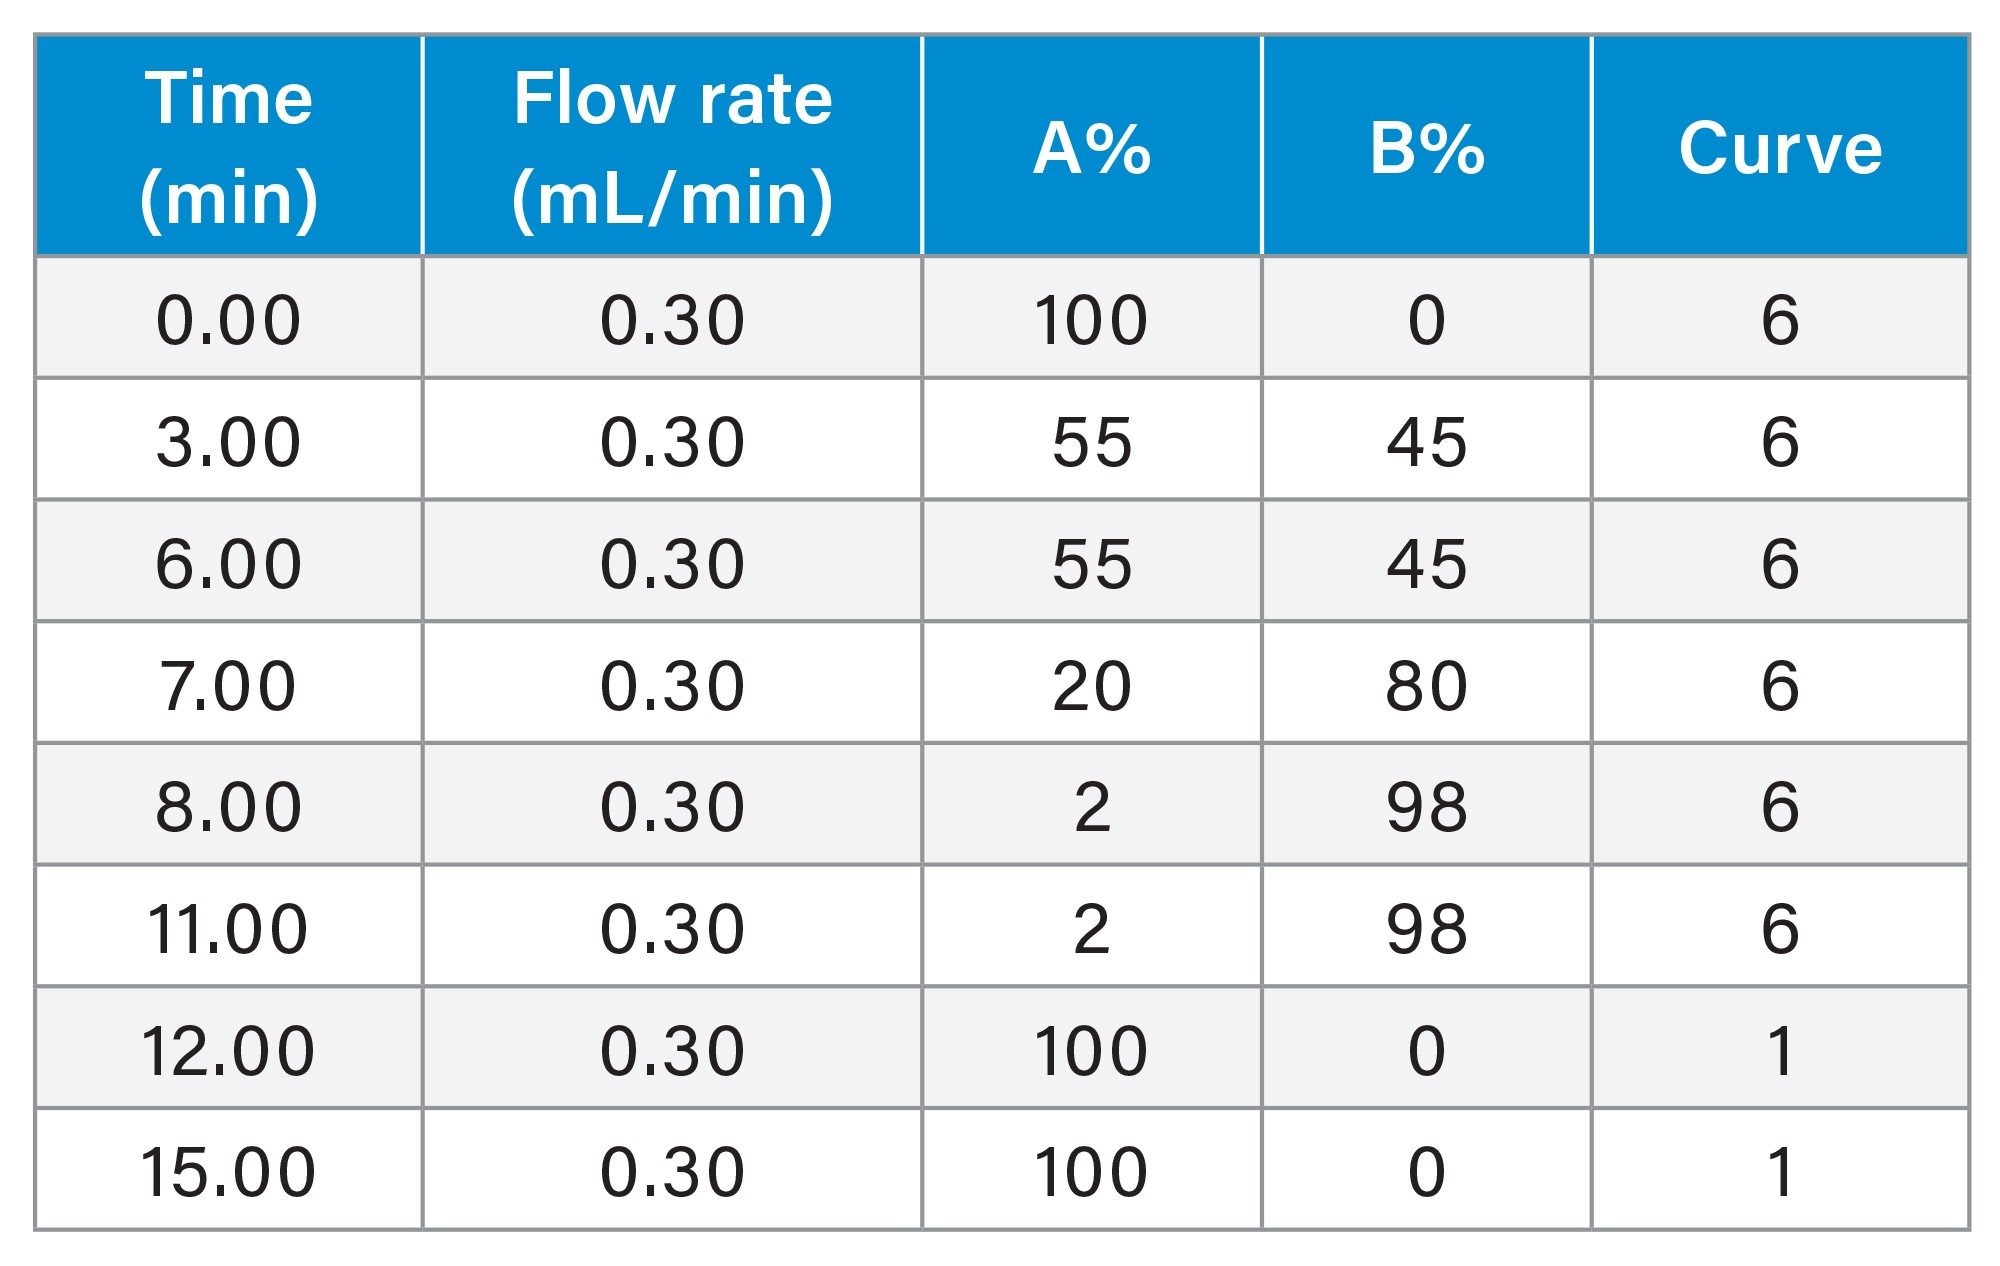
LC Method and Conditions
The analytical LC system consisted of a binary solvent manager (BSM) capable of pressures up to 15k psi and an autosampler (Table 2). The HSS T3 stationary phase used for the separation is compatible with 100% aqueous mobile phases and designed to increase the retention of polar analytes.14
LC Conditions
|
LC system: |
ACQUITY Premier Binary Solvent Manager with an FTN Sample Manager |
|
Detection: |
PDA 210–400 nm |
|
Vials: |
TruView LCMS Clear Glass Vials (p/n: 186005663CV) |
|
Analytical column: |
Waters ACQUITY Premier HSS T3 Column, 1.8 µm, 2.1 x 100 mm, (p/n: 186009468) |
|
Delay column: |
Atlantis Premier BEH C18 AX Column, 5 µm, 2.1 x 50 mm (p/n: 186009407) and 1 µL flexible hypo tip loop (p/n: 430003166) |
|
Column temperature: |
45 °C |
|
Sample temperature: |
6 °C |
|
Injection volume: |
20 µL |
|
Flow rate: |
0.30 mL/min |
|
Mobile phase A: |
5 mM Ammonium Formate in LC-MS grade Water with 0.1% Formic Acid |
|
Mobile phase B: |
5 mM Ammonium Formate in LC-MS grade Methanol with 0.1% Formic Acid |
Table 2. LC Conditions.
The gradient program is shown in Table 3. A delay column was used to mitigate the effects of an interfering component, possibly originating from the mobile phase solvents and eluting at the same retention time (tR) as the NDBA. Despite the selectivity of LC-MS/MS experiments, it is still possible to observe noise and interfering peaks in MRM acquisitions, which can decrease the detection sensitivity and selectivity of the method.15 The trace analysis of low molecular weight analytes can be challenging due to the chemical interference often present in this mass range. Incorporating a delay column helps isolate system related background signals from the analytes of interest, leading to more precise measurements. The use of a delay column to aid the trace level quantitation of nitrosamines was described in previous work.16
To avoid the transmission of the 0.9% (9g/L) NaCl sample diluent, to the MS source, the first 1.75 minutes of the chromatographic run was diverted to the waste using the integrated solvent divert valve.
MS Method and Conditions
A Xevo TQ Absolute XR tandem quadrupole Mass Spectrometer was used to acquire the data (Table 4). The compound optimization, MRM method generation, data acquisition, quantification method generation, and data processing were managed using waters_connect Software (Table 4). The solvent divert valve was enabled in the software to direct the normal saline sample diluent to waste. The divert valve is a component within the fluidics system of the mass spectrometer. The divert valve operates to control the flow paths of fluids, allowing for precise switching between different operational modes such as infusion, waste, combined or LC flow.
MS Conditions
|
Ionization mode: |
APCI Positive |
|
Corona current (µA): |
2 |
|
Cone voltage (V): |
Table 5 |
|
Collision energy (eV): |
Table 5 |
|
Source temperature (°C): |
120 |
|
Probe temperatute (°C): |
250 |
|
Desolvation gas flow (L/hr): |
800 |
|
Cone gas flow (L/hr): |
300 |
|
Nebulizer (L/hr): |
155 |
Table 4. MS conditions.
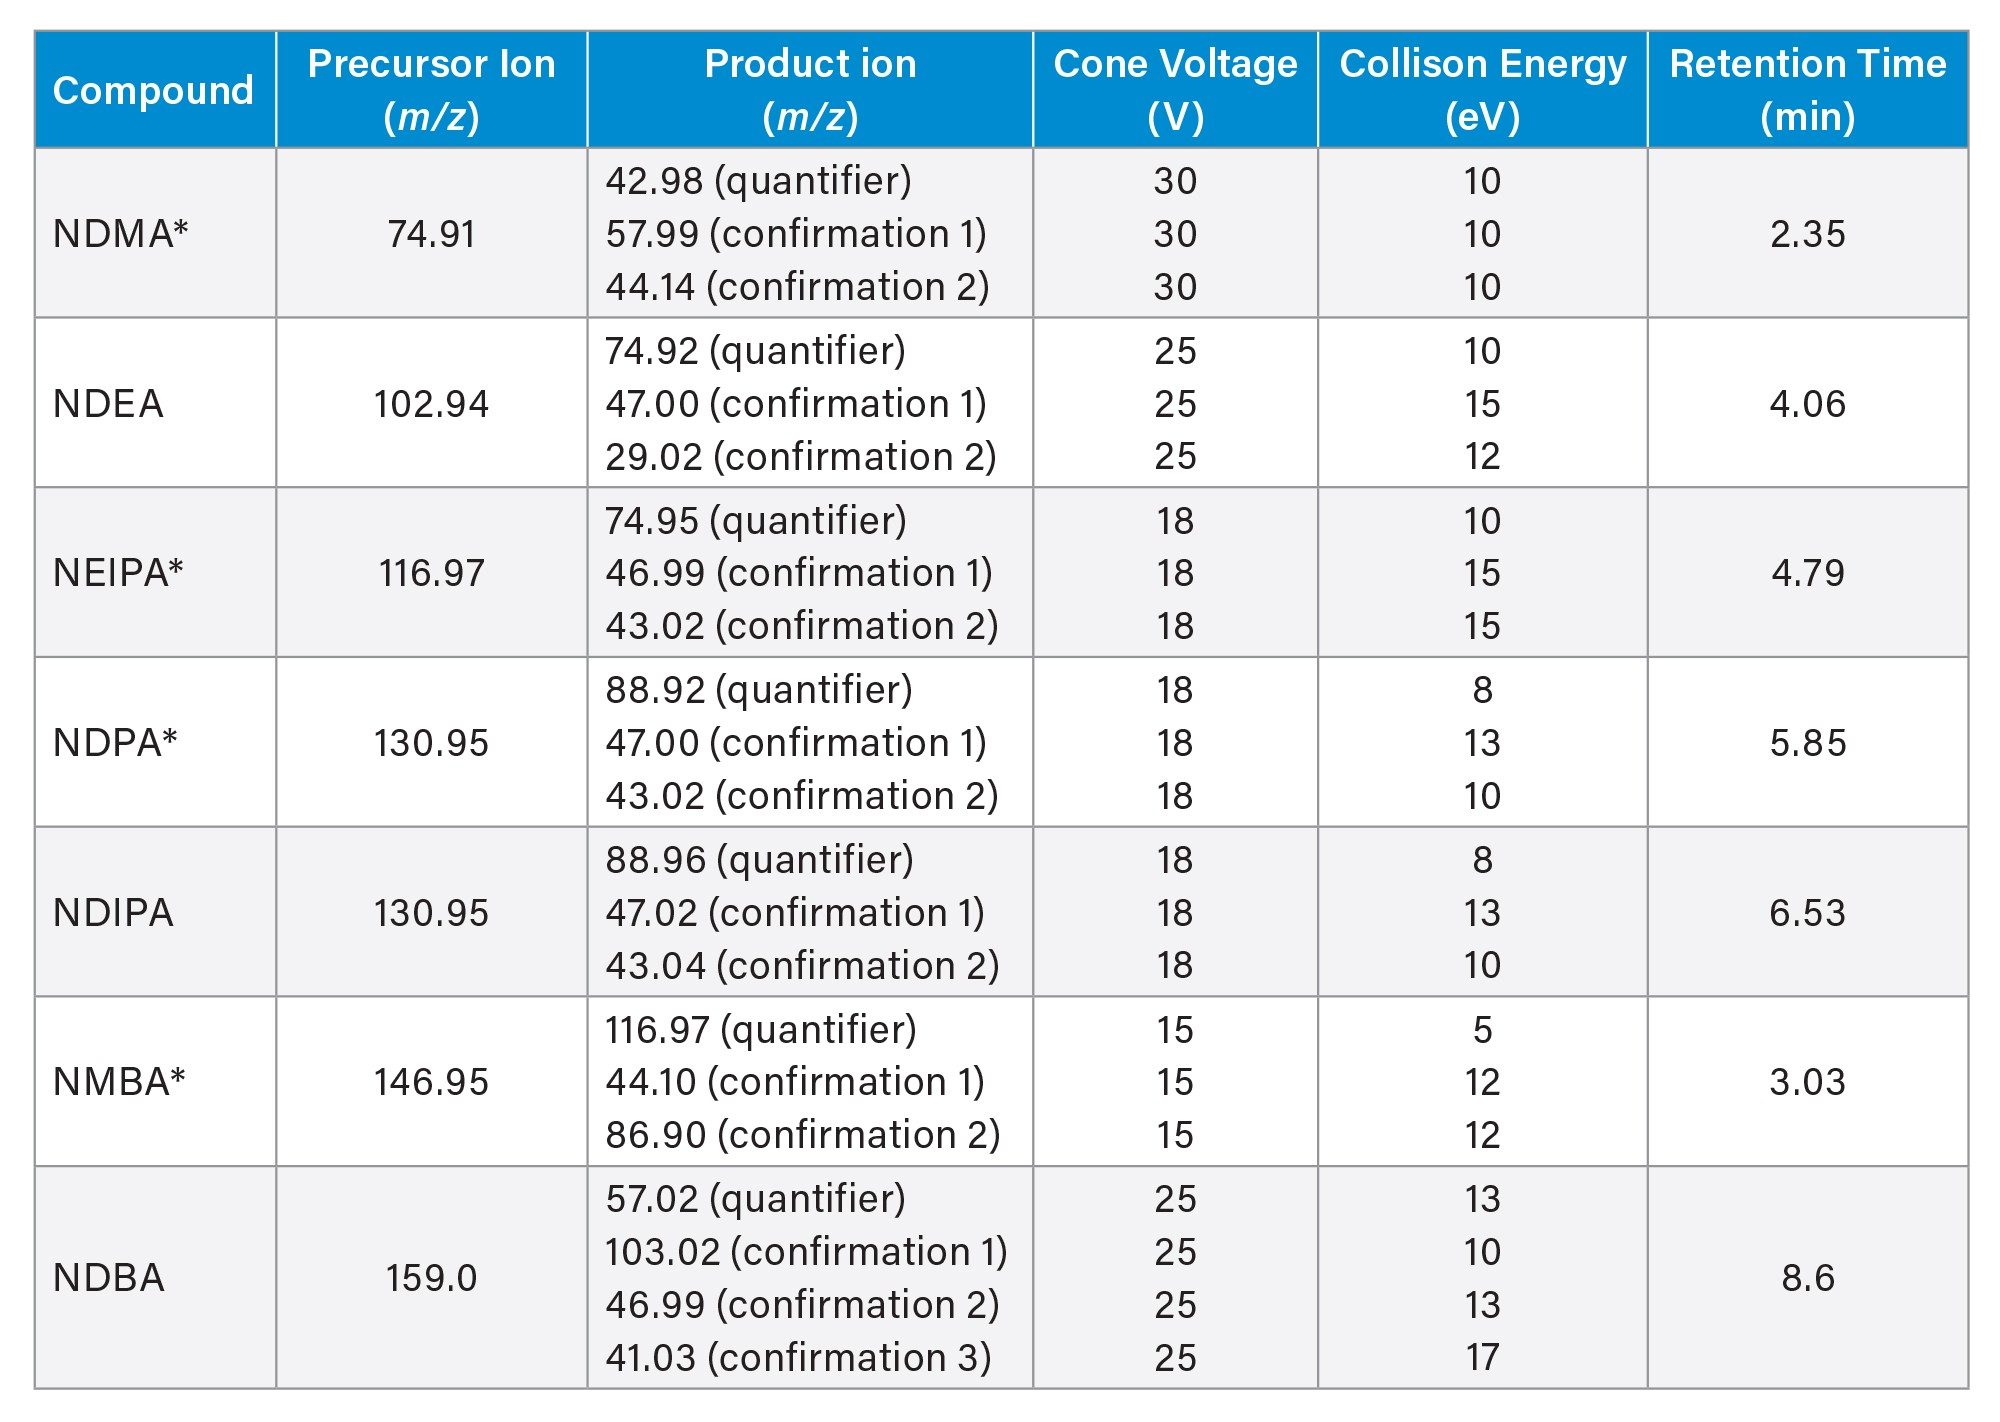
Nitrosamine MS Optimization
For the MS optimization, the nitrosamine standards were prepared in 50/50 methanol/water at 200 ng/mL. The MRM parameters were tuned by infusion of the analyte into the MS at the LC flowrate used for the analytical experiments (0.300 mL/min). Following the development of the MRM method (Table 5), the source parameters were then optimized. Soft transmission settings were applied to NDMA, NEIPA, NDPA, and NMBA. These settings promote gentle application of source voltages to reduce nitrogen gas-analyte ion collisions promoting less insource fragmentation and higher transmission. Soft transmission can be enabled in the MS method.
waters_connect Software
The waters_connect for Quantitation Software streamlined and simplified the individual steps required to develop an LC/MS method, including optimization of the MRM transitions with automatic generation of the quantitative method directly from the MS acquisition method. Data review is assisted by setting batch pass/fail criteria resulting in clear user alerts. The software supports 21 CFR Part 11 compliance by ensuring data integrity through secure access restrictions, electronic signatures and automated audit trails.
Results and Discussion
Matrix Effects, Accuracy, and Precision
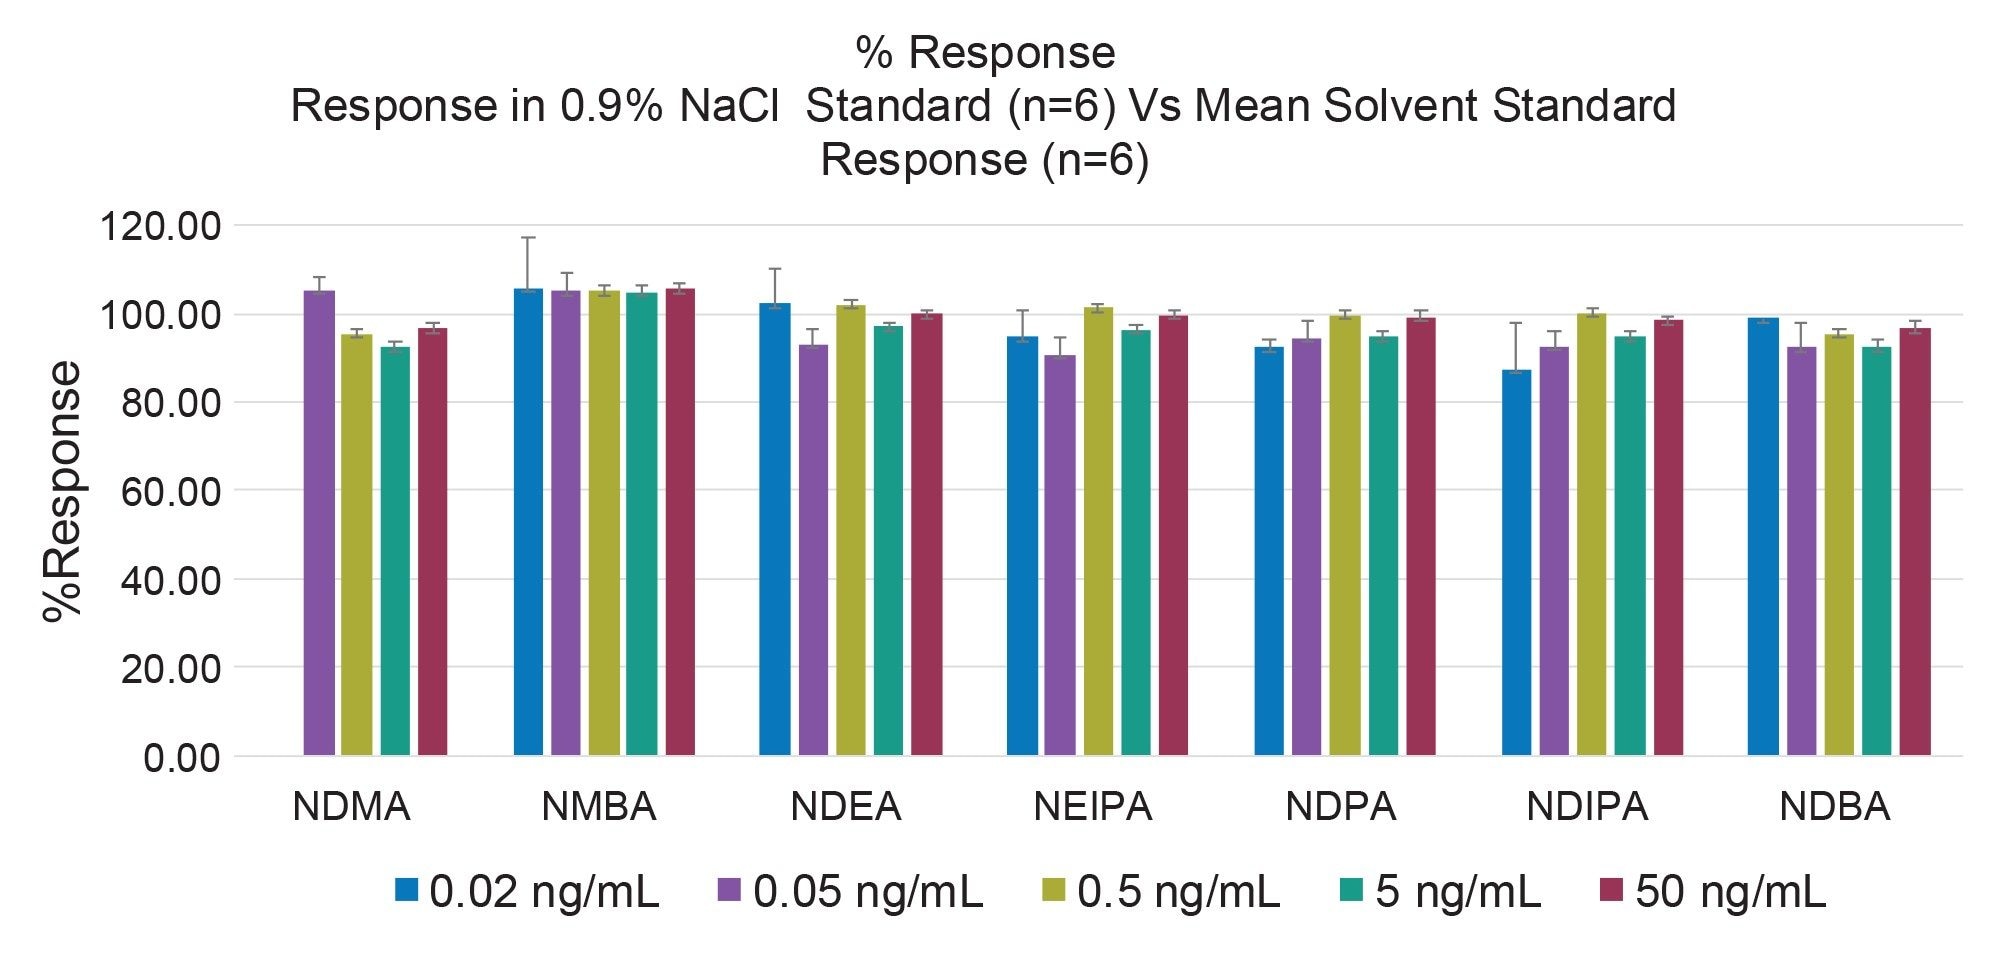
The % response of each nitrosamine was evaluated by comparing the analyte response in 0.9% NaCl with that of the equivalent analyte response in a solvent standard. The following calculation was used %Response= Mean Analyte Response in 0.9% NaCl (n=6)/Mean Standard Response (n=6) *100
The % response was measured using the following concentrations 0.02 ng/mL, 0.05 ng/mL, 0.5 ng/mL, 5 ng/mL, and 50 ng/mL. A bar chart summarizing the results is shown in Figure 2. The % response ranged from 88–105 % with %CV ranging from 0.9–10.5 across the concentrations tested for all compounds.
The % matrix effects were also evaluated. The results were determined based on six replicate measurements at four concentration levels (0.05-50 ng/mL). The seven nitrosamines tested showed either suppression or enhancement ranging from -9.3 to 13.2% with standard deviations (SD) between 0.9–11.3% (data not shown).
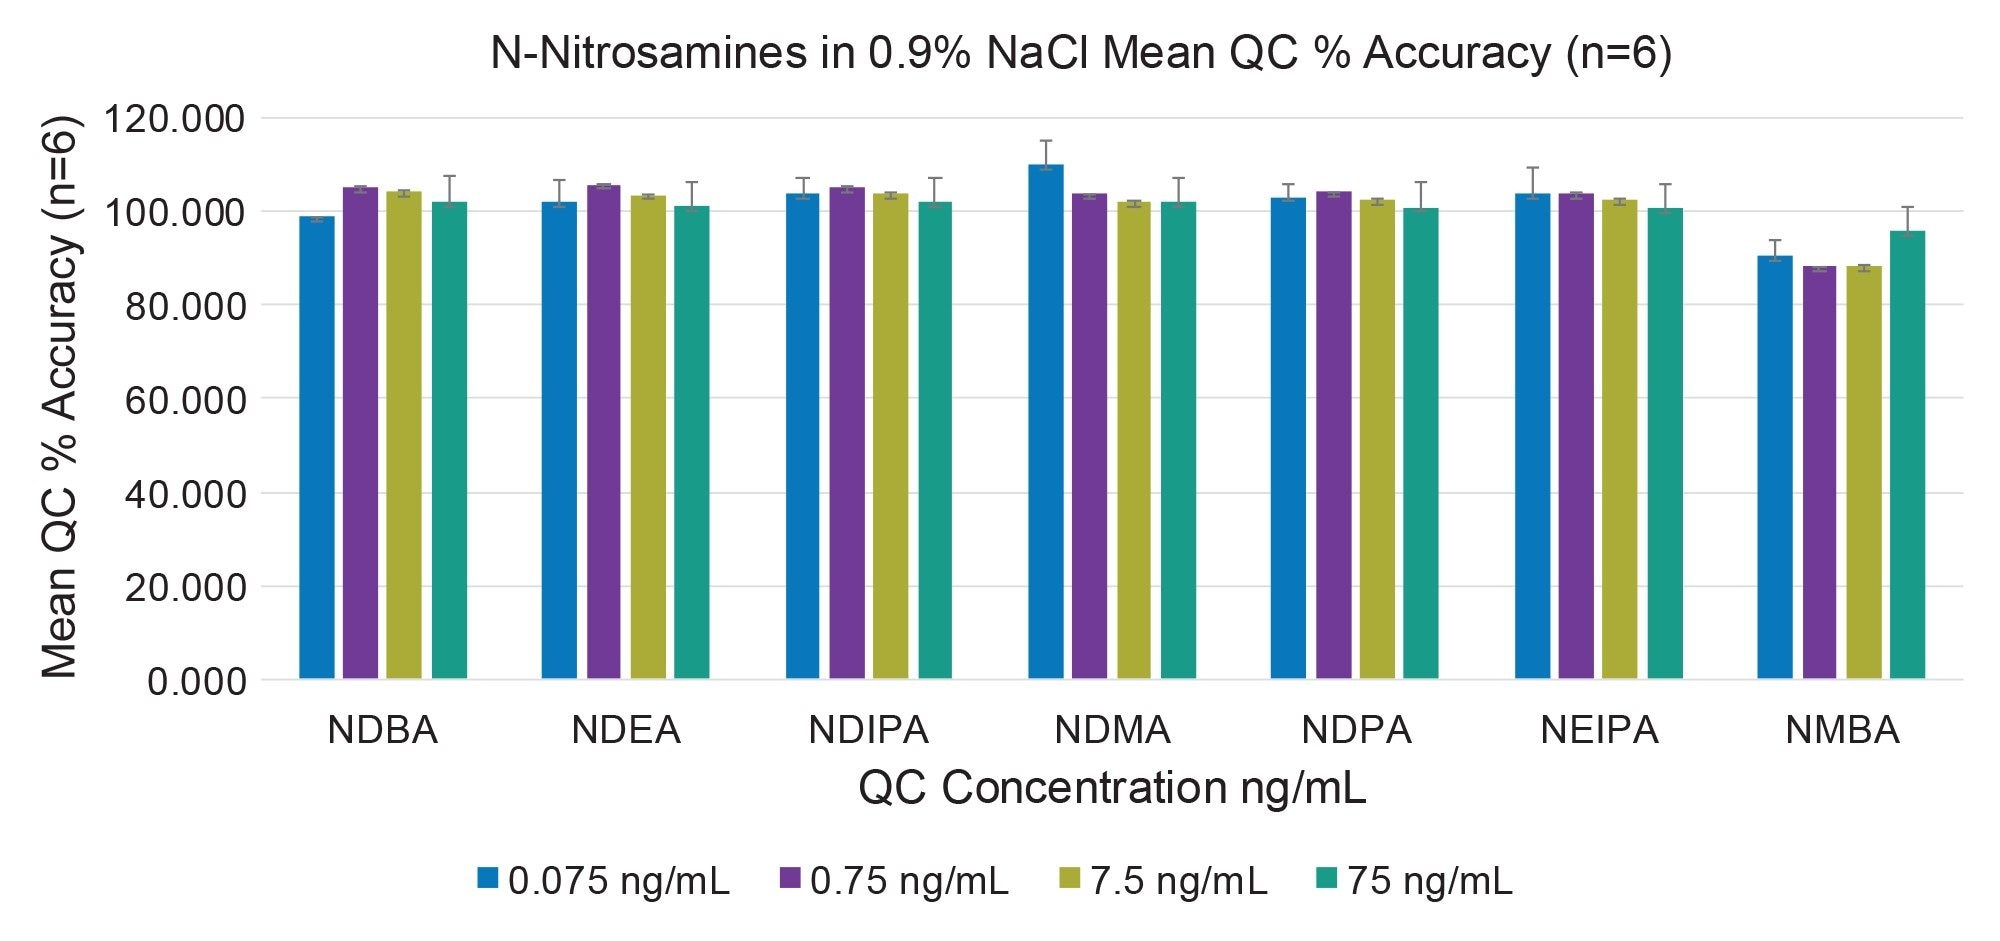
Accuracy and precision were evaluated using four QC levels with the following concentrations:, 0.075 ng/mL, 0.75 ng/mL, 7.5 ng/mL, and 75 ng/mL. The bar chart in Figure 3 summarizes the QC performance of the N-nitrosamines in 0.9% NaCl assay. The QCs were measured against the 0.9% NaCl curve ranging from 0.01–100 ng/mL. The mean accuracies for QCs for all compounds were between 88–110 with CVs between 0.033–5.5%.
Quantitative Method Development for N-Nitrosamines in 0.9% NaCl Solution
The waters_connect Software co-ordinates the method optimization, data acquisition, processing, review and reporting of LC-MS/MS data. All quantitative data was processed and evaluated using the MS Quan Application within the waters_connect Software ecosystem. The data are presented in such a way to display exceptions to rules which are set in a “Rules Set” in the processing method (i.e. deviations must be <15%, R2 must be <0.99, etc.). This allows for faster interpretation and reporting of results.
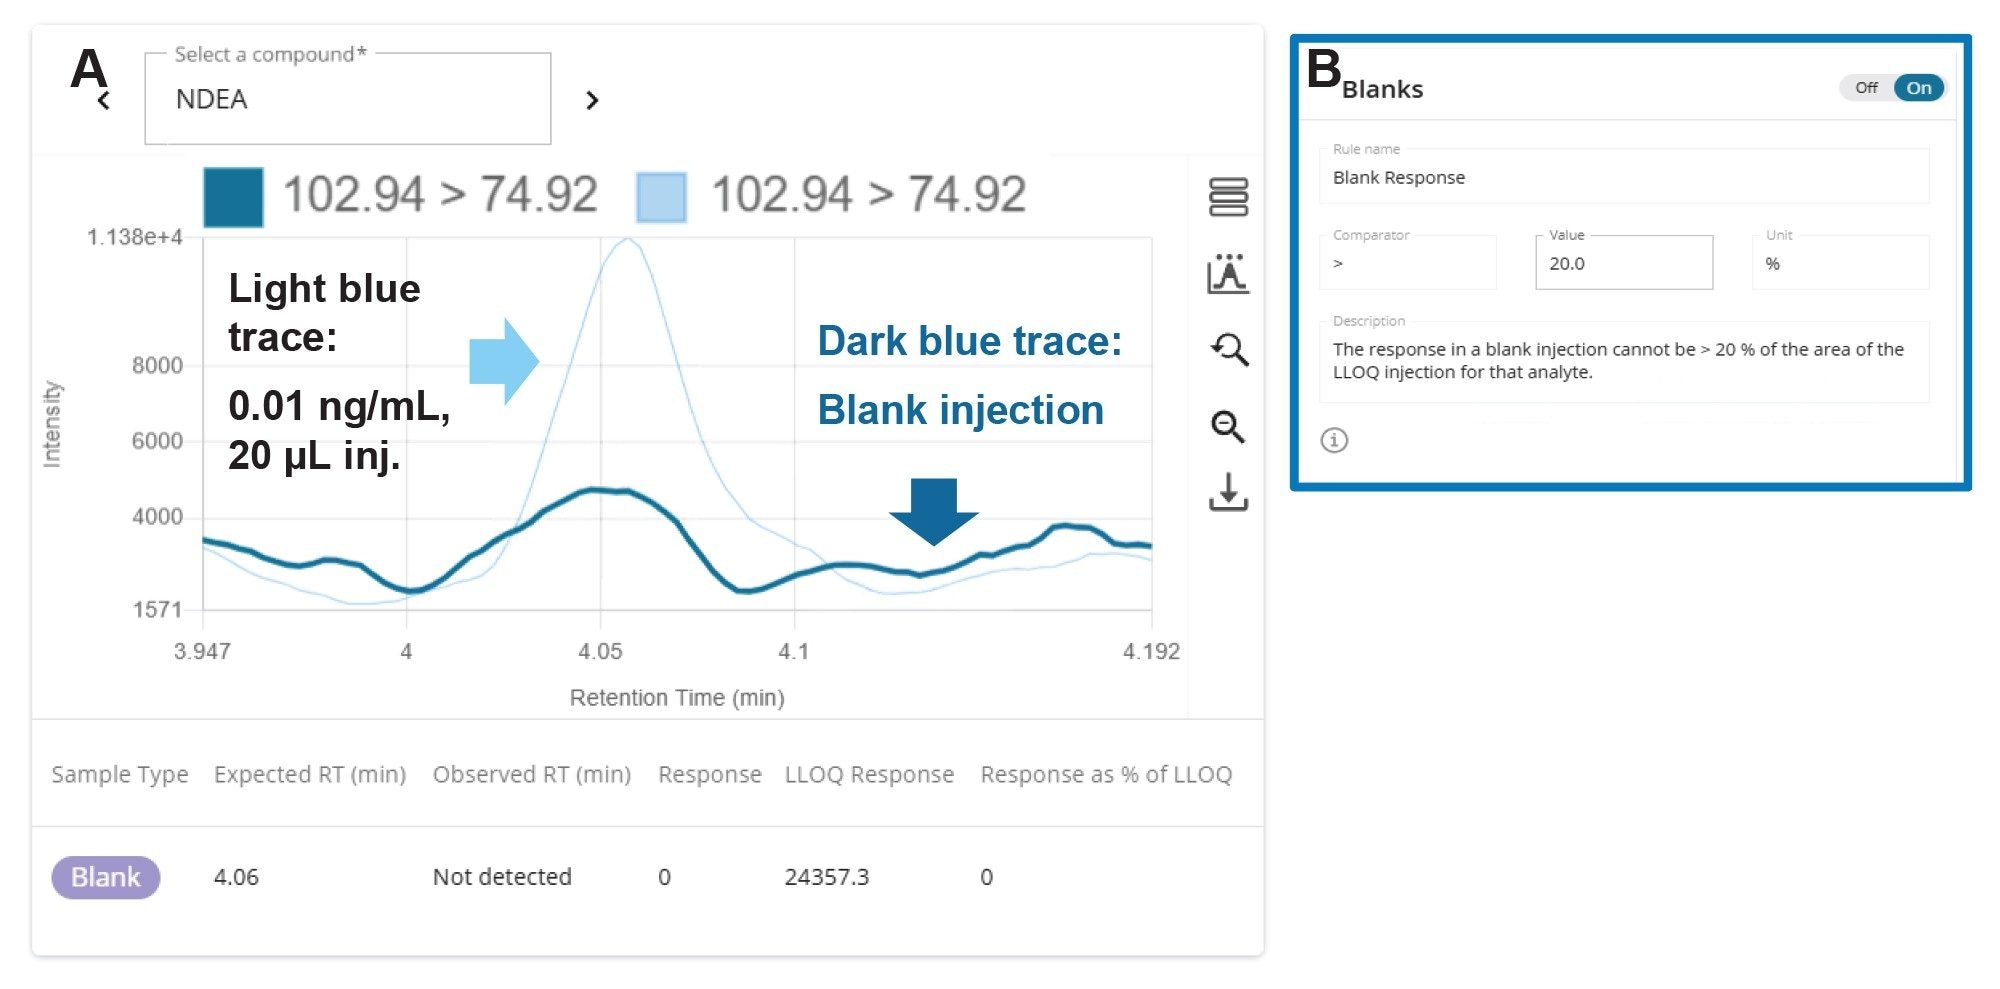
A weighted least squares regression model with 1/x weighting was used to establish the analyte concentration and peak area relationships. No internal standards were used. For the calibration standards and QC samples, the waters_connect Rule Set shown in Figure 4A and 4B, was configured to accept less than 20% concentration deviation at the lower limit of quantitation (LLOQ) and <15% deviation across the remainder of the calibration points. The acceptable R2 value, configured in the Rule Set, was set to a minimum of 0.99 (Figure 4C). The blank response was set to be less than 20% of the LLOQ (Figure 4D).
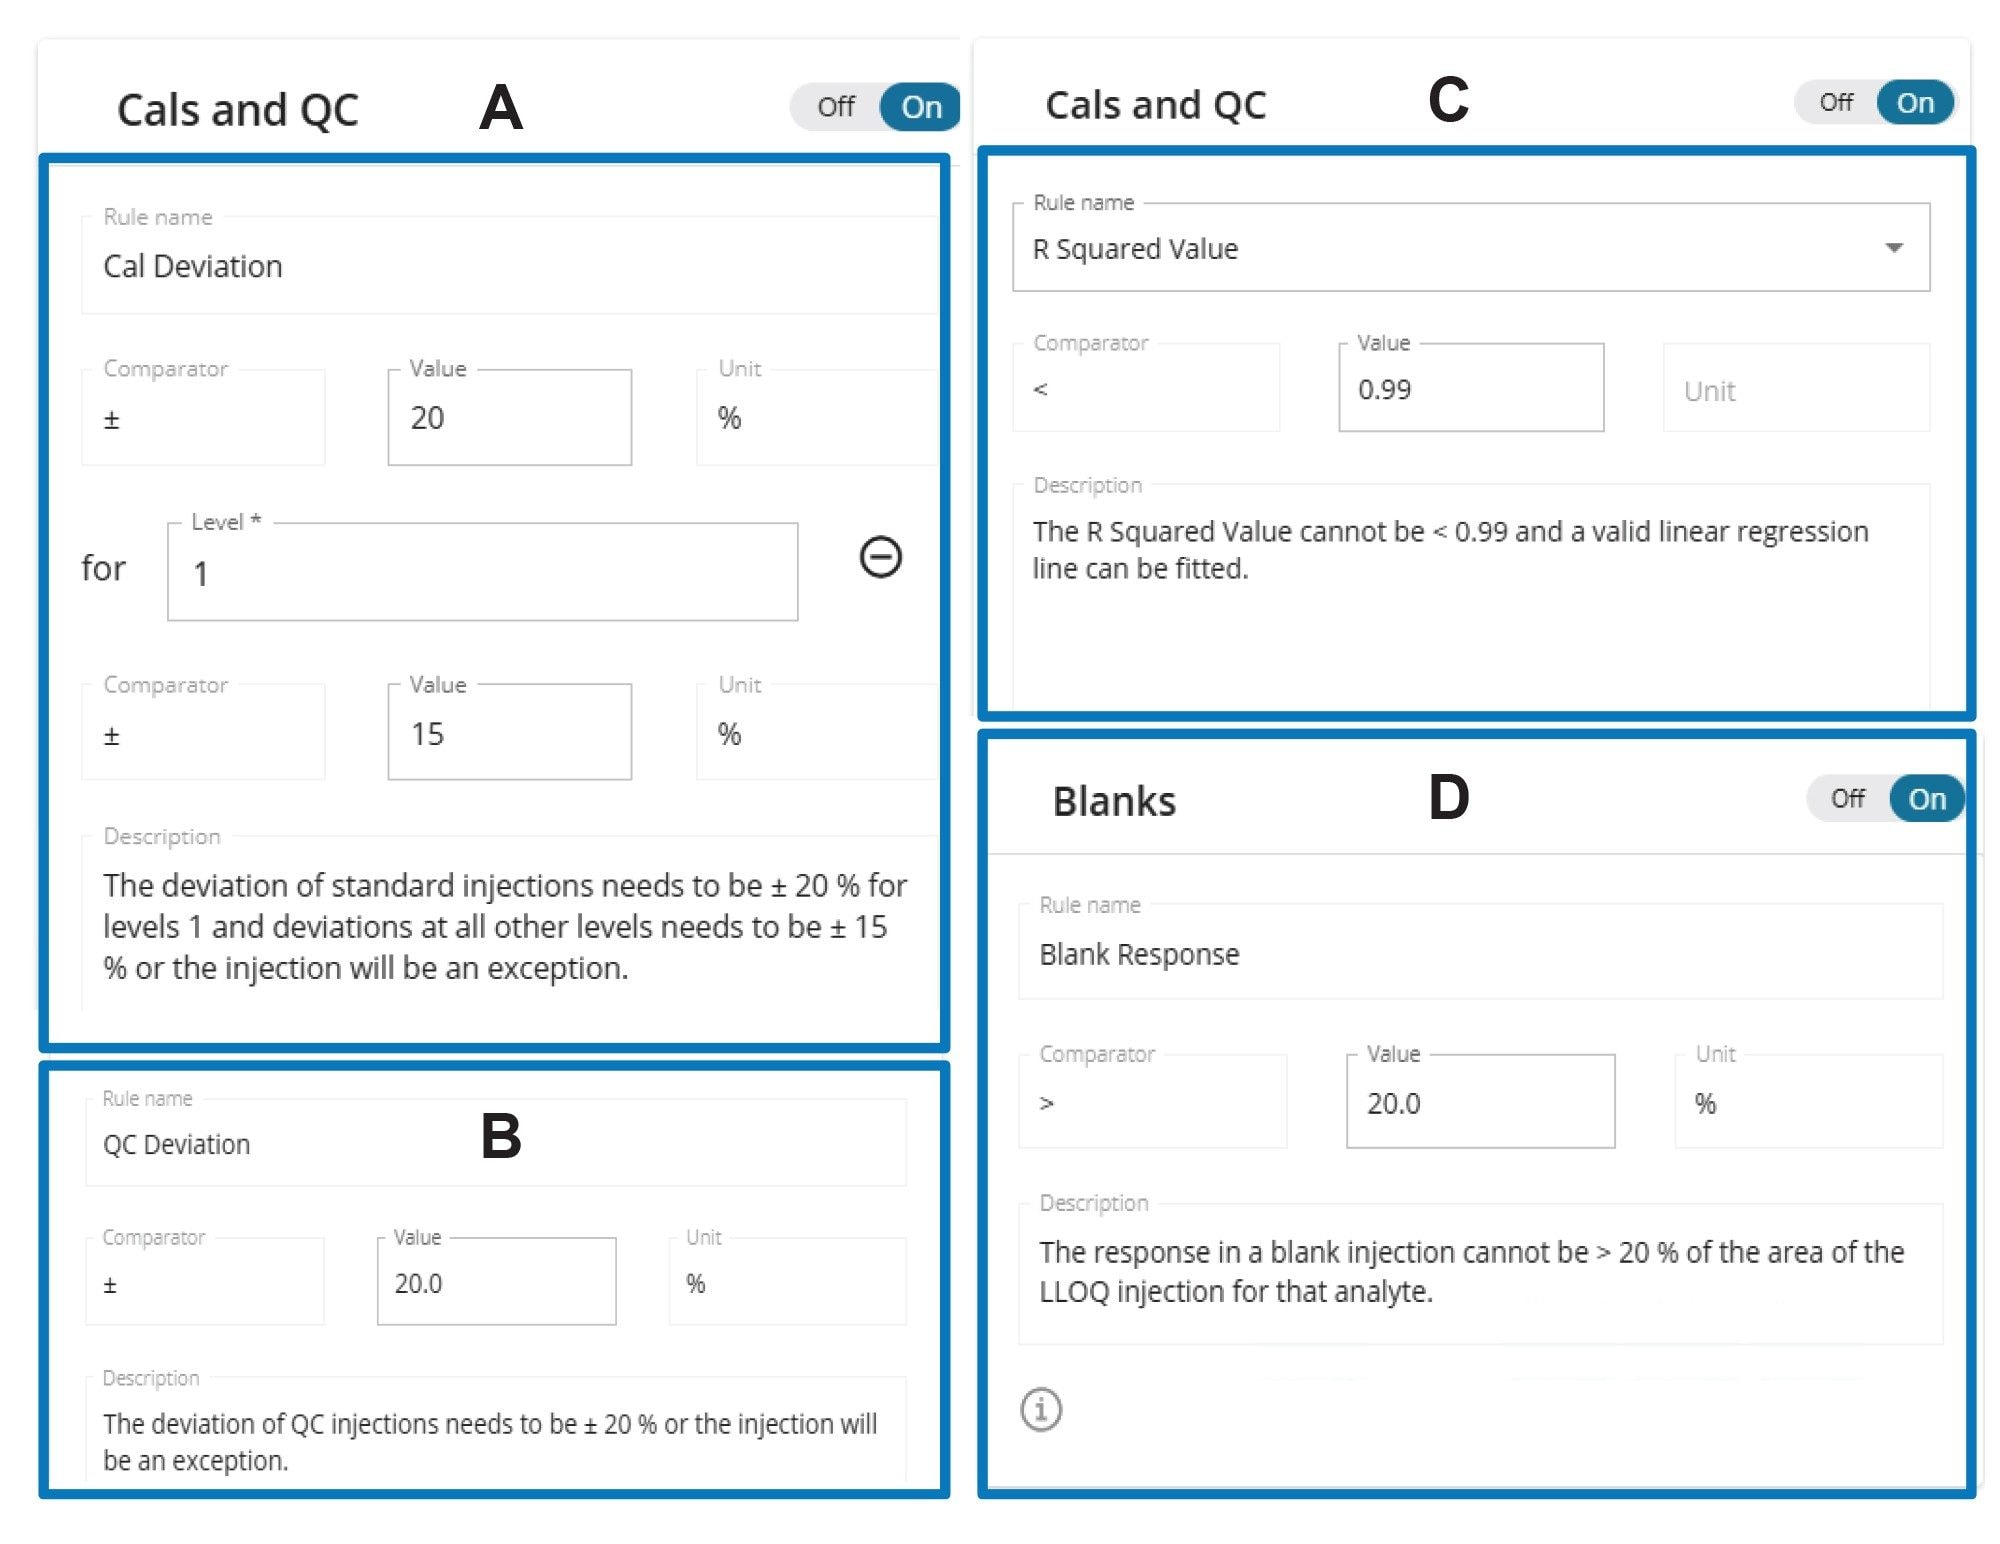
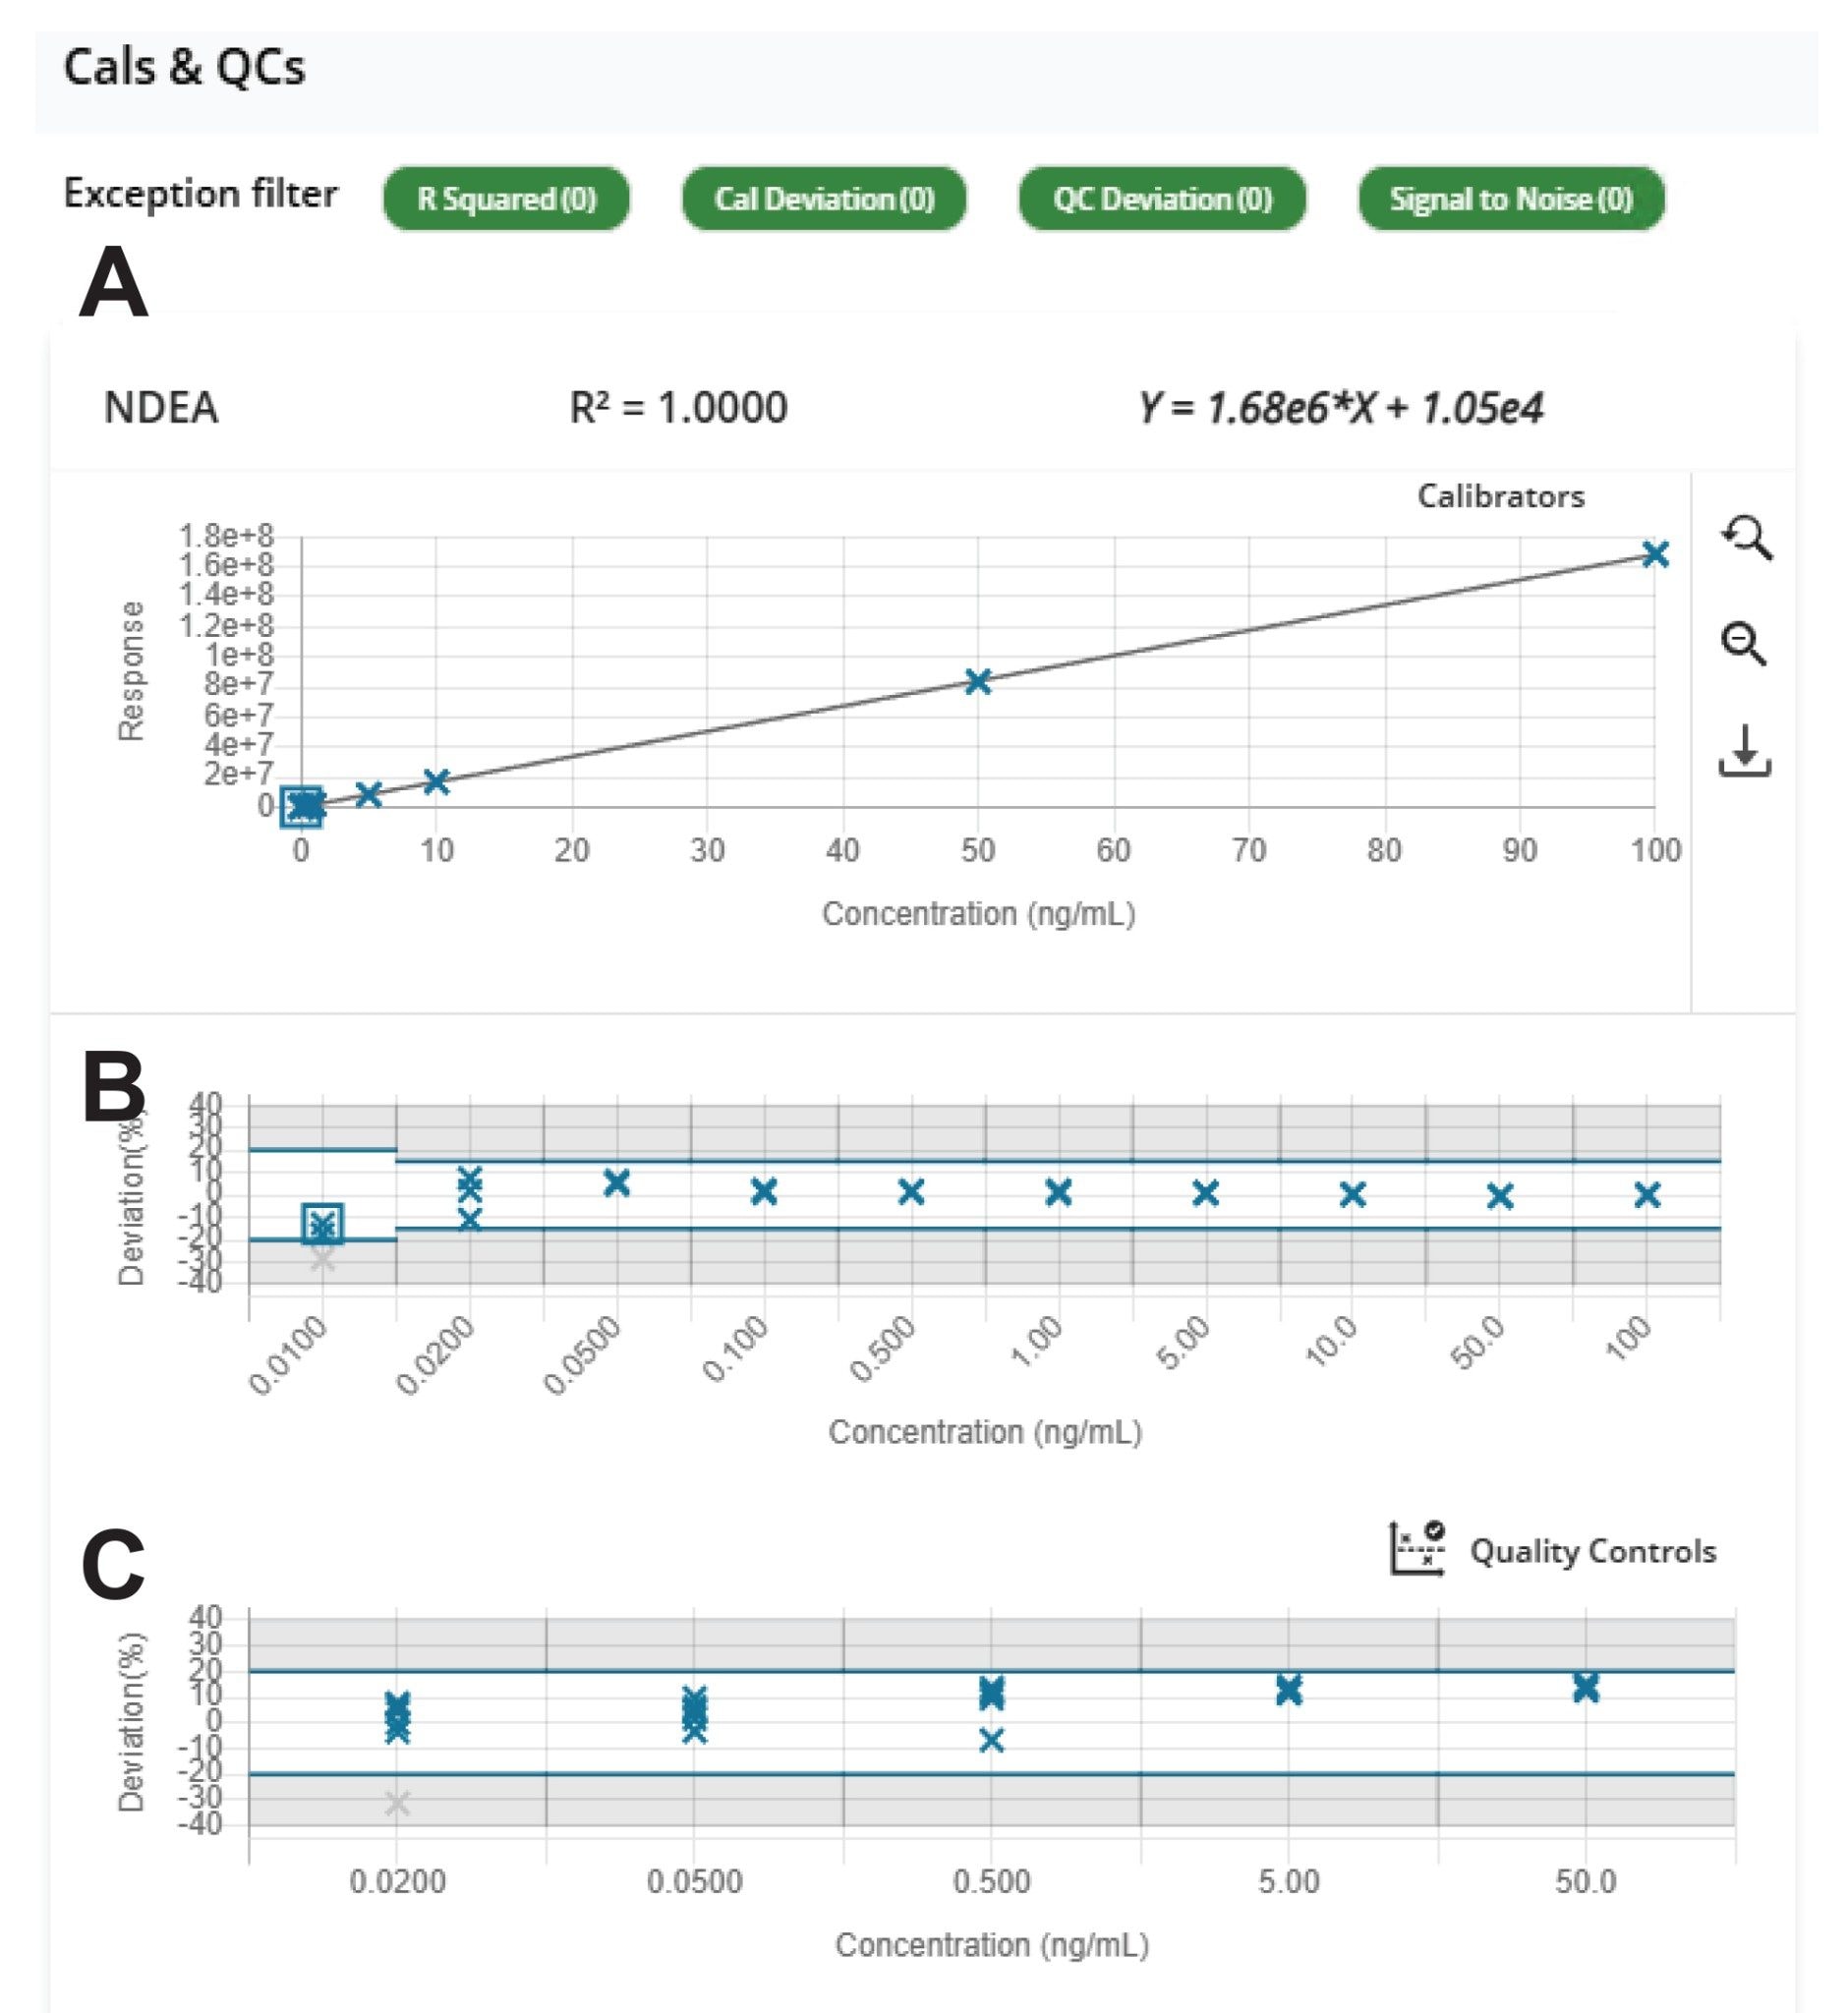
Figure 5 shows an example of the calibration curve injected in triplicate for NDEA plotted with 10 calibration points over the range 0.01–100 ng/ml in 0.9% NaCl (R2 1.00, 1/x weighting) demonstrating four orders of linear dynamic range. In this experiment, accuracy and precision were evaluated using five QC points (n=6) ranging from 0.02 ng/mL to 50 ng/mL as shown.
There are no exceptions flagged in the curve or QCs, as can be seen from the green colored exception filters, indicating the data passes the acceptance criteria established in the Rule Set (Figure 4A-D).
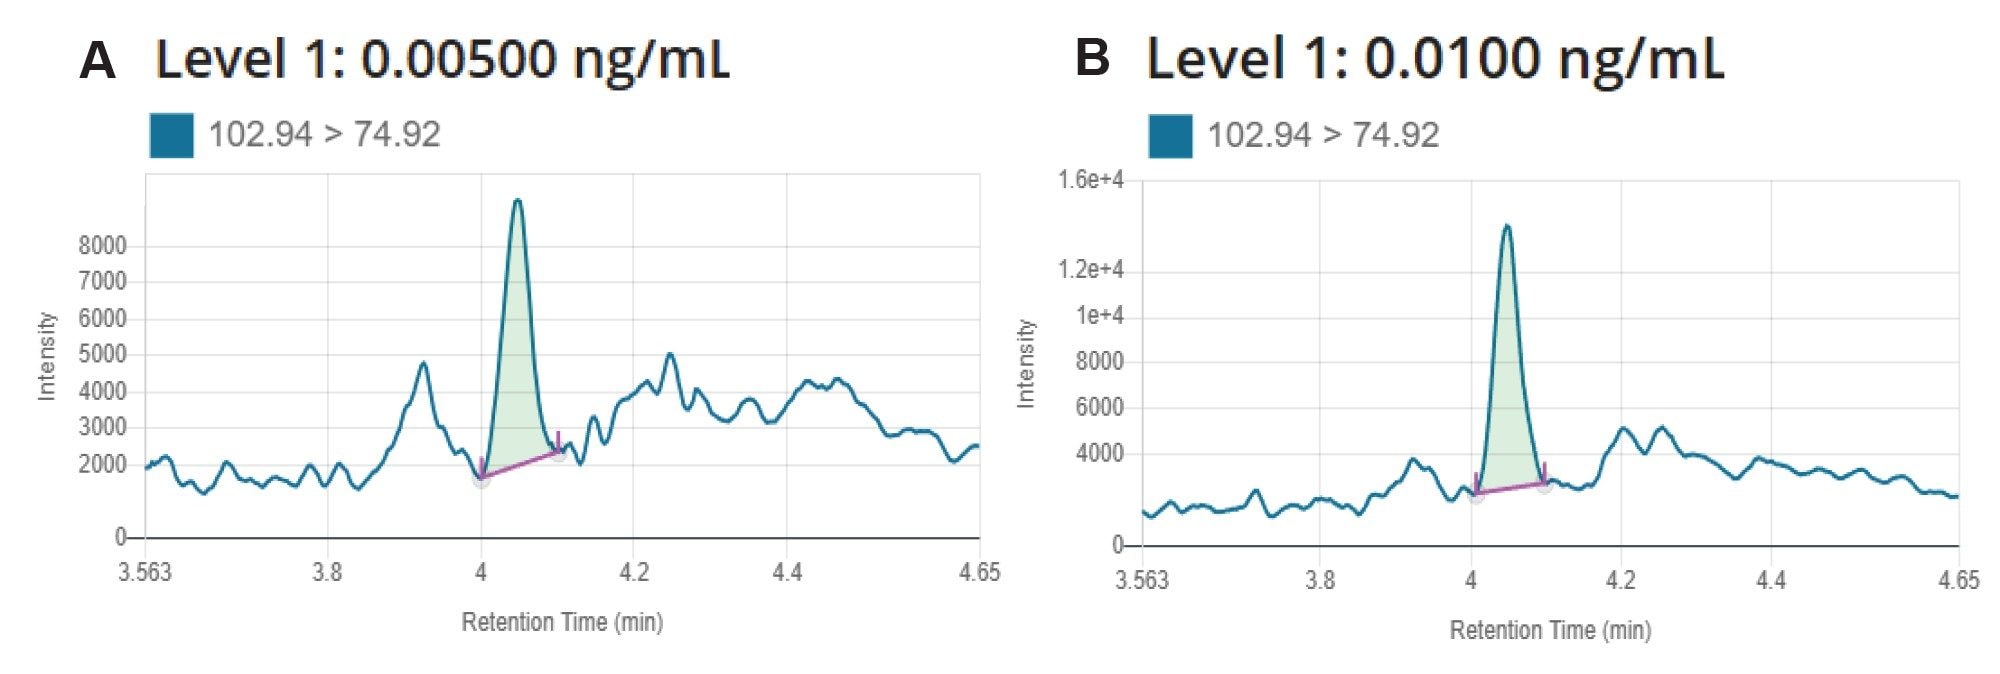
The lowest calibration points tested for NDEA in the study are shown in Figure 6, 0.005 ng/mL (A) and 0.01 ng/mL (B), using a 20 µL injection. The blank response can be assessed using the Blank Review feature in the waters_connect Software. For simple review, the lowest level calibration standard is superimposed with the matrix blank as shown in figure 7A. As described previously, the Rule Set controls the assay acceptance criteria (Figure 4). The maximum acceptable blank response expressed as a % of the LLOQ was set to <20% (Figure 7B).
Identification of Nitrosamines in Normal Saline IV bags
To evaluate the analytical method, IV infusion bags containing normal saline were purchased from an online vendor (Sample Set 1). Later in the study, a single batch (n=6) of 500 mL, normal saline IV bags, originating from a different manufacturer, were purchased with authorization from a pharmacy supply chain (Sample Set 2). All normal saline IV bags from the authorized supplier tested negative for the nitrosamines listed in the method (results not shown).
Identification of NDEA
NDEA is classified as a low molecular weight nitrosamine with sufficiently robust toxicological data to serve for derivation of other AIs by structure activity relationships (SAR) and read across. The recommended AI limit for NDEA is 26 ng/day (EMEA and FDA).12,13 However, this risk is based on long term usage of pharmaceutical products.
Figure 8 shows the detection of a component in a 100 mL IV bag. This component shares the same tR as NDEA (4.05 minutes) in both a solvent standard and a matrix standard.
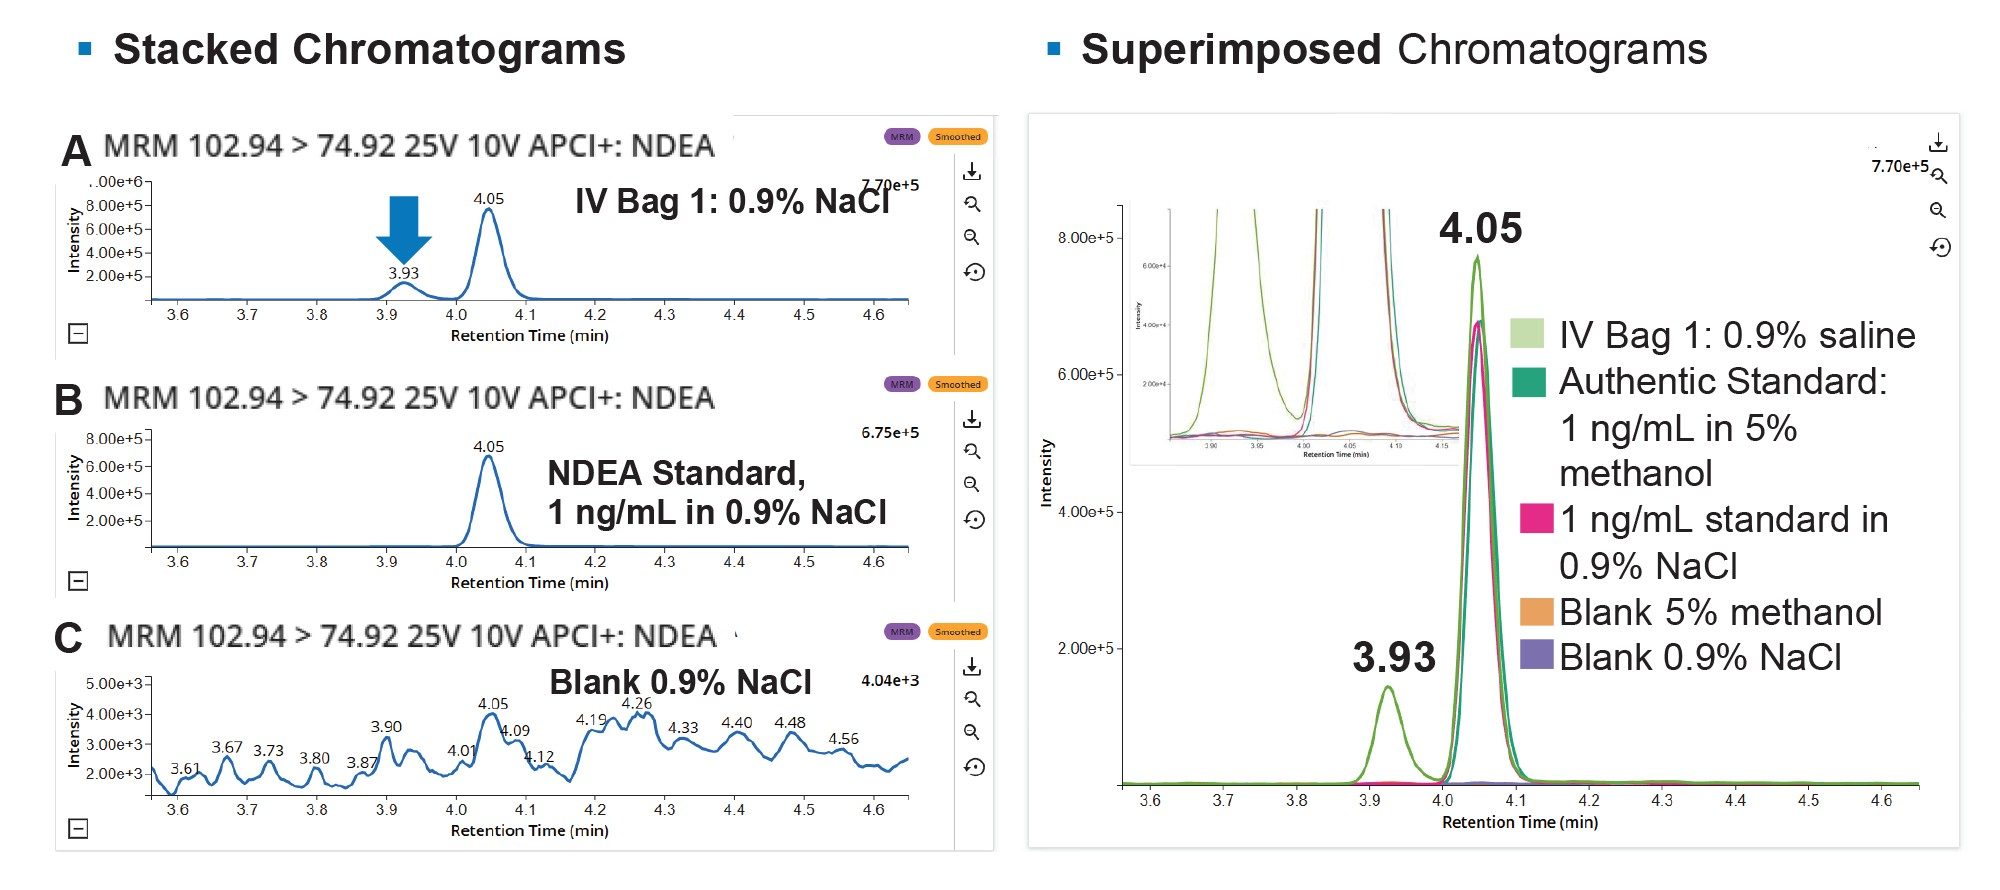
In Figure 8, the chromatograms (A–C) compare the analysis of the IV bag solution (A) with the chromatogram from nitrosamine free 0.9% NaCl spiked at 1 ng/mL with an authentic standard of NDEA (B). The blank unspiked matrix is also shown (C). NDEA elutes at 4.05 minutes. A peak at the same tR was detected in the IV bag solution. This component shares multiple MRM traces with NDEA. In addition, a closely eluting component was detected at a tR of 3.93 minutes, which also shares multiple MRM transitions with NDEA.
In Figure 8, the following MRM chromatograms were superimposed with the vertical axis linked: solvent blank, matrix blank, solvent standard at 1 ng/mL NDEA, matrix standard at 1 ng/mL and the unknown component in the IV bag. Each MRM trace is colored differently as described. The light green colour, which is the most intense peak in the chromatogram, indicates the component suspected to be NDEA detected in the IV bag. The signal for this component completely overlays with the solvent and matrix standards (tR 4.05 minutes).
The Use of MRM Ion Ratios to Enhance Confidence in the Identification of Nitrosamines in IV Bags
MRM ion ratios can be used to enhance confidence in the detection of unknown components in samples. As described previously, the Rule Sets, which are part of the processing method, can be used to determine batch acceptance criteria. The rules can then be applied to the batch to determine if an identification in a sample passes. For example, rules can be applied to MRM ion ratios by specifying specific pass/fail detection criteria.
In this study, the acceptance criteria for the ion ratios were set to be within +/- 15% of the measured value for the NDEA confirmatory traces. In Figure 9, the benefit of ion ratios can be clearly observed. When the ion ratios based on three replicate injections of each sample are compared for the NDEA standard, tR 4.05 minutes (Peak No. 1), unknown component at tR 3.93 minutes (Peak No. 2), and the component suspected to be NDEA in the IV bag, tR 4.05 minutes (Peak No. 3) are compared.
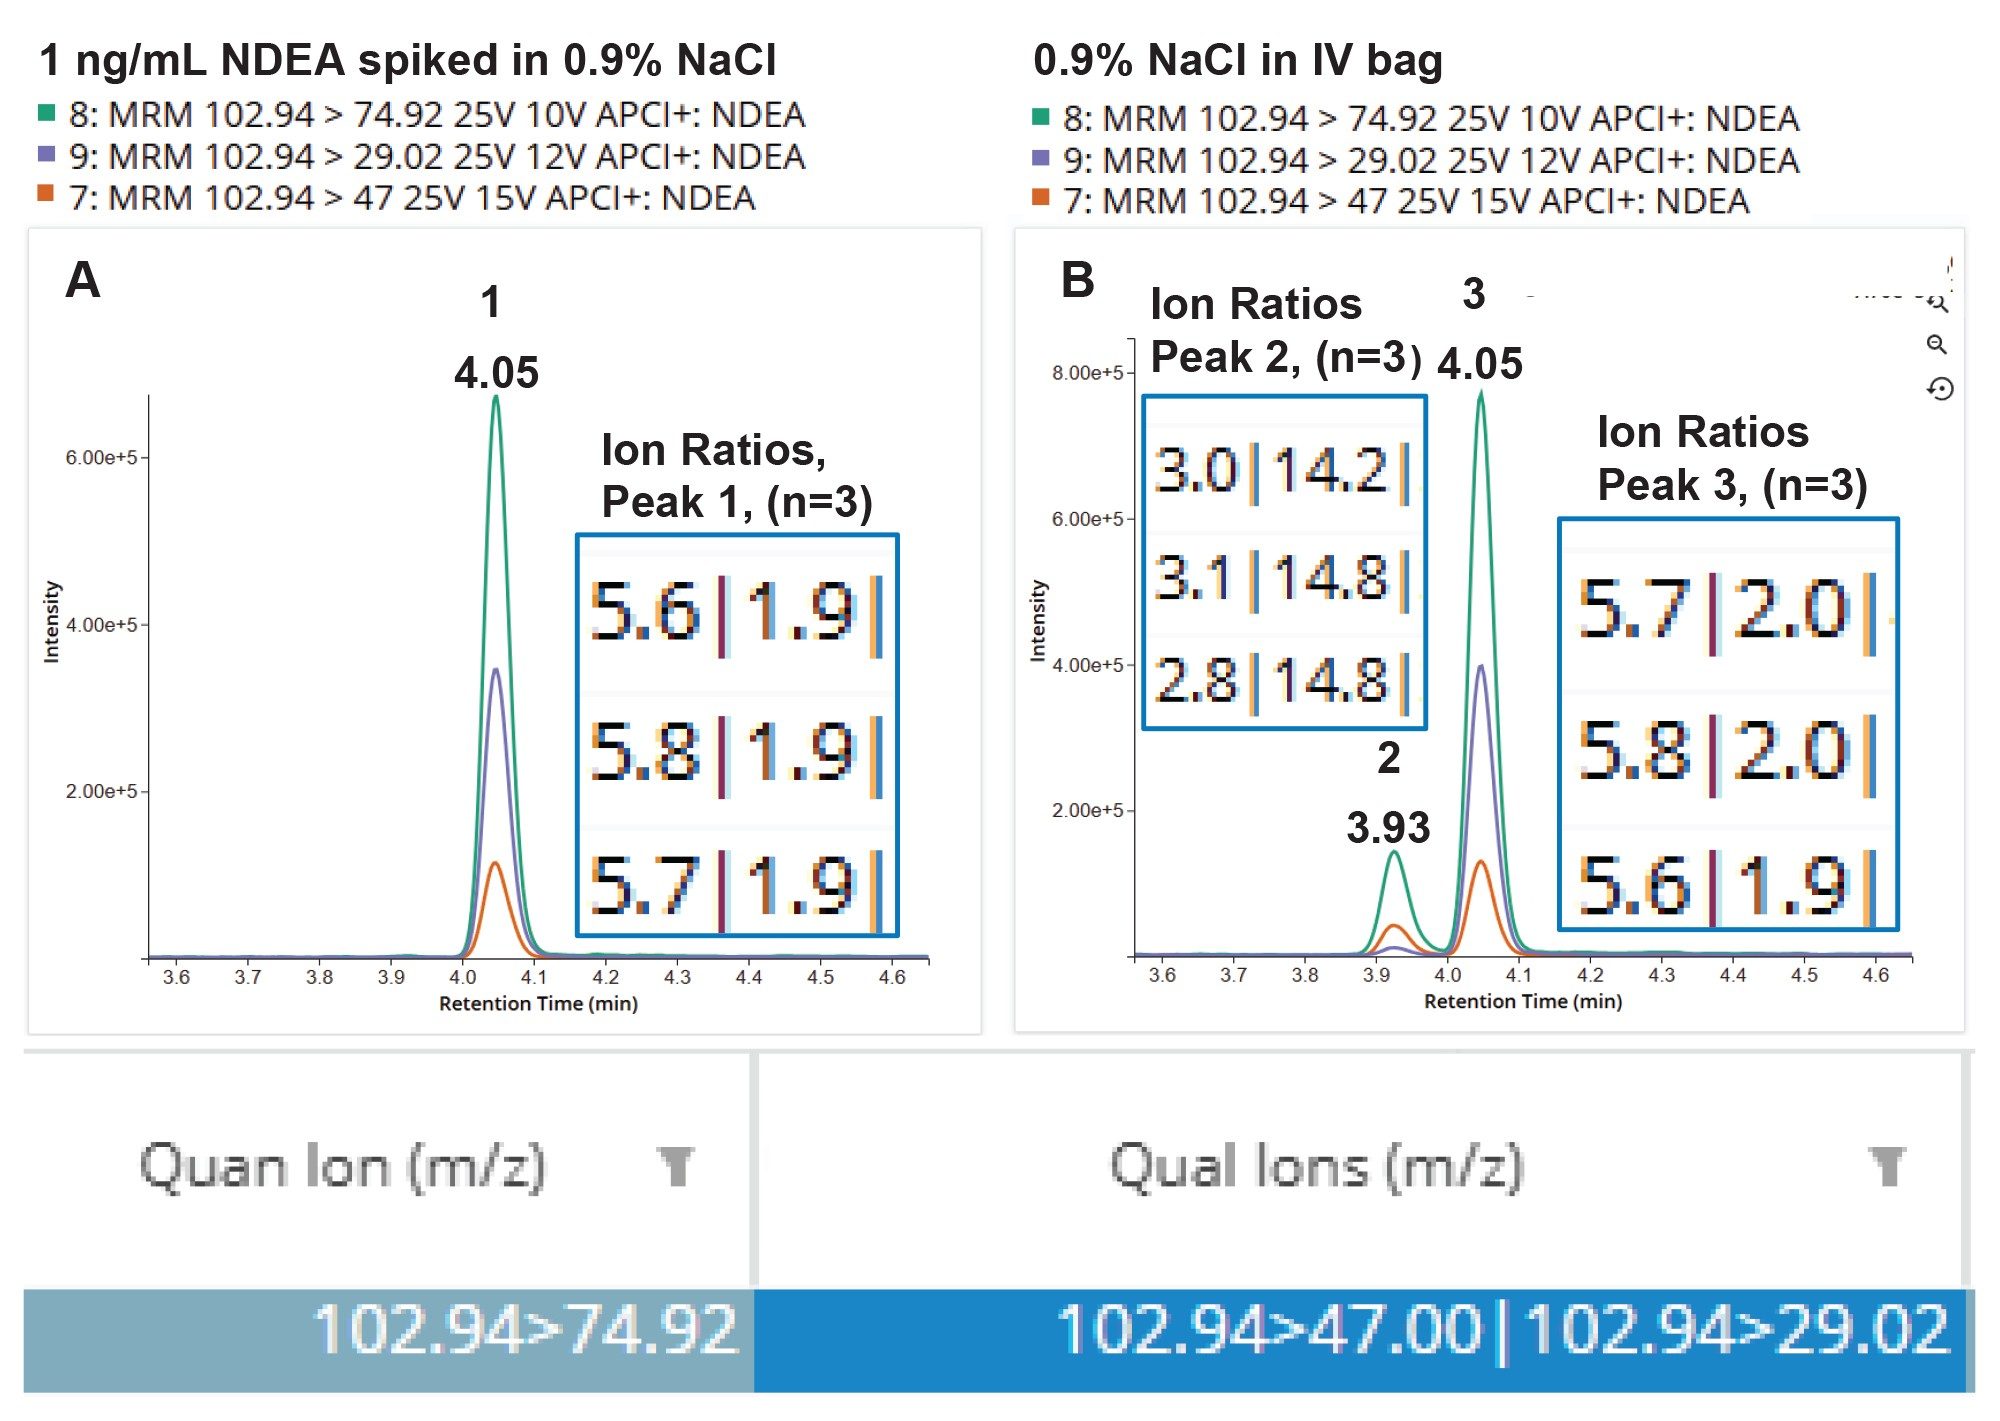
The ion ratios for peak 1 and peak 3 are comparable, adding confidence to the suspected identification of NDEA in the IV bag. The ion ratios observed for peak 2 are different. The data for ion ratios can be observed in the data summary table of the waters_connect for Quantitation Software (Figure 10).
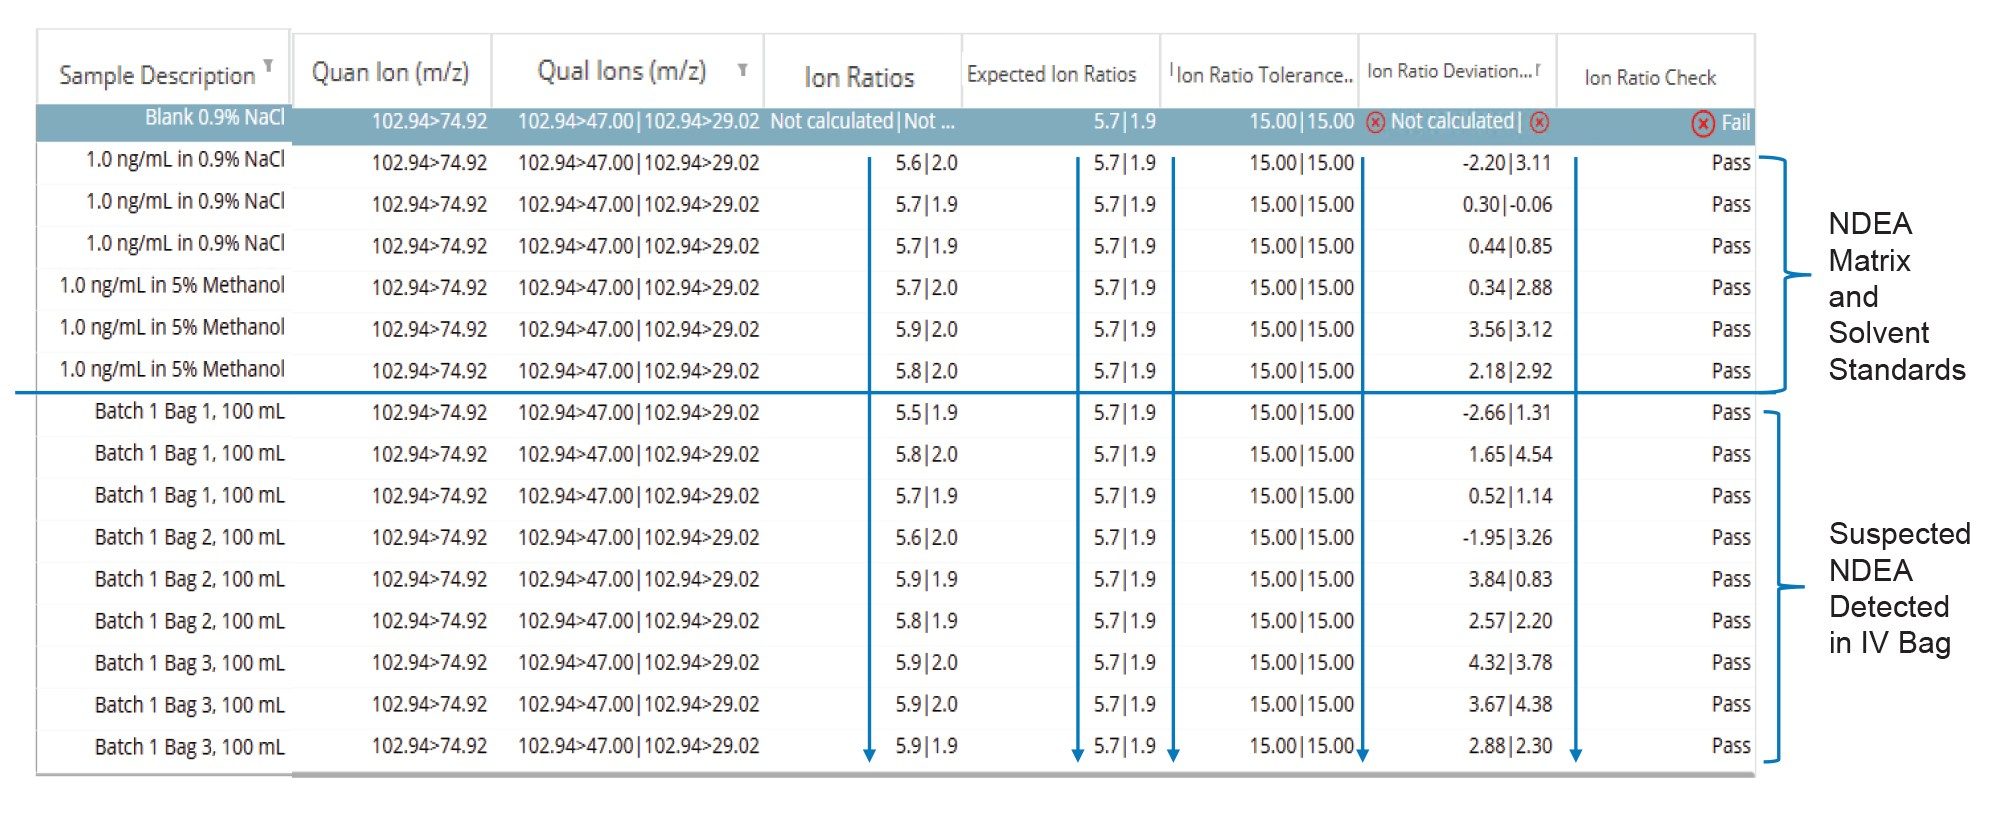
The table in Figure 10 shows the NDEA ion ratio data comparison between a 1 ng/mL NDEA matrix standard, a 1 ng/mL NDEA solvent standard and the component suspected to be NDEA detected in three separate 100 mL IV bags (injected in triplicate). As can be seen from the measured ion ratios, the expected ion ratios and their comparison in the Ion Ratio Deviation column on the top of the table, there is very good agreement between the standards and samples. The Ion Ratio check column lists whether the component passes or fails the rules, which were set to be +/- 15% of the set value. In all cases, the component suspected to be NDEA at tR 4.05 minutes, passes the rules.
Targeted MSMS of NDEA m/z 103
Additional targeted MS/MS experiments were performed to enhance confidence in the identification of the component at tR 4.05 minutes in the IV bag samples. Chromatograms from the MS/MS experiments of m/z 103 are shown in Figure 11.
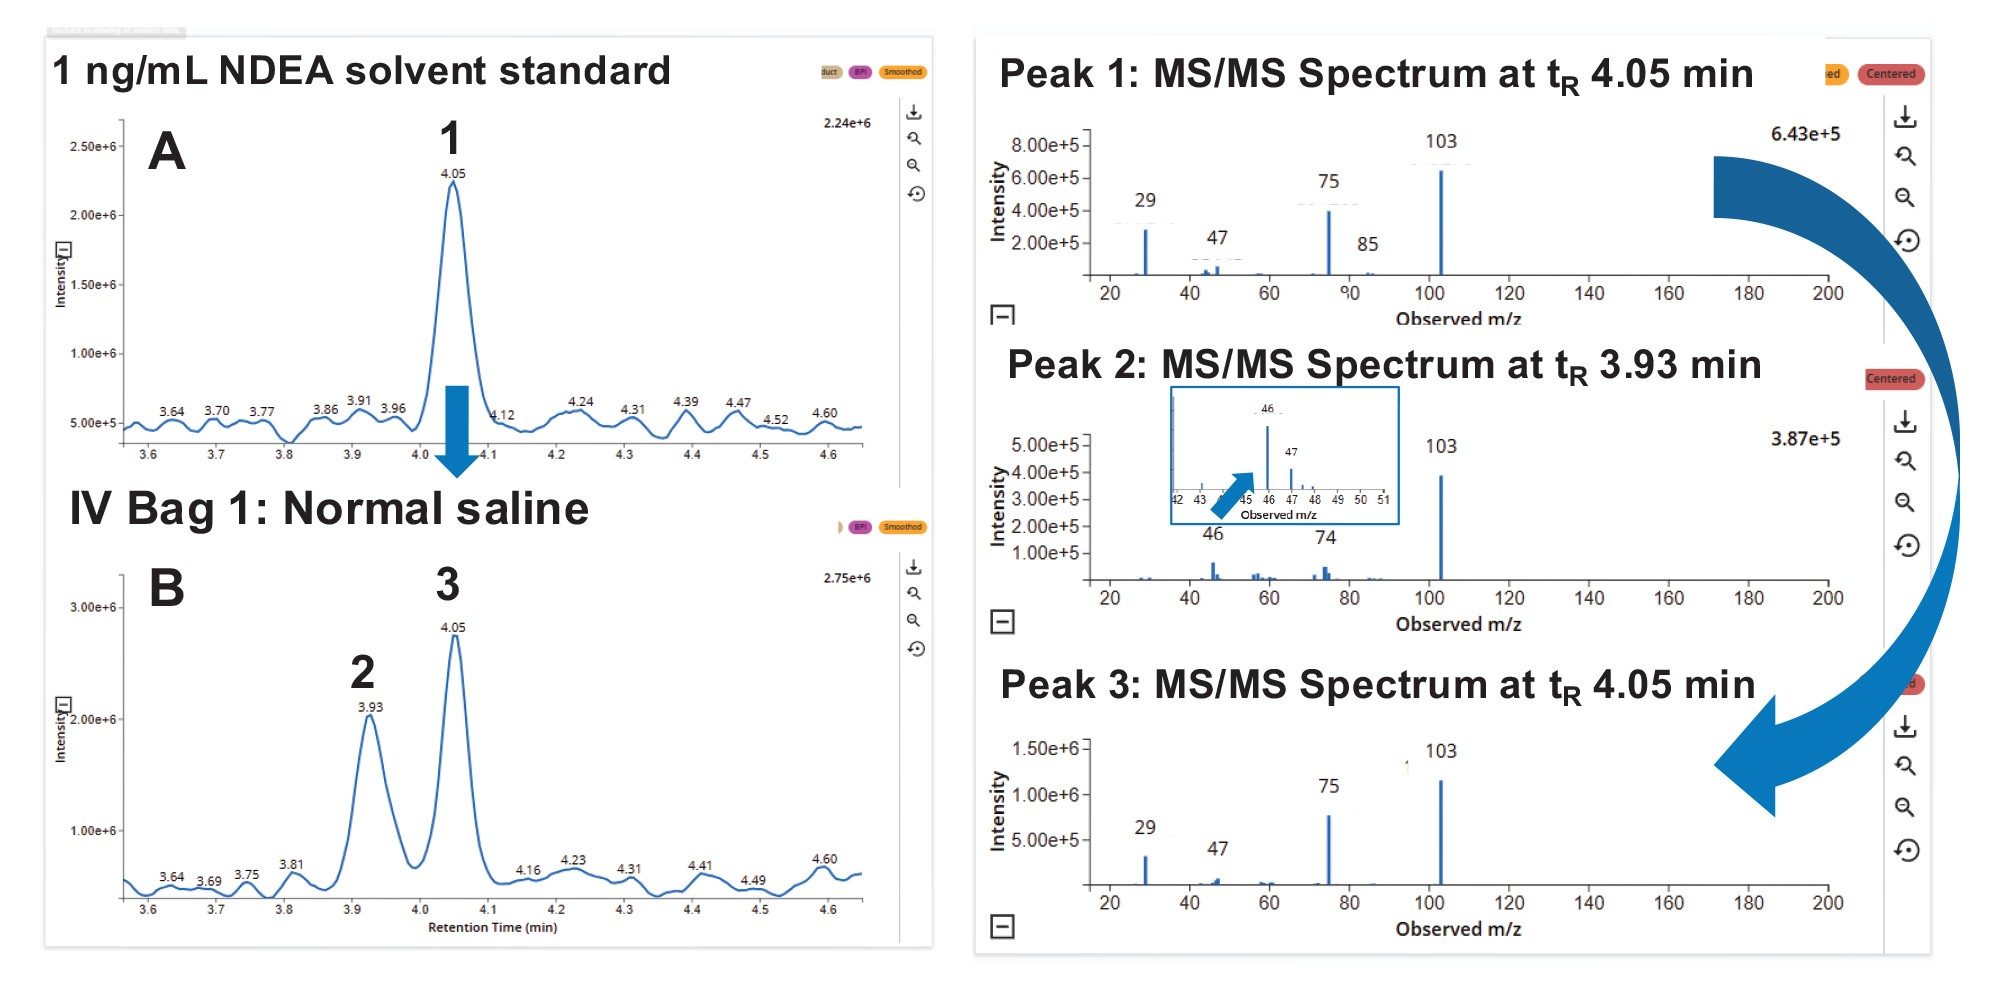
The MS/MS spectrum for the peak labeled 1 in the chromatogram (A), represents the MS/MS spectrum of an authentic NDEA standard. This spectrum matches closely with the peak at the same tR in the IV bag sample (Peak 3). However, the MS/MS spectrum of peak 2 has different fragment ratios. This data supports the ion ratio results shown in Figures 9 and 10. The samples were further analyzed using a Xevo G3 Quadrupole Time-of-Flight Mass Spectrometer,17 confirming the elemental composition of NDEA (C4H10N2O; +/- 0.1 mDa) for the component eluting at tR 4.05 minutes (data not included).
Identification of NDMA
A component eluting near the tR of NDMA (tR 2.35 minutes) and presenting signals for all NDMA MRM channels, was detected in several IV bags tested (Sample Set 1), (Figure 12). NDMA is classified as a low molecular weight nitrosamine with robust toxicological data. The recommended AI limit for NDMA is 96 ng/day (EMA and FDA).12,13
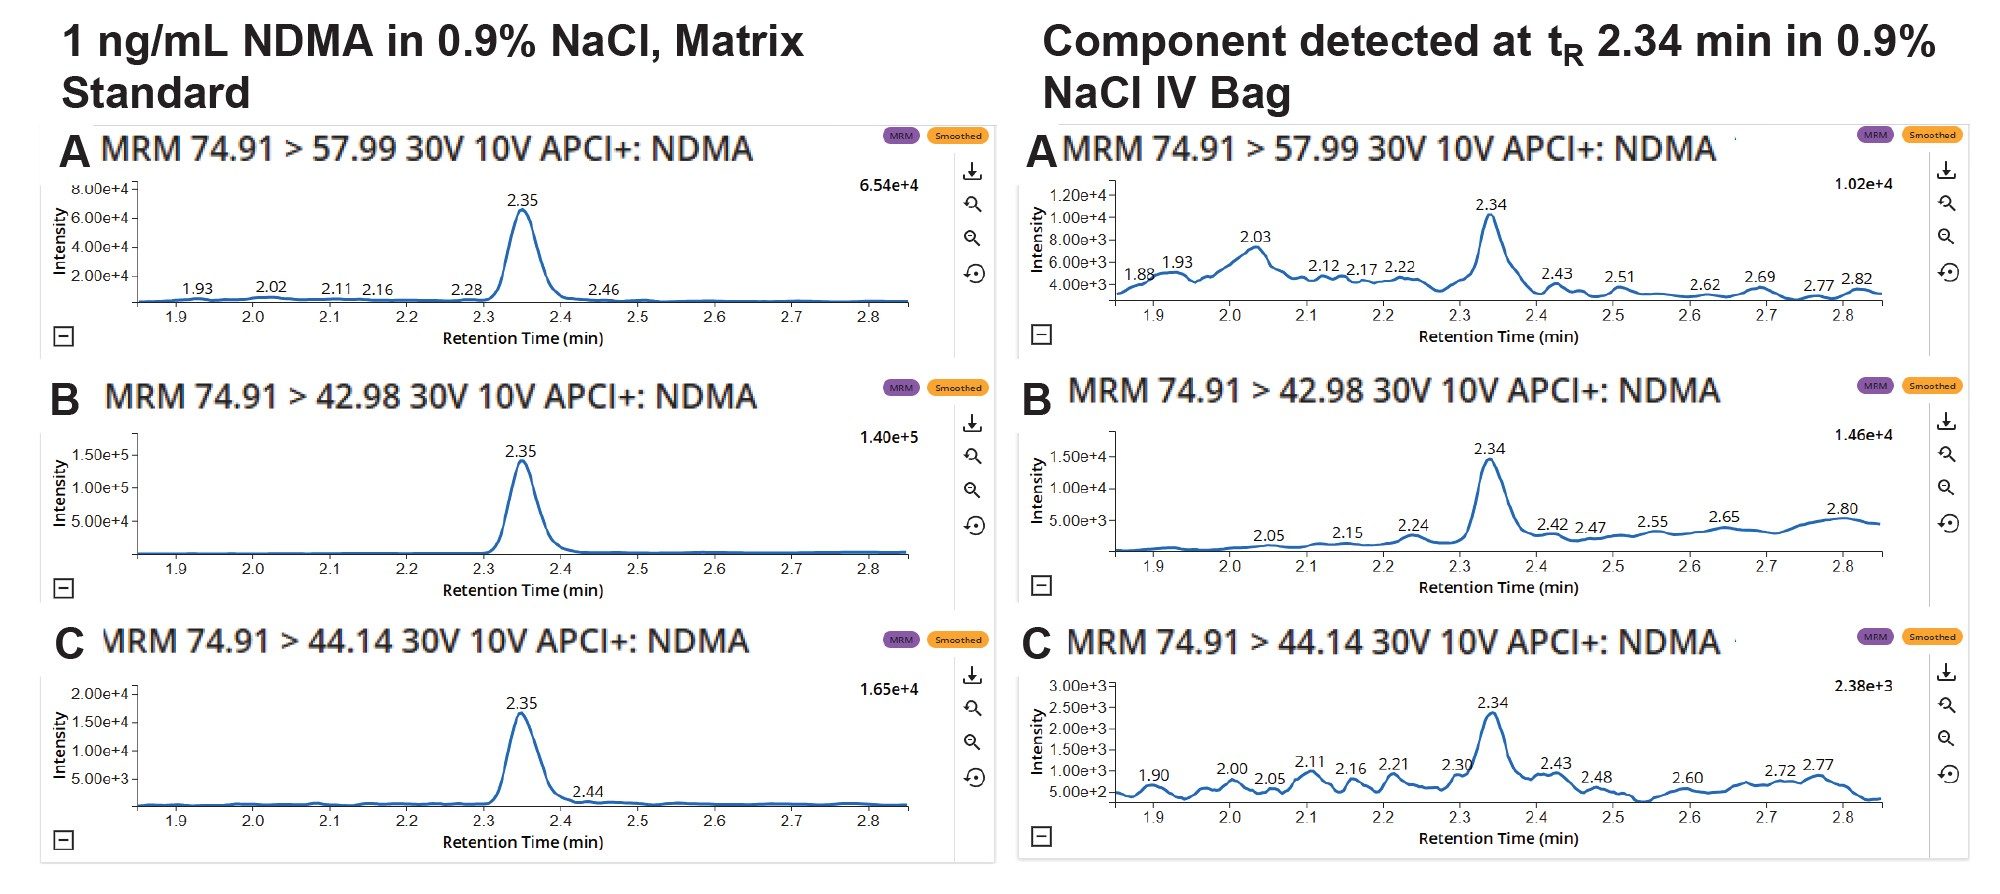
The normal saline solutions of the IV bags testing positive for NDMA and NDEA, were spiked at two concentration levels with authentic standards (0.1 ng/mL and 1 ng/mL, n=3). The calculated spike recovery ranged from 89.4–98.4 % for both compounds with CVs ranging from 3.3–6.0%. As described in FDA guidance, the use of IV infusion bags is generally categorized as less‑than‑lifetime exposure; however, certain clinical applications may involve extended treatment durations. In its announcement, CDER noted the potential use of an adjustment factor of approximately four‑ to ten fold when deriving alternative acceptable intake (AI) limits for leachable nitrosamines detected in infusion bags, relative to established lifetime AI values.8,9,18,19
The significance of the results in this preliminary study, in terms of the current nitrosamines regulations or the health risk implications, is not fully understood. Further investigation of additional study samples is necessary to draw further conclusions
Conclusion
- The developed method was used for the quantitative determination of seven nitrosamines in normal saline, demonstrating low pg/mL levels of sensitivity, and at least four orders of linear dynamic range.
- The method can perform with good precision and accuracy with minimal matrix effects.
- The use of a delay column can aid in persistent system level background interference helping to achieve the lowest detection limits possible.16
- The Xevo TQ Absolute XR Tandem Mass Spectrometer generates high‑quality LC‑MRM data for the quantitation of nitrosamines in aqueous matrices, including normal solutions contained in IV infusion bags.
- Targeted MS/MS experiments and the use of MRM ion ratio flagging provide enhanced confidence in identified compounds.
- The seven nitrosamines were not detected in a batch of normal saline IV bags (Sample Set 2) obtained with authorization from a pharmacy supply chain and tested using the described methodology (n=6).
This application note illustrates an analytical approach for the detection and quantitation of nitrosamines using Waters LC‑MS/MS instrumentation. It is intended for informational purposes only and does not constitute regulatory guidance, toxicological assessment, or assurance of regulatory compliance. Laboratories are responsible for method validation and determining suitability for their specific regulatory and quality requirements.
References
- Moser, J.; Schlingemann, J.; Saal, C. N-Nitrosamines Impurities in Pharmaceuticals - The Abrupt Challenges that Resulted, the Evolving Science, and the Regulatory Framework. Journal of Pharmaceutical Sciences 2023, 112 (5), 11611162. DOI: https://doi.org/10.1016/j.xphs.2023.01.016.
- Teasdale, A.; Moser, J.; Ford, J. G.; Creasy, J. N -Nitrosamines. In Mutagenic Impurities, Teasdale, A. Ed.; Wiley, 2021; pp 269–320.
- Bharate, S. S. Critical Analysis of Drug Product Recalls due to Nitrosamine Impurities. Journal of Medicinal Chemistry 2021, 64 (6), 2923–2936. DOI: 10.1021/acs.jmedchem.0c02120.
- Schlingemann, J., et al. (2023). "The Landscape of Potential Small and Drug Substance Related Nitrosamines in Pharmaceuticals." Journal of Pharmaceutical Sciences 112(5): 1287–1304.
- Holzgrabe, U. Nitrosated Active Pharmaceutical Ingredients - Lessons Learned? J Pharm Sci 2023, 112 (5), 1210–1215. DOI: 10.1016/j.xphs.2023.01.021 From NLM.
- Control of Nitrosamine Impurities in Human Drugs | FDA.
- Scientific review on the risk of nitrosamine impurities in human medicines | European Medicines Agency (EMA).
- ICH M7(R2) Guideline on assessment and control of DNA reactive (mutagenic) impurities in pharmaceuticals to limit potential carcinogenic risk.
- August 18, 2025: Emerging Scientific and Technical Information on Leachable NDBA and Other Small-Molecule Nitrosamines in Infusion Bags.
- Karen Pieters Testing of packaging systems for large volume parenterals extractables study Design and challenges.
- Golob, N., et al. (2022). "Nitrocellulose blister material as a source of N-nitrosamine contamination of pharmaceutical drug products." International Journal of Pharmaceutics 618: 121687.
- Nitrosamine impurities: guidance for marketing authorisation holders. Appendix 1: Acceptable intakes established for N-nitrosamines, appendix-1-acceptable-intakes-established-n-nitrosamines_en.xlsx.
- CDER Nitrosamine Impurity Acceptable Intake Limits. CDER Nitrosamine Impurity Acceptable Intake Limits | FDA.
- ACQUITY Premier HSS T3 Column | 186009468 | Waters.
- Suggested approaches for minimizing background chemical noise in low mass MRM Transitions for trace level quantification of N-Nitro.
- Twohig, M., The Use of a Delay Column to Mitigate Persistent Contaminant Peaks in the Trace Level Quantitation of NDBA in Normal Saline (0.9% NaCl) IV Infusion bags using UHPLC-MS/MS. Waters Application Note. 720009311, May 2026.
- Xevo G3 QTOF Mass Spectrometry System | Waters.
- Felter, S. P., et al. (2025). "Evaluating the lifetime cumulative dose as a basis for carcinogenic potency of nitrosamines – a key tenet underpinning less-than-lifetime approaches for establishing acceptable intake limits." Regulatory Toxicology and Pharmacology 162: 105903.
- Wills, J. W., et al. (2026). "Mutagenic and carcinogenic potency determinations for NDMA support the cumulative dose assumption underpinning the less-than-lifetime Threshold of Toxicological Concern." Archives of Toxicology.
720009335, May 2026