Investigating Drug Metabolism of Methapyrilene Within a Rat Model Using a Data Dependent Acquisition Workflow with the Xevo MRT Mass Spectrometer
Lee A. Gethingsa, Richard Locka, Susan Abatiellob, Jennifer Seymourc, Terri Sosienskic, Jeff Finchc, Jeremy Feltonc, Donald Laudicinac, Robert S. Plumbc, Ian D. Wilsond
aWaters Corporation, Wilmslow, United Kingdom
bImmerse™ Lab, Cambridge, MA, United States
cWaters Corporation, Milford, MA, United States
dImperial College, London, United Kingdom
Published on September 03, 2025
Abstract
Methapyrilene (MP), N,N-dimethyl-N'-pyridin-2-yl-N'-(thiophen-2-ylmethyl) ethane-1, 2-diamine, is a 2-thiophene-based H1-receptor antagonist and has been attributed to drug induced liver injury (DILI).1 MP has been shown to produce cytotoxicity, which is associated with oxidative stress and mitochondrial damage.2 The generation of chemically reactive drug metabolites from bioactivation of the MP thiophene ring are attributed as the cause of toxicity. Additionally, MP also undergoes a variety of conversions to produce a range of metabolites via demethylation, such as N-oxidation and O-glucuronidation.
Benefits
- Demonstration of the Waters™ Xevo™ MRT Mass Spectrometer (MS) workflow for the analysis of urine extracts from a drug dosed study, involving methapyrilene.
- Data dependent acquisition (DDA) has been used for data collection, providing highly informative fragmentation data to confidently identify drug metabolites of interest.
- Combining a DDA approach with high-throughput chromatography is shown to consistently yield high quality spectra, providing highly confident compound identifications.
- A seamless workflow allowing drug metabolites to be confidently identified is demonstrated with the UNIFI™ Application within the waters_connect™ Software Platform
Introduction
The introduction of the Xevo MRT Mass Spectrometer allows for comprehensive drug metabolite identification (Met ID) at high acquisition speed. Using urine samples collected over a time course of six days, the excellent mass accuracy, high mass resolution, and sensitivity are highlighted, which can be achieved for drug metabolism studies. DDA provides highly specific MS/MS information, which assists with structural elucidation. The speed at which DDA data can be acquired with the Xevo MRT Mass Spectrometer can be as fast as 50 and 100 Hz, MS, and MS/MS respectively. Combined with fast chromatographic methods, this fast data acquisition rate allows for highly informative, confident data in a high-throughput fashion.
Experimental
Study Overview
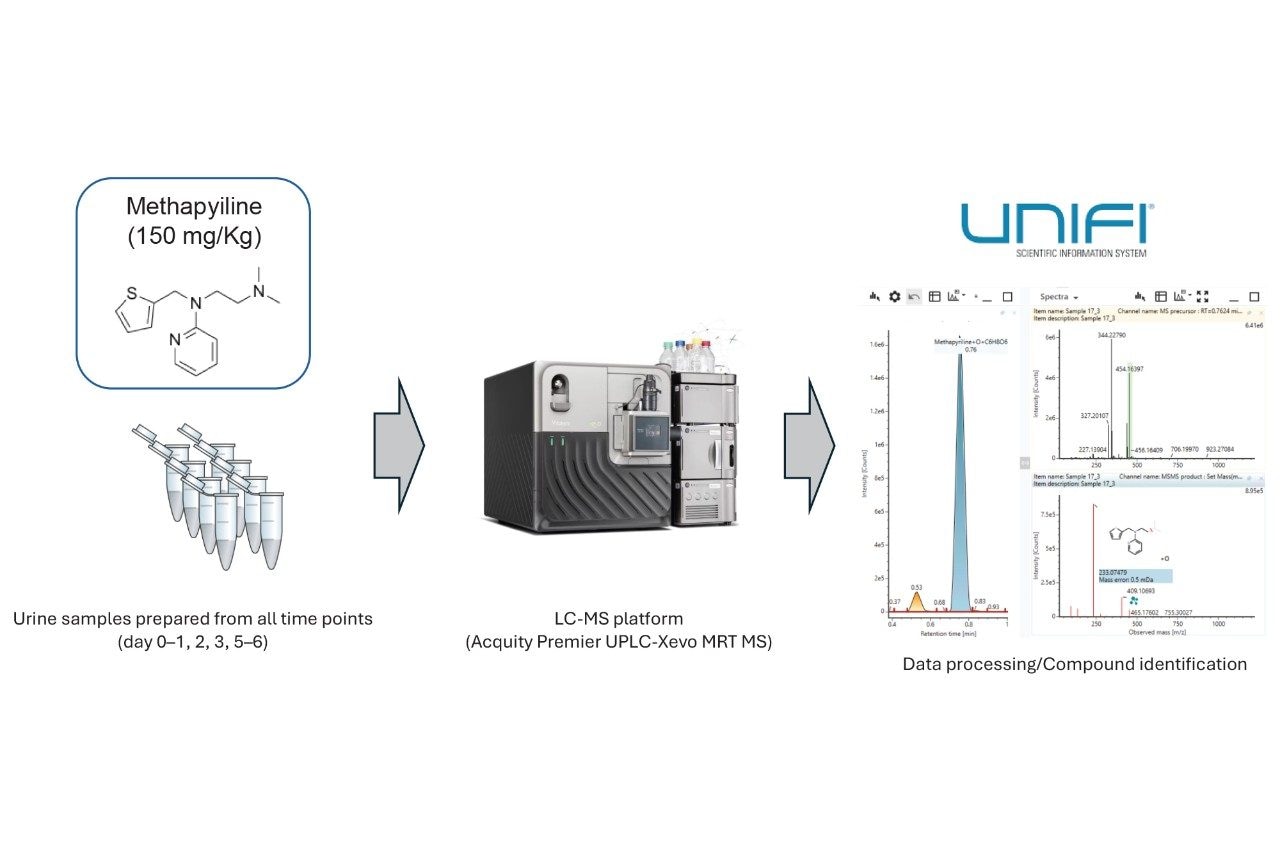
Wistar rats (n=18) were dosed with MP formulated at either 0, 5 or 15 mg/mL (vehicles) for a 150 mg/Kg dose group. MP was administered orally (PO) once/day by gavage for 5 days at 10 mL/Kg. Urine was collected over a 16-hour period on pre-dose (day 0–1), day 2, day 3, and from day 5 to day 6. The MP dosing studies were all conducted at Evotec SAS (Toulouse, France). Ethics were based according to National and EU guidelines.
Sample Preparation for LC-MS
Urine samples were first protein precipitated using 10 µL urine with 40 µL ACN:MeOH (90:10 v/v). Samples were then vortexed prior to storing at -20 °C for 2 hours. Following incubation, samples were further vortexed and centrifuged at 25000 g for 5 minutes. The resulting supernatant was then diluted 1:5 (v/v) with distilled water and transferred to LC-MS total recovery vials (p/n: 186002805).
LC-MS Data Acquisition
LC-MS data were collected using an ACQUITY™ Premier UPLC™ System coupled to a Xevo MRT Mass Spectrometer. The reversed-phase (RP) chromatographic separation consisted of a 5.0 minute method (injection to injection) using a CORTECS™ C18, 1.6 µm, 2.1 x 50 mm analytical Column (p/n: 186007114). The LC solvents were comprised of mobile phase A (0.1% formic acid containing 1 mMol ammonium formate) and mobile phase B (95:5 ACN:Water (v/v), 0.1% formic acid, 1 mMol ammonium formate) being ramped from 50% to 99% over 5 minutes using a flow rate of 0.6 mL/minute. The gradient started from 0.1% to 15% (mobile phase B) over 1.5 minutes, 50% at 3 minutes and 99% at 4 minutes. The solvent composition was held at 99% (mobile phase B) for 0.5 minutes and re-equilibration at initial conditions by 5 minutes, ready for the subsequent injection.
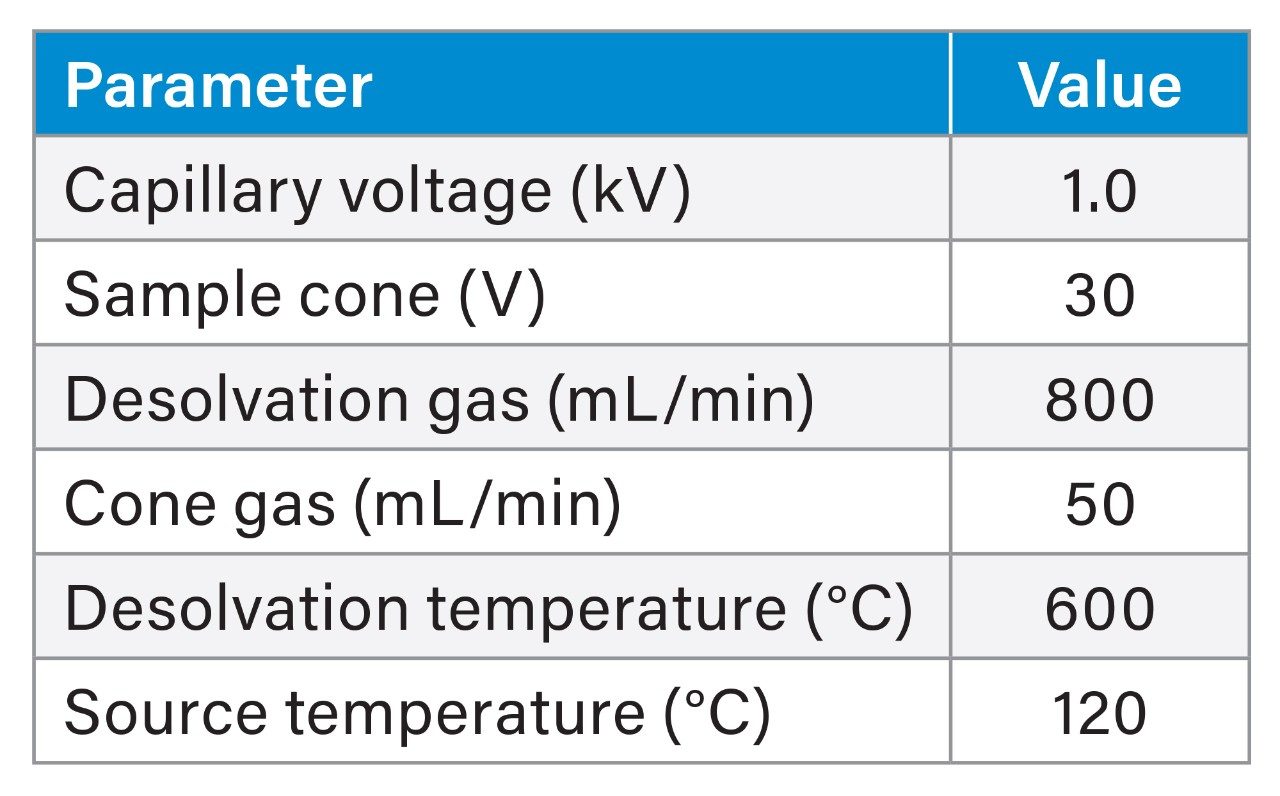
The Xevo MRT Mass Spectrometer was configured with the source settings as outlined in Table 1. MS data were collected using DDA mode of operation, which consisted of scan rates of 20 Hz (MS) and 50 Hz (MS/MS). The number of components selected for MS/MS were eight with a dynamic exclude applied of 10 mDa with a 10 second retention time tolerance.
Data Processing
The acquired data were processed using the UNIFI Application within the waters_connect Software Platform. Data were peak picked and screened against a compound database containing MP metabolites and their associated fragments. A mass tolerance of 1 ppm for both MS and MS/MS were applied.
Results and Discussion
Data were acquired for all the rat urine samples using the Xevo MRT Mass Spectrometer, operated in DDA mode. The subsequent data were peak picked and normalized using the UNIFI Application (Figure 1).
A representative chromatogram of a single time point (day 5) is shown in Figure 2, highlighting the sample complexity and ability to adequately separate peaks of interest with a gradient less than 5 minutes using UPLC methodology. Example MP metabolites are also presented as overlaid extracted ion chromatograms (XIC), which include dihydroxylation and O-glucuronidation.
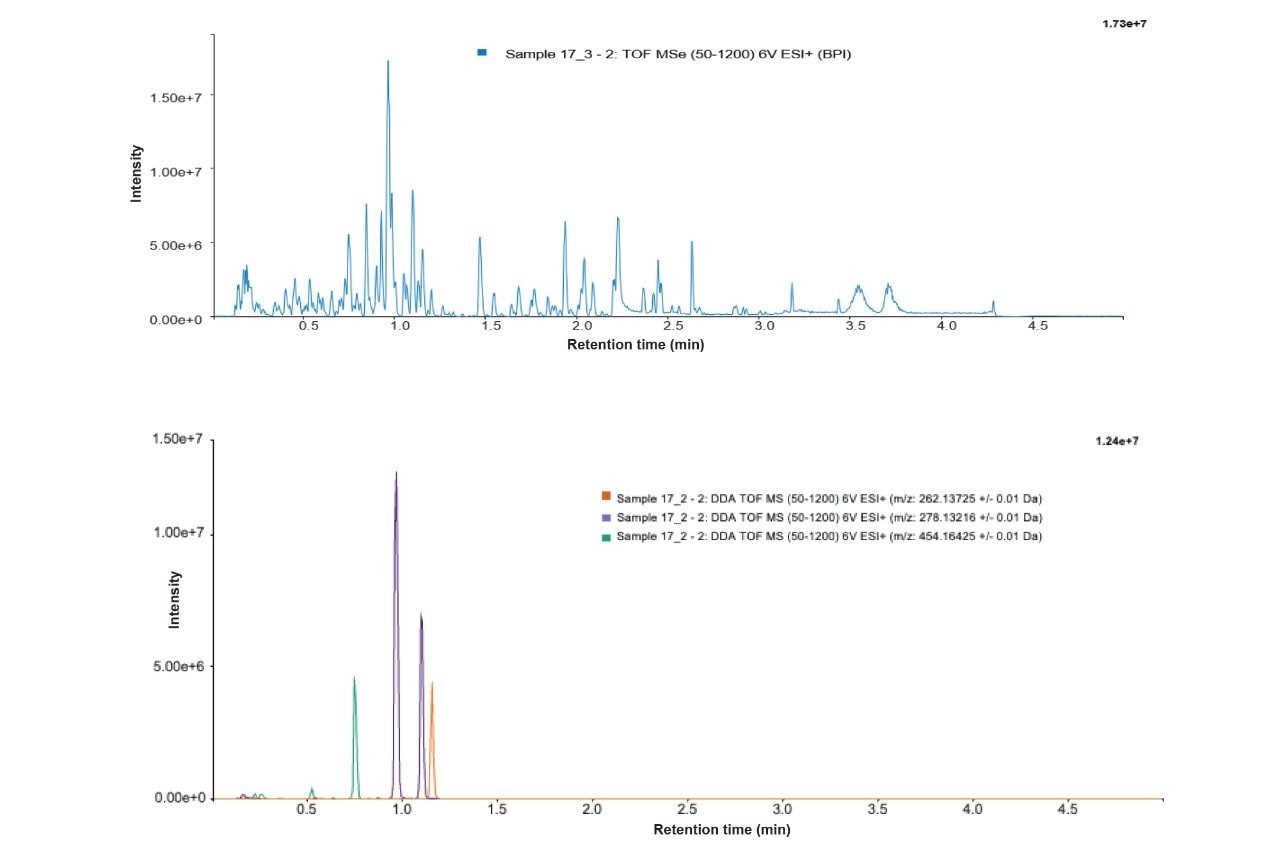
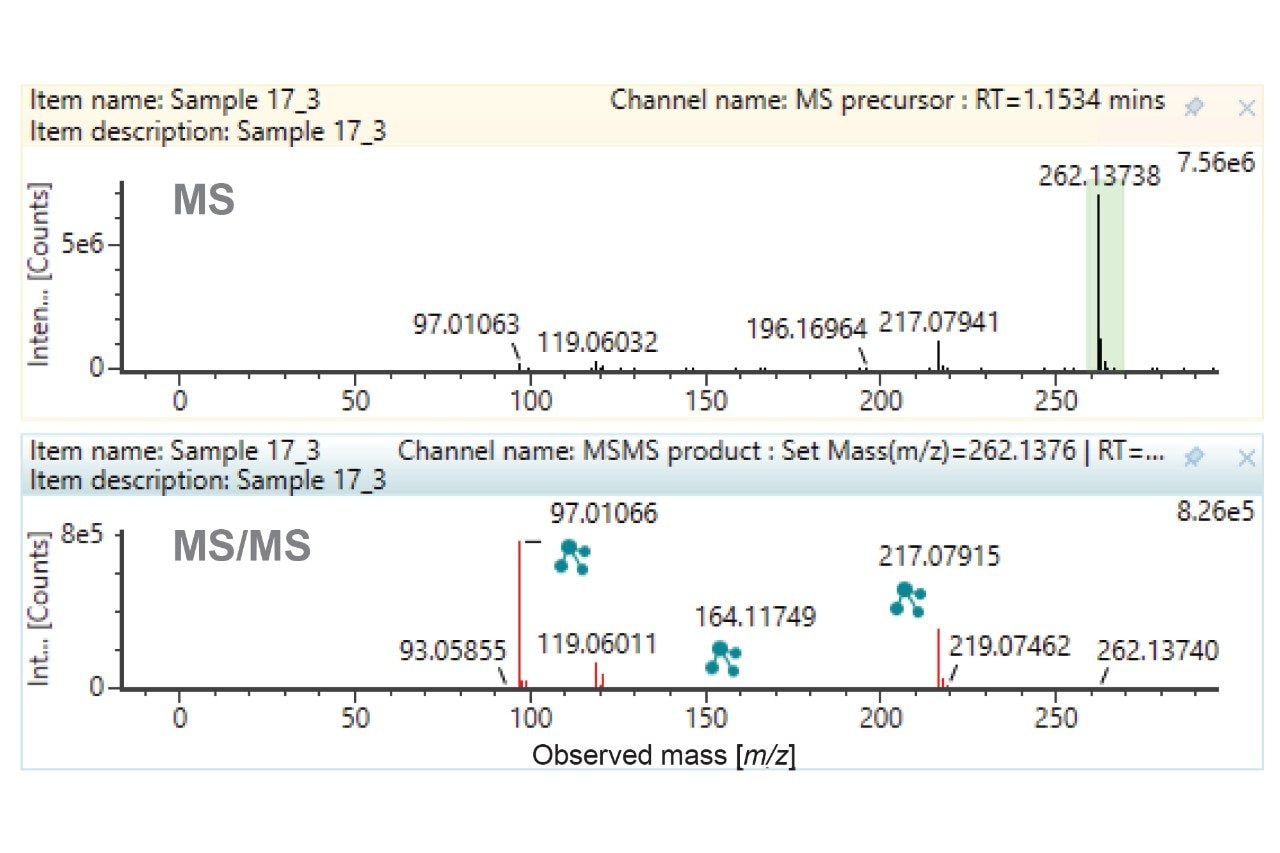
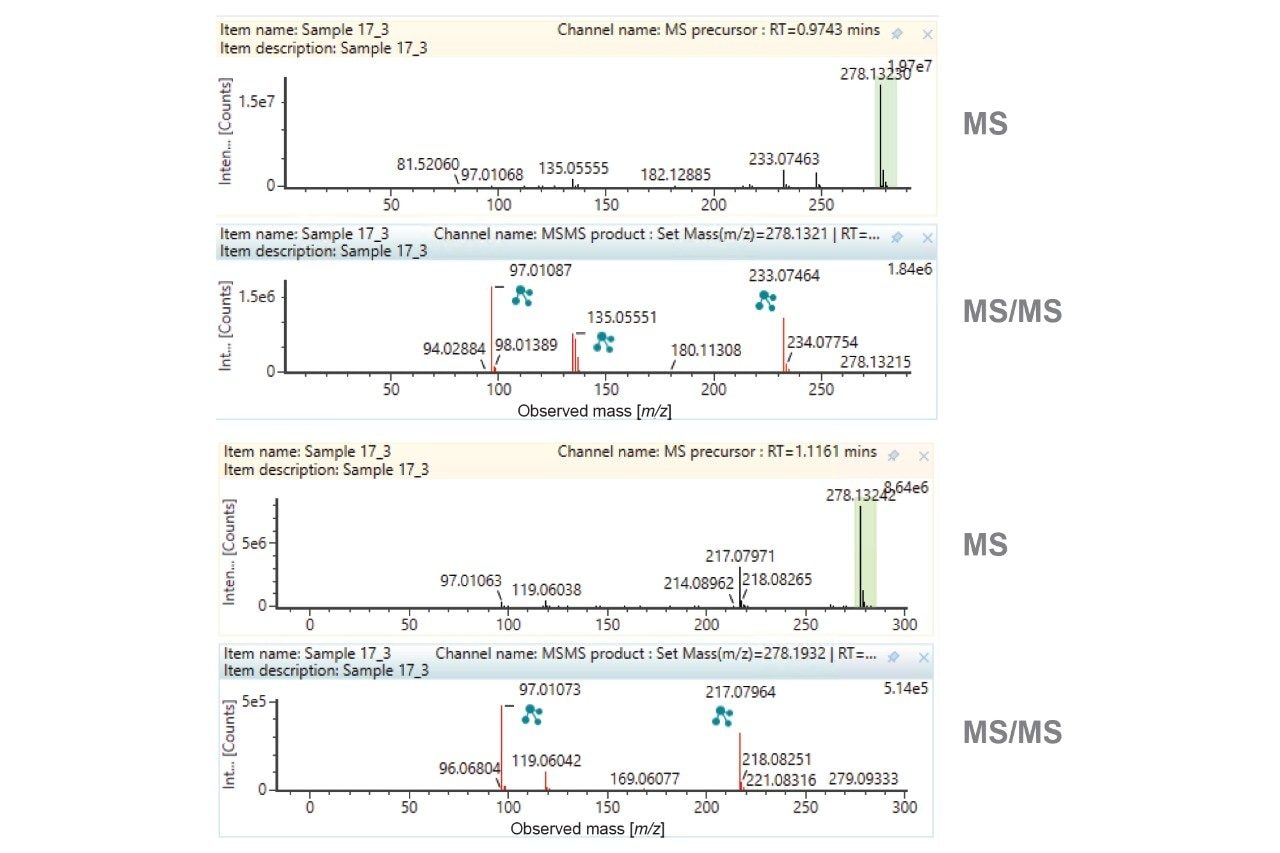
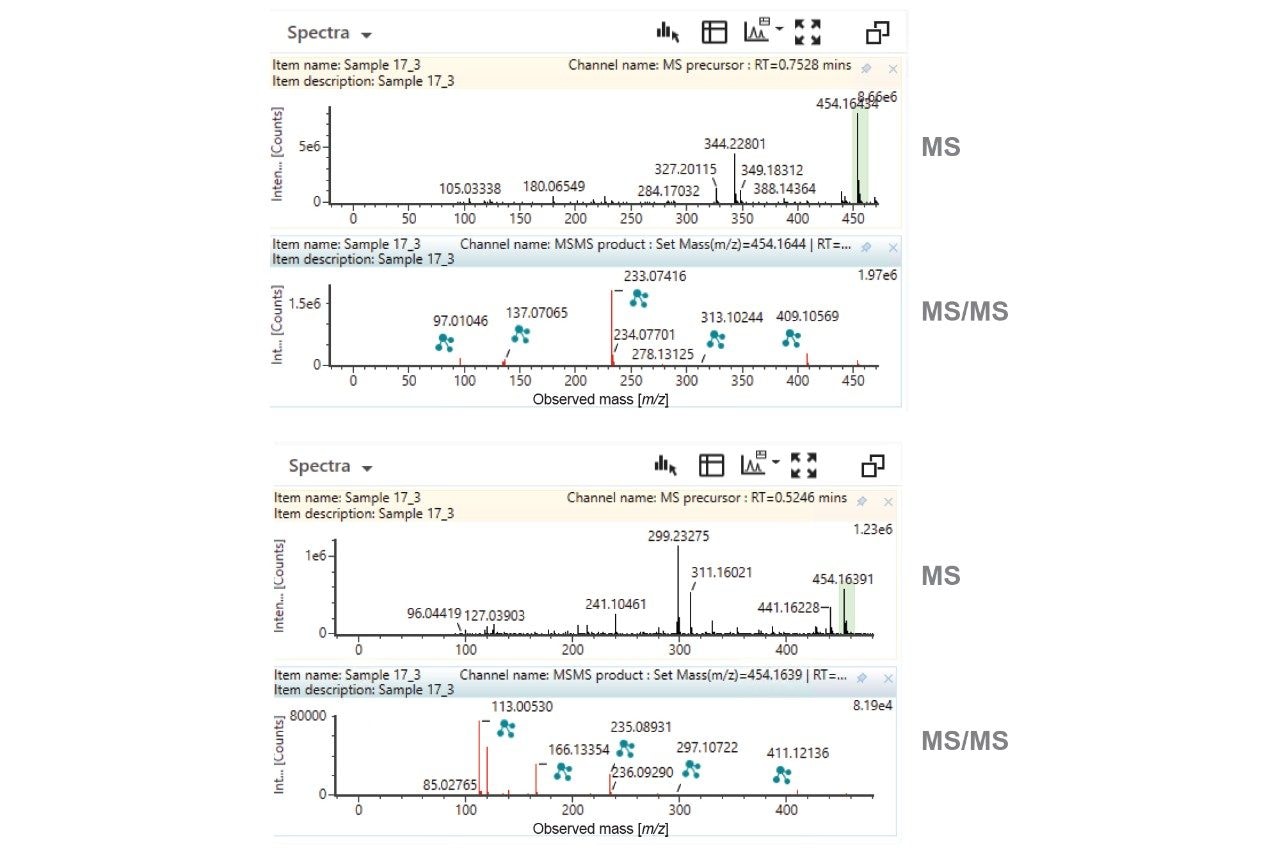
Closer investigation of the XICs reveals that there are two potential O-glucuronide metabolites and two dihydroxylations. Representative MS and MS/MS spectra for the MP substrate, O-glucuronide and dihydroxylations, are provided as Figures 3–5.
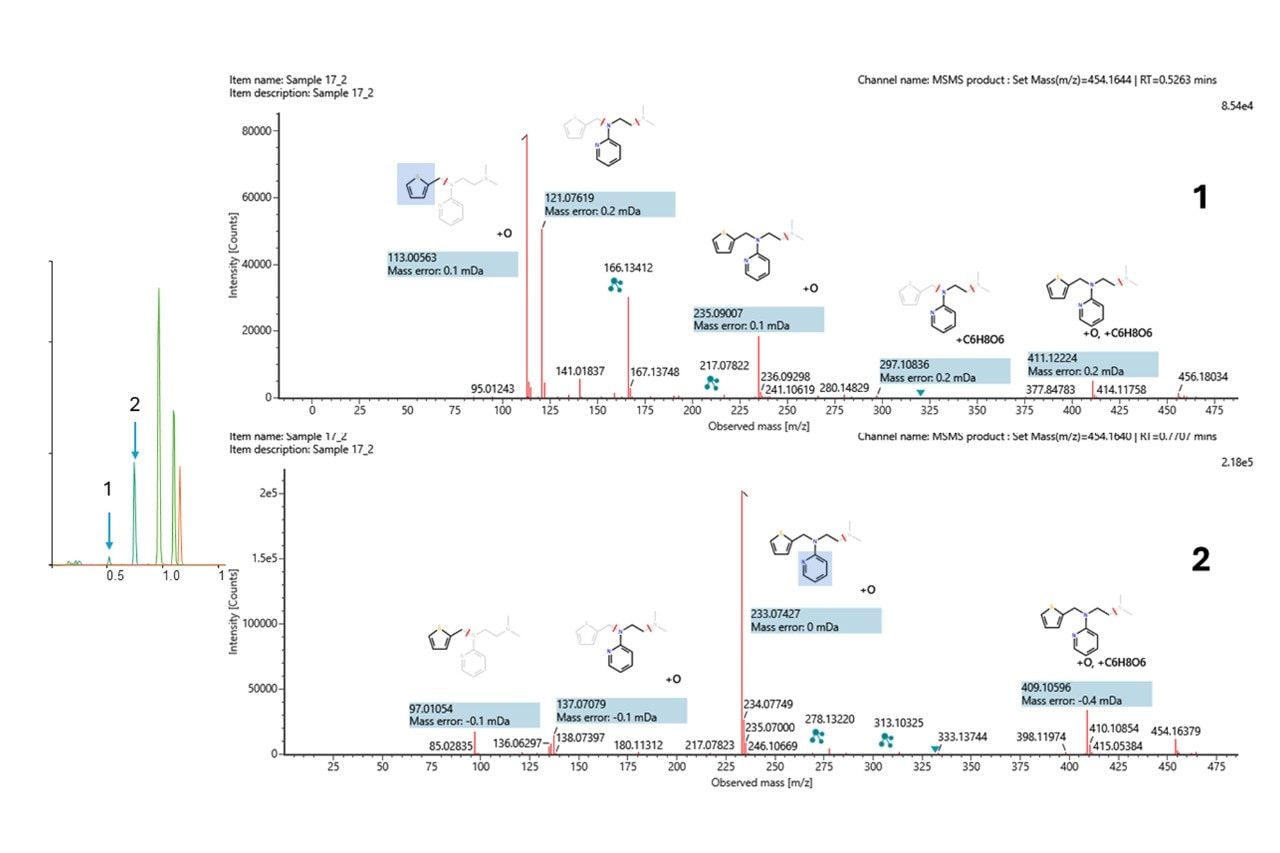
The O-glucuronide metabolites appear as a minor and major component based on the XICs. Reviewing the fragment ion spectra corresponding to both peaks (Figure 6), the high coverage of fragments and excellent mass accuracy enabled confident elucidation with clear differentiation of the localization. The minor component (tR=0.52 min) represents metabolism on the thiophene ring, while the major component (tR=0.75 min) relates to metabolism on the pyridine ring. The mass errors of the fragment ions when compared with theoretical values were less than 500 ppb.
Conclusion
LC-MS analysis of urine collected over a time course following administration of the drug methapyrilene, has been demonstrated using a DDA approach with the Xevo MRT Mass Spectrometer. MP undergoes complex biotransformation to provide a variety of metabolites. Utilizing a DDA workflow provides detailed, clean fragment ion spectra for confident structural elucidation. The additional benefit of sub ppm mass accuracy provides definitive identification(s). Integrating fast chromatography allows for high-throughput analyses while maintaining high resolution and mass accuracy.
References
- Graichen et al. Effects of methapyrilene on rat hepatic xenobiotic enzymes and liver morphology. Fundam. Appl. Toxicol. 1985 5, 165–174.
- Ratra et al. Effects of induction and inhibition of cytochrome P450 on the hepatotoxicity of methapyrilene. Toxicol. Sci., 1998 46, 185–196.
Featured Products
720009001, September 2025