Charge Variant Characterization of Innovator and Biosimilar Drugs with MauriceFlex™ and BioAccord™ LC-MS System

Abstract
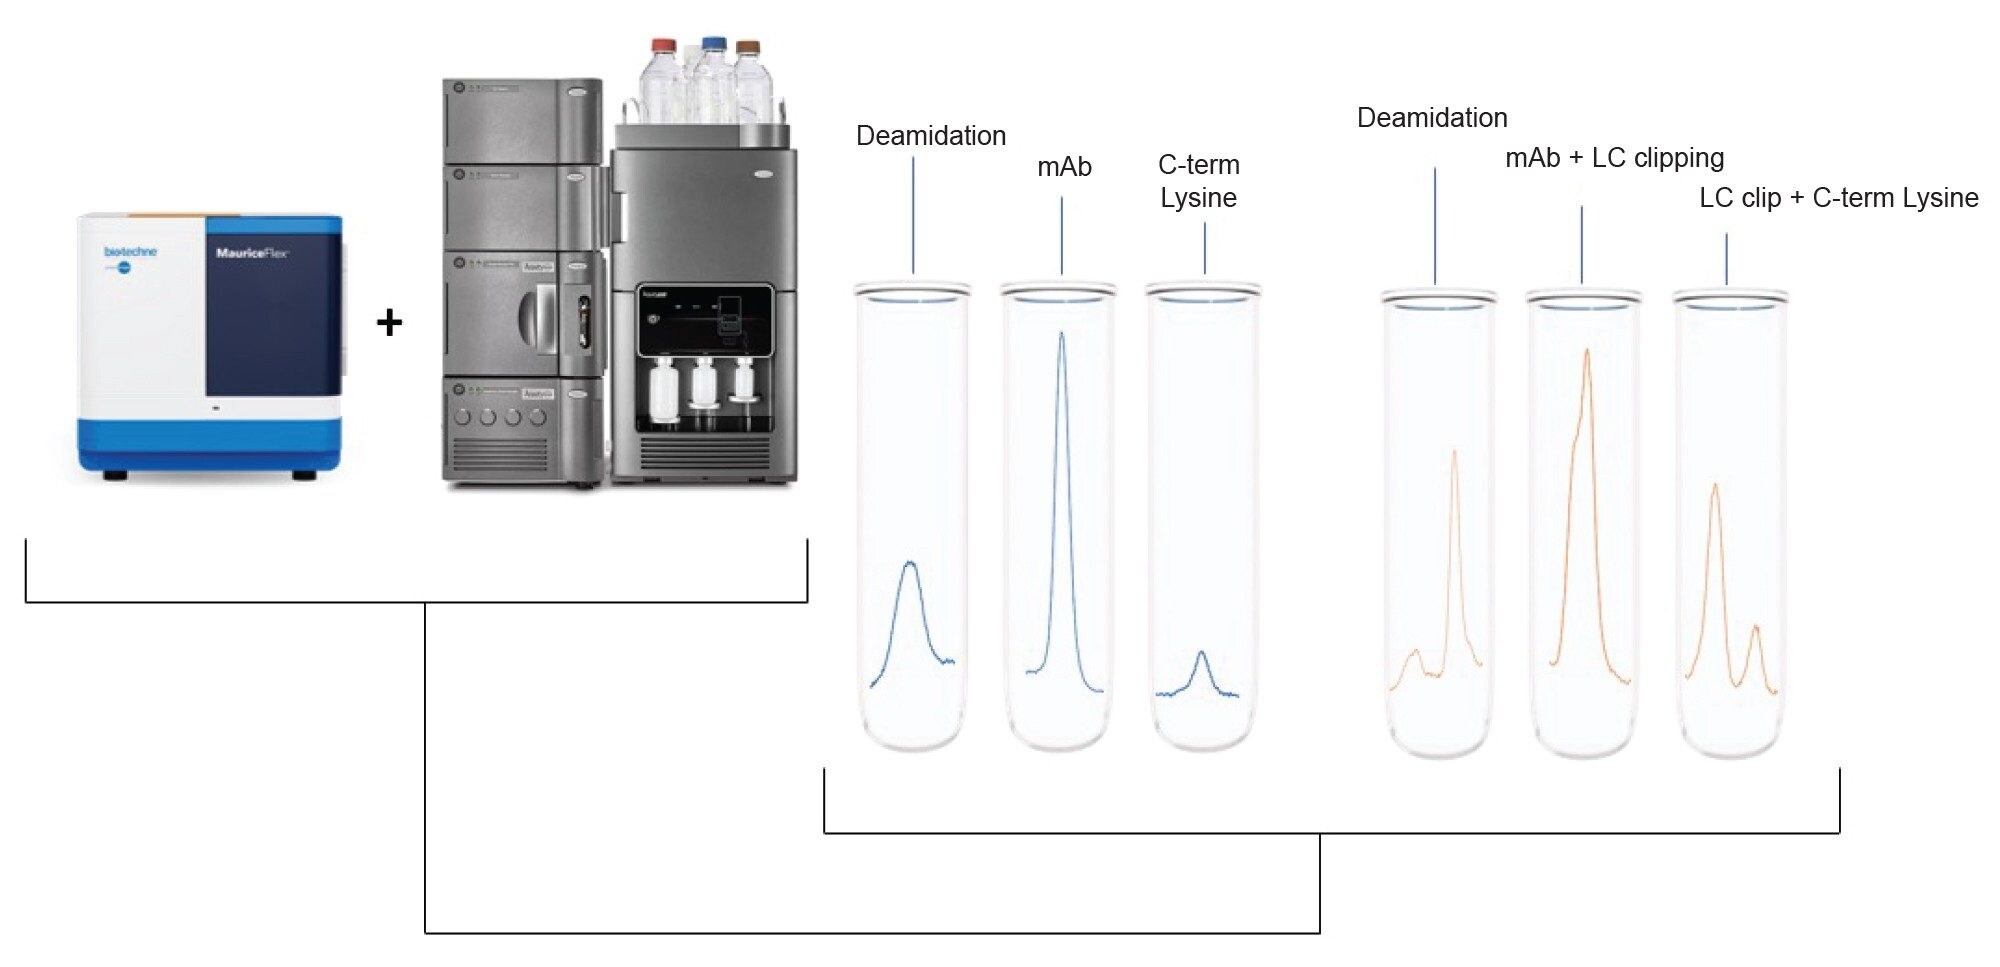
This application note showcases an in-depth comparative analysis of charge variants of a therapeutic monoclonal antibody and a research-grade biosimilar. Imaged capillary isoelectric focusing (icIEF)-based charge separation and fractionation was achieved on the MauriceFlex System, where a single run was sufficient to collect fractions for further analysis. Subsequent LC-MS analysis with the BioAccord System was conducted without additional sample preparation, revealing critical differences between the innovator and biosimilar, such as light chain fragmentation at specific sites and the presence of C-terminal lysine residues. The use of the MauriceFlex and BioAccord System presents a straightforward and time-saving workflow for the characterization of biotherapeutics.
Introduction
The lack of proper analytical tools for separating and characterizing charge variants in monoclonal antibodies (mAbs) has been a significant challenge. icIEF, while the gold standard for charge separation, is limited to optical detection. Additionally, it cannot be easily used with mass spectrometry (MS) due to reagent incompatibility.1,2 The MauriceFlex System addresses this limitation by enabling charge-based separation and collection of charge variant fractions that are compatible with LC-MS, allowing for detailed mass characterization without additional sample preparation.
In this study, the innovator drug Benlysta™ (belimumab) and a research-grade biosimilar were analyzed using this approach. In the context of commercial drug development, regulatory agencies, such as the U.S. Food and Drug Administration (FDA), require evidence of structural and functional comparability between an innovator and biosimilar.3 Although this study did not use a therapeutic biosimilar (and the results obtained may not be clinically relevant), the choice of techniques used throughout demonstrates an efficient workflow. The BioAccord System, a user-friendly compact benchtop time-of-flight (TOF) instrument, provided high-quality LC-MS data and automated data processing via the INTACT Mass App on the compliance-ready waters_connect™ Informatics Platform.
The workflow demonstrated how charge variant fractions collected on the MauriceFlex System were directly analyzed on the BioAccord System, successfully identifying the proteoforms responsible for charge profile differences between the innovator and biosimilar. This approach highlights the effectiveness of the MauriceFlex and BioAccord systems for detailed comparative analysis.
Materials and Methods
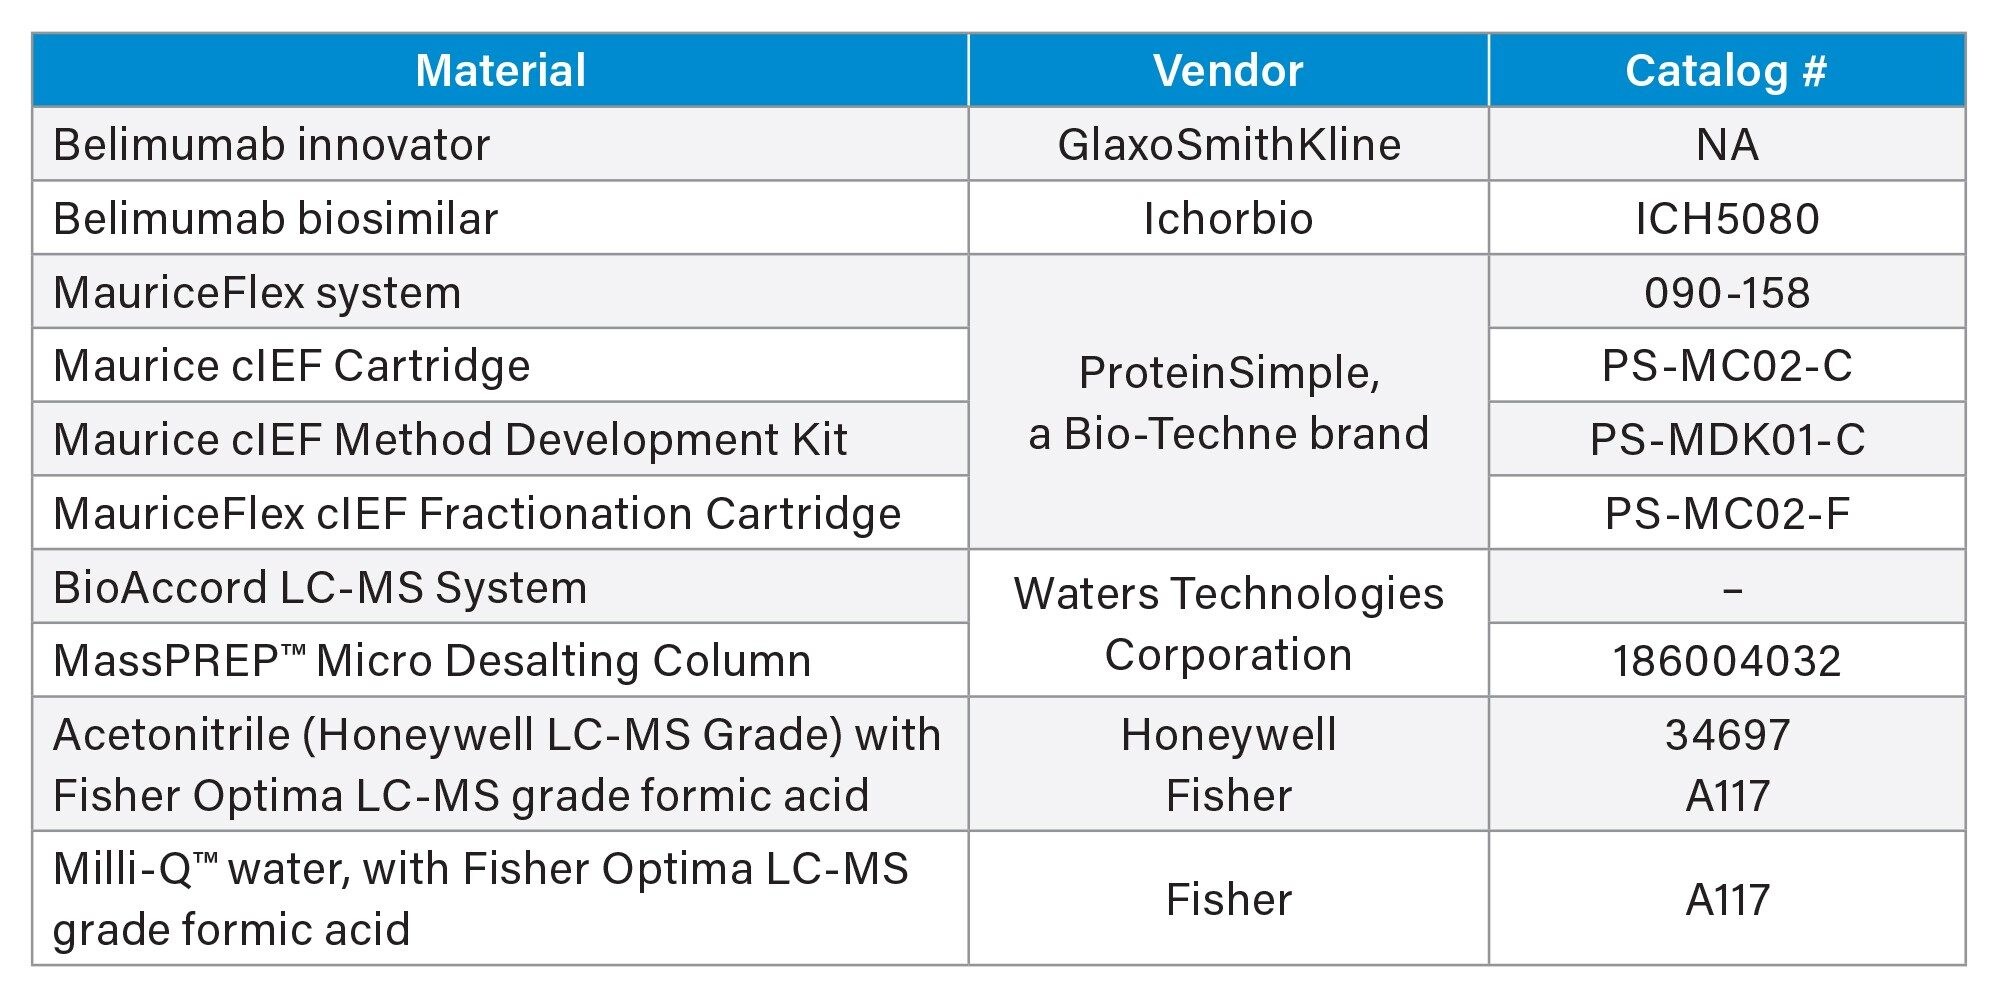 Table 1. Materials and kits used in this study.
icIEF Method
The innovator and biosimilar samples were prepared at a final concentration of 0.1 mg/mL in an ampholyte solution containing Pharmalytes (4%) 8–10.5 and 3–10 (4:1), 20% SimpleSol, 5 mM arginine, and Maurice pI markers 7.05 and 9.50. The samples were loaded onto the MauriceFlex instrument along with the Maurice cIEF cartridge and focused for 1 minutes at 1500 V, then 12 minutes at 3000 V.
Fractionation Method
Samples were prepared at a final concentration of 2 mg/mL in an ampholyte solution containing Pharmalytes (4%) 8–10.5 and 3–10 (4:1), 30 mM arginine, 30% SimpleSol, Maurice pI markers 7.05 and 9.50, and Simple Western™ pI markers 7.00 and 9.70. The samples were loaded onto the MauriceFlex instrument along with the MauriceFlex cIEF Fractionation Cartridge and focused for 10 minutes at 250 V, 10 minutes at 500 V, 10 minutes at 1000 V, and 25 minutes at 1500 V. The detected peaks mobilized for 25 minutes at 1000 V, followed by fraction collection for 45 seconds at 1000 V. All data were analyzed using Compass for iCE software.
Intact Mass Analysis
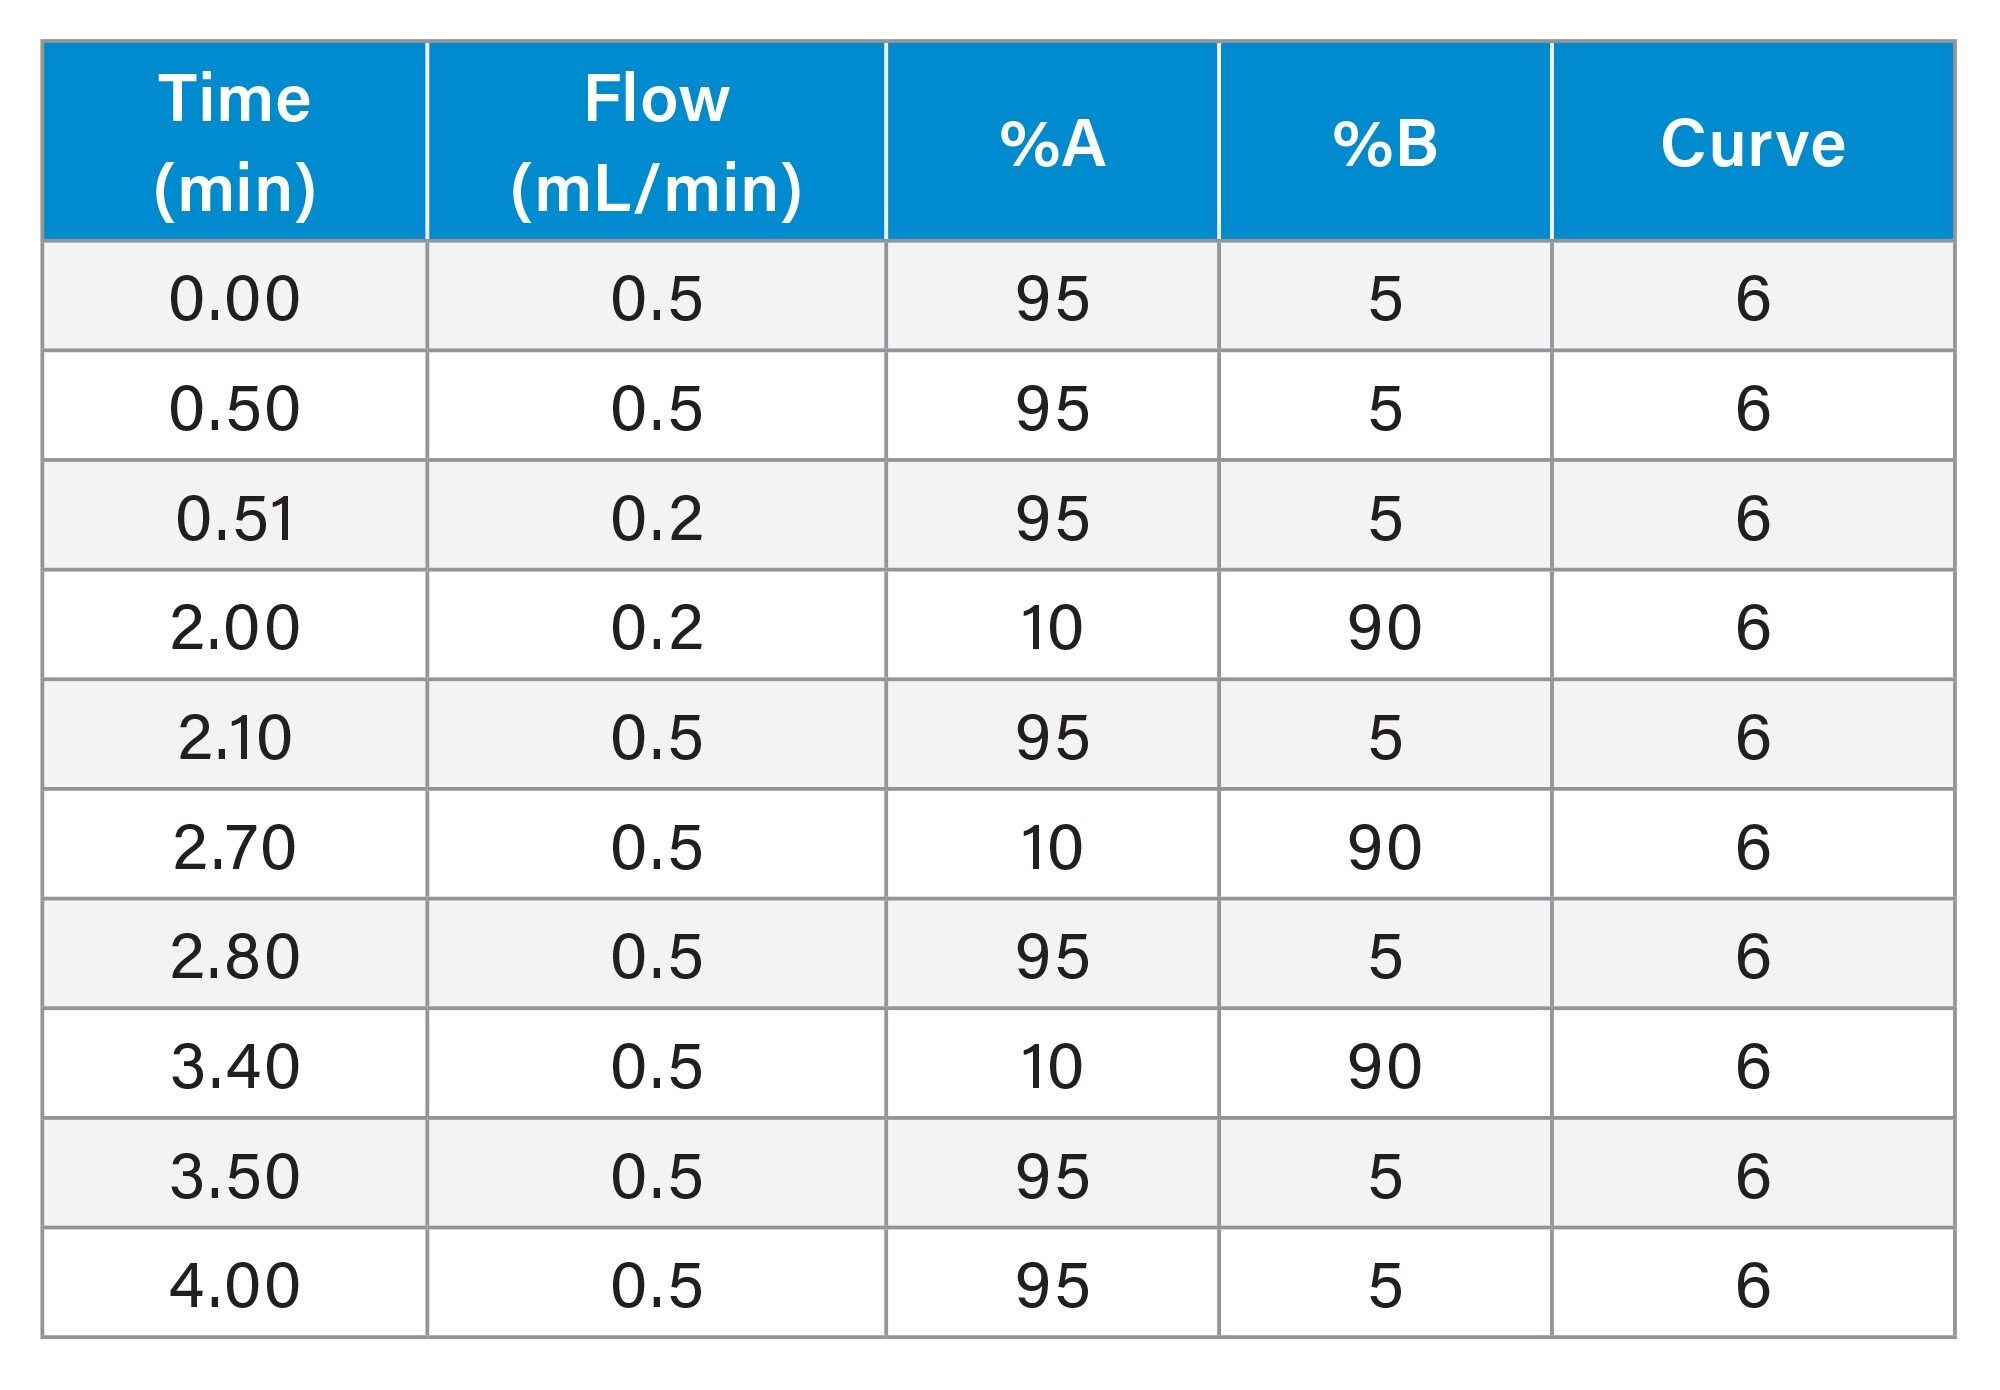
Selected fractions collected from the MauriceFlex System were analyzed on the BioAccord System without any buffer exchange or additional sample preparation. The BioAccord System was equipped with the Waters MassPREP Micro Desalting Column (2.1 x 5 mm). Mobile Phase A was water with 0.1% formic acid and Mobile Phase B was acetonitrile with 0.1% formic acid. Separation was achieved using the gradient below (total method time of 4 minutes). Column temperature was set to 80 °C. The RDa™ Detector settings were as follows: default capillary voltage of 1.5 kV, default desolvation temperature of 550 °C, and a cone voltage of 70 V. Mass spectra of each fraction were acquired, automatically deconvoluted, and masses matched within 40 ppm via INTACT Mass App within the waters_connect Informatics Platform.
LC Conditions
|
LC system: |
ACQUITY™ H-Class Binary Bio equipped with 50 µL sample extension loop |
|
Detection: |
ACQUITY UPLC™ TUV (280 nm) |
|
Column(s): |
Waters™ MassPREP™ Micro Desalting Column (2.1 x 5 mm) (p/n: 186004032) |
|
Column temp.: |
80 °C |
|
Sample temp.: |
6 °C |
|
Flow rate: |
Variable, see Gradient Table |
|
Mobile phase A: |
0.1% Formic Acid in Water |
|
Mobile phase B: |
0.1% Formic Acid in Acetonitrile |
|
Injection volume: |
30 µL |
Gradient Table
MS Conditions: RDa
|
MS system: |
ACQUITY RDa™ |
|
Ionization mode: |
ESI +ve, Full Scan |
|
Acquisition range: |
400–7000 m/z (High Mass) |
|
Capillary voltage: |
1.5 kV |
|
Cone voltage: |
70 V |
|
Desolvation temperature: |
550 °C |
|
Intelligent data capture: |
Off |
Results and Discussion
Charge Heterogeneity Analysis and Fractionation
The Benlysta (belimumab) innovator and biosimilar samples were first analyzed for their charge heterogeneity using the MauriceFlex cIEF Fractionation cartridge, as shown in Figures 1A and 1B, where five major peaks were detected for each sample. Interestingly, an overall shift in pI values was observed in the peaks of the biosimilar sample, suggesting the presence of differently charged species and underscoring the need for further analysis. Peaks of both samples were subsequently mobilized and fractionated on the MauriceFlex System for downstream analysis (Figures 2A and 2B). Fraction collection was followed by peak verification using the cIEF cartridge and percent peak areas were calculated (Table 2). These peaks were selected for LC-MS analysis on the BioAccord System.
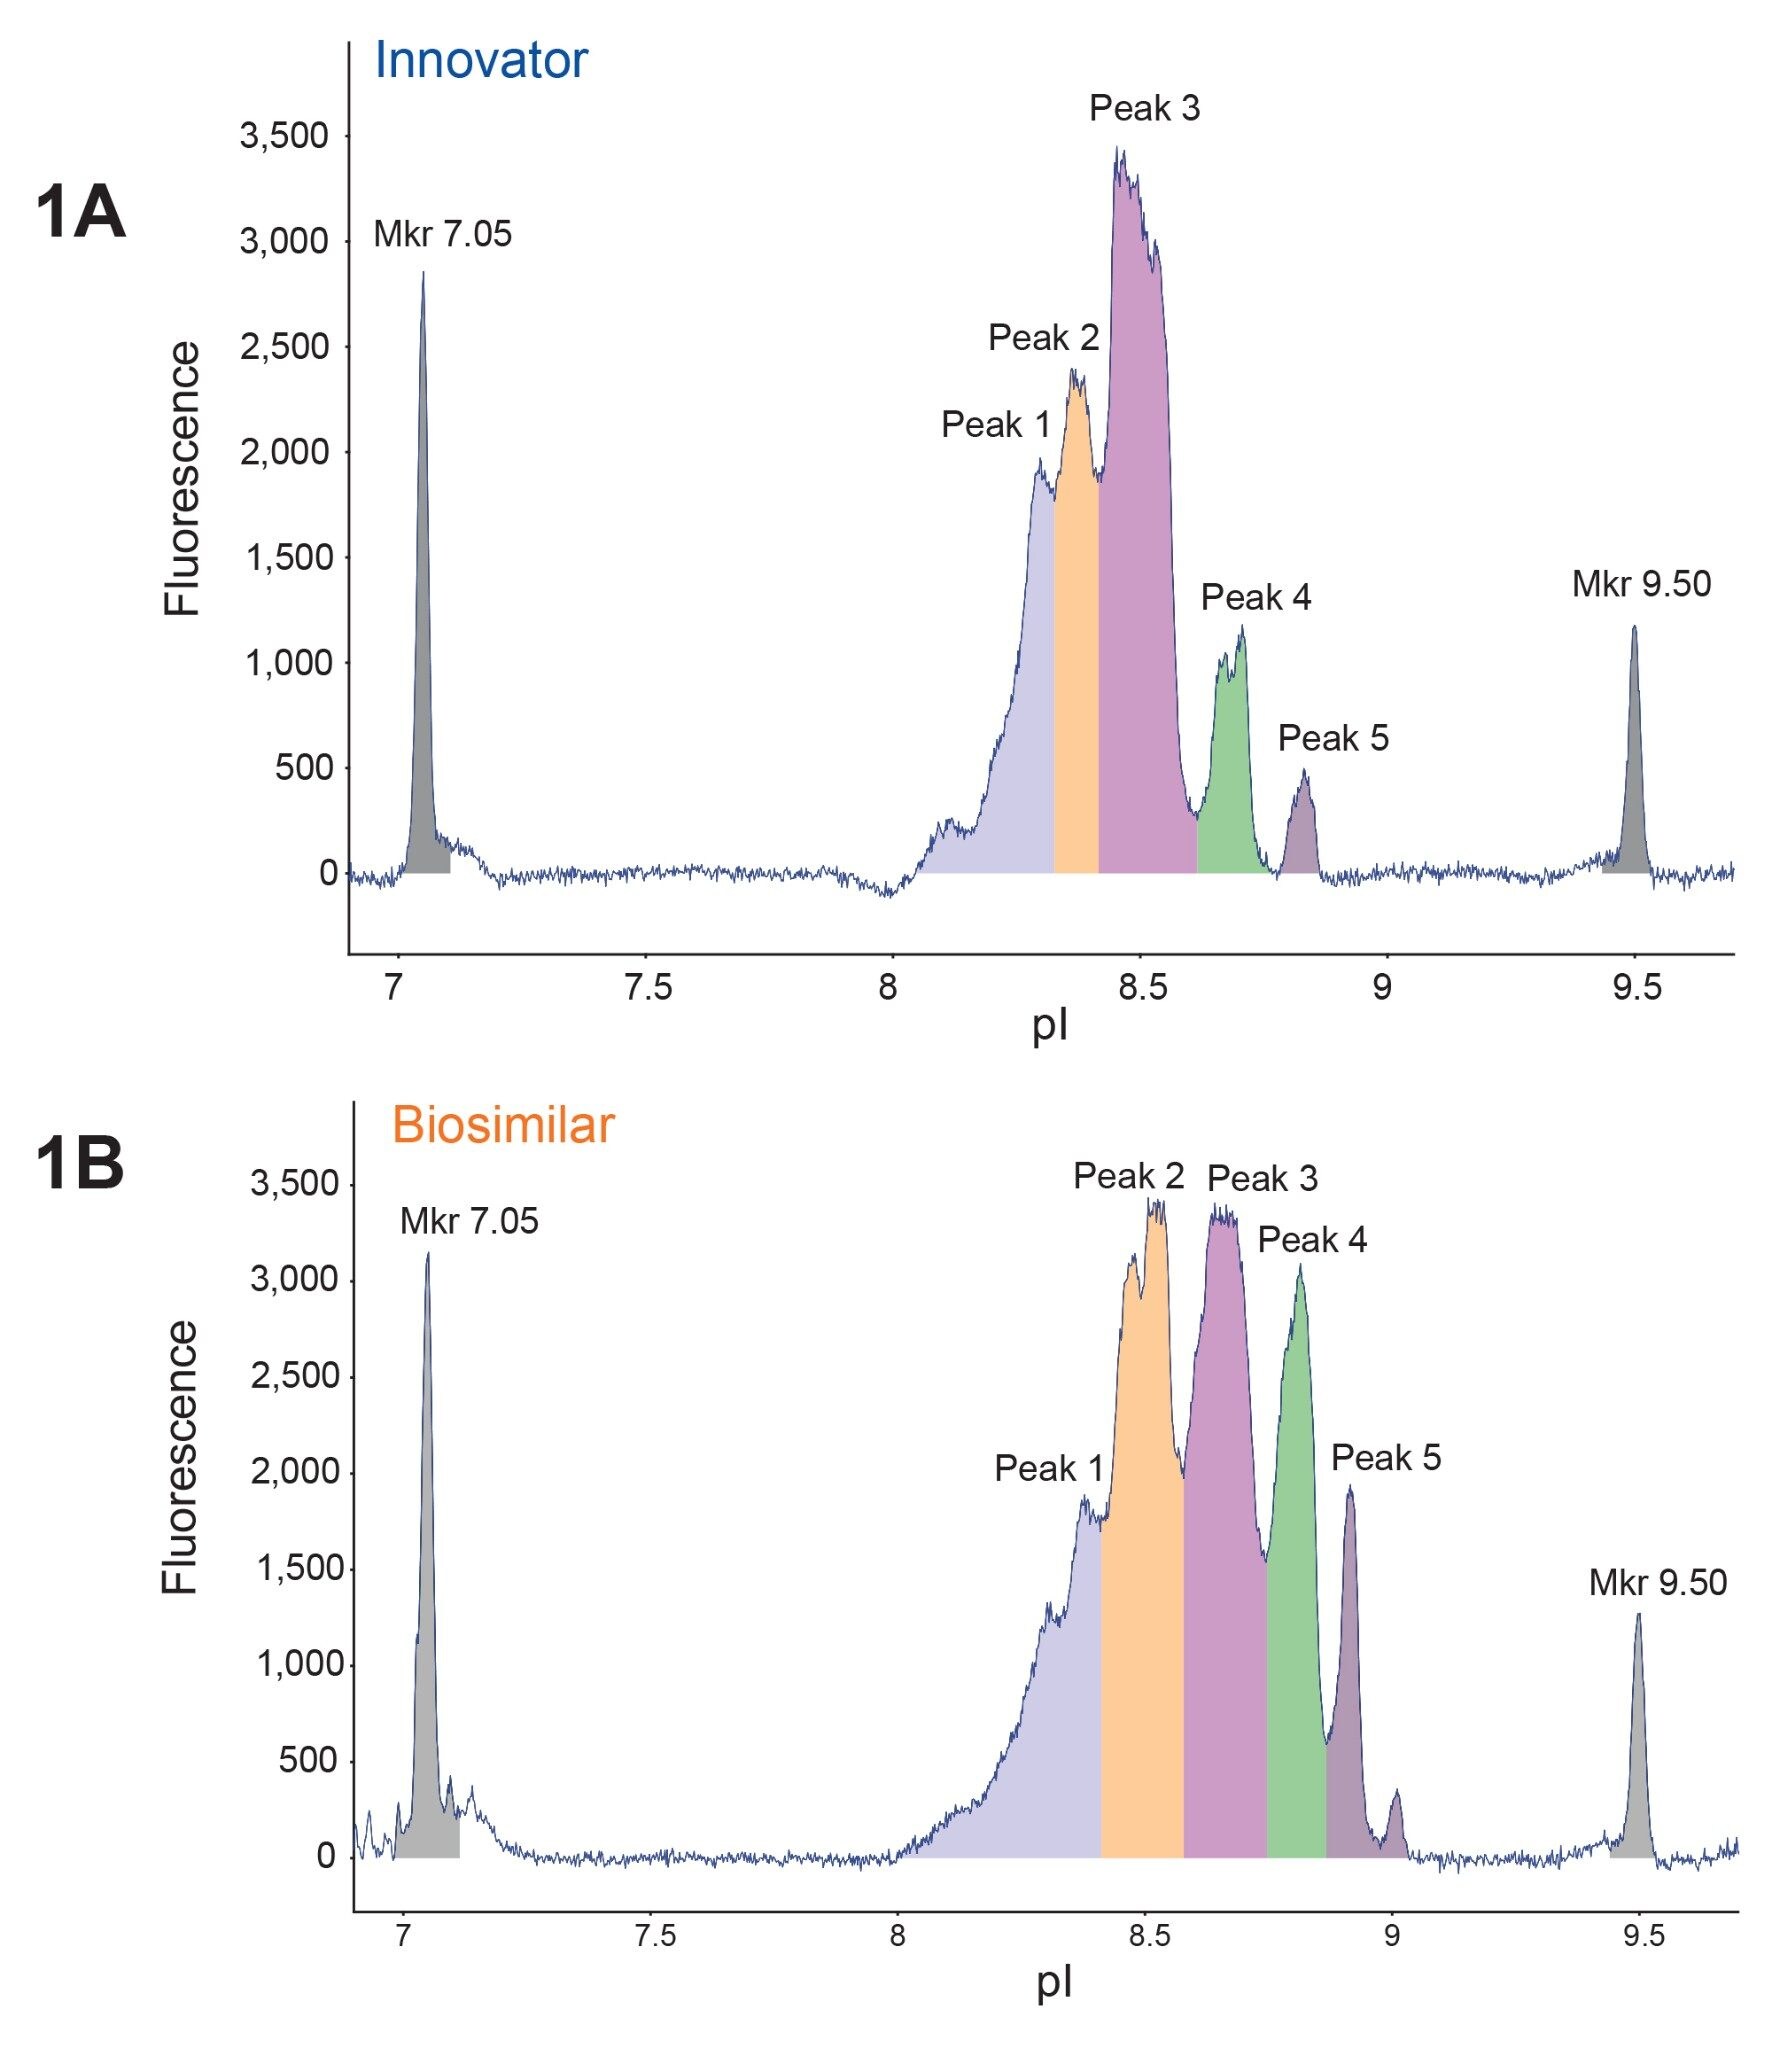 Figure 1. MauriceFlex enables icIEF-based charge separation. (A) Charge separation of the Benlysta (belimumab) innovator drug, and (B) a research-grade biosimilar with the MauriceFlex cIEF Fractionation cartridge. Five major peaks were detected in both samples, however, an overall shift in pI is observed for the biosimilar.
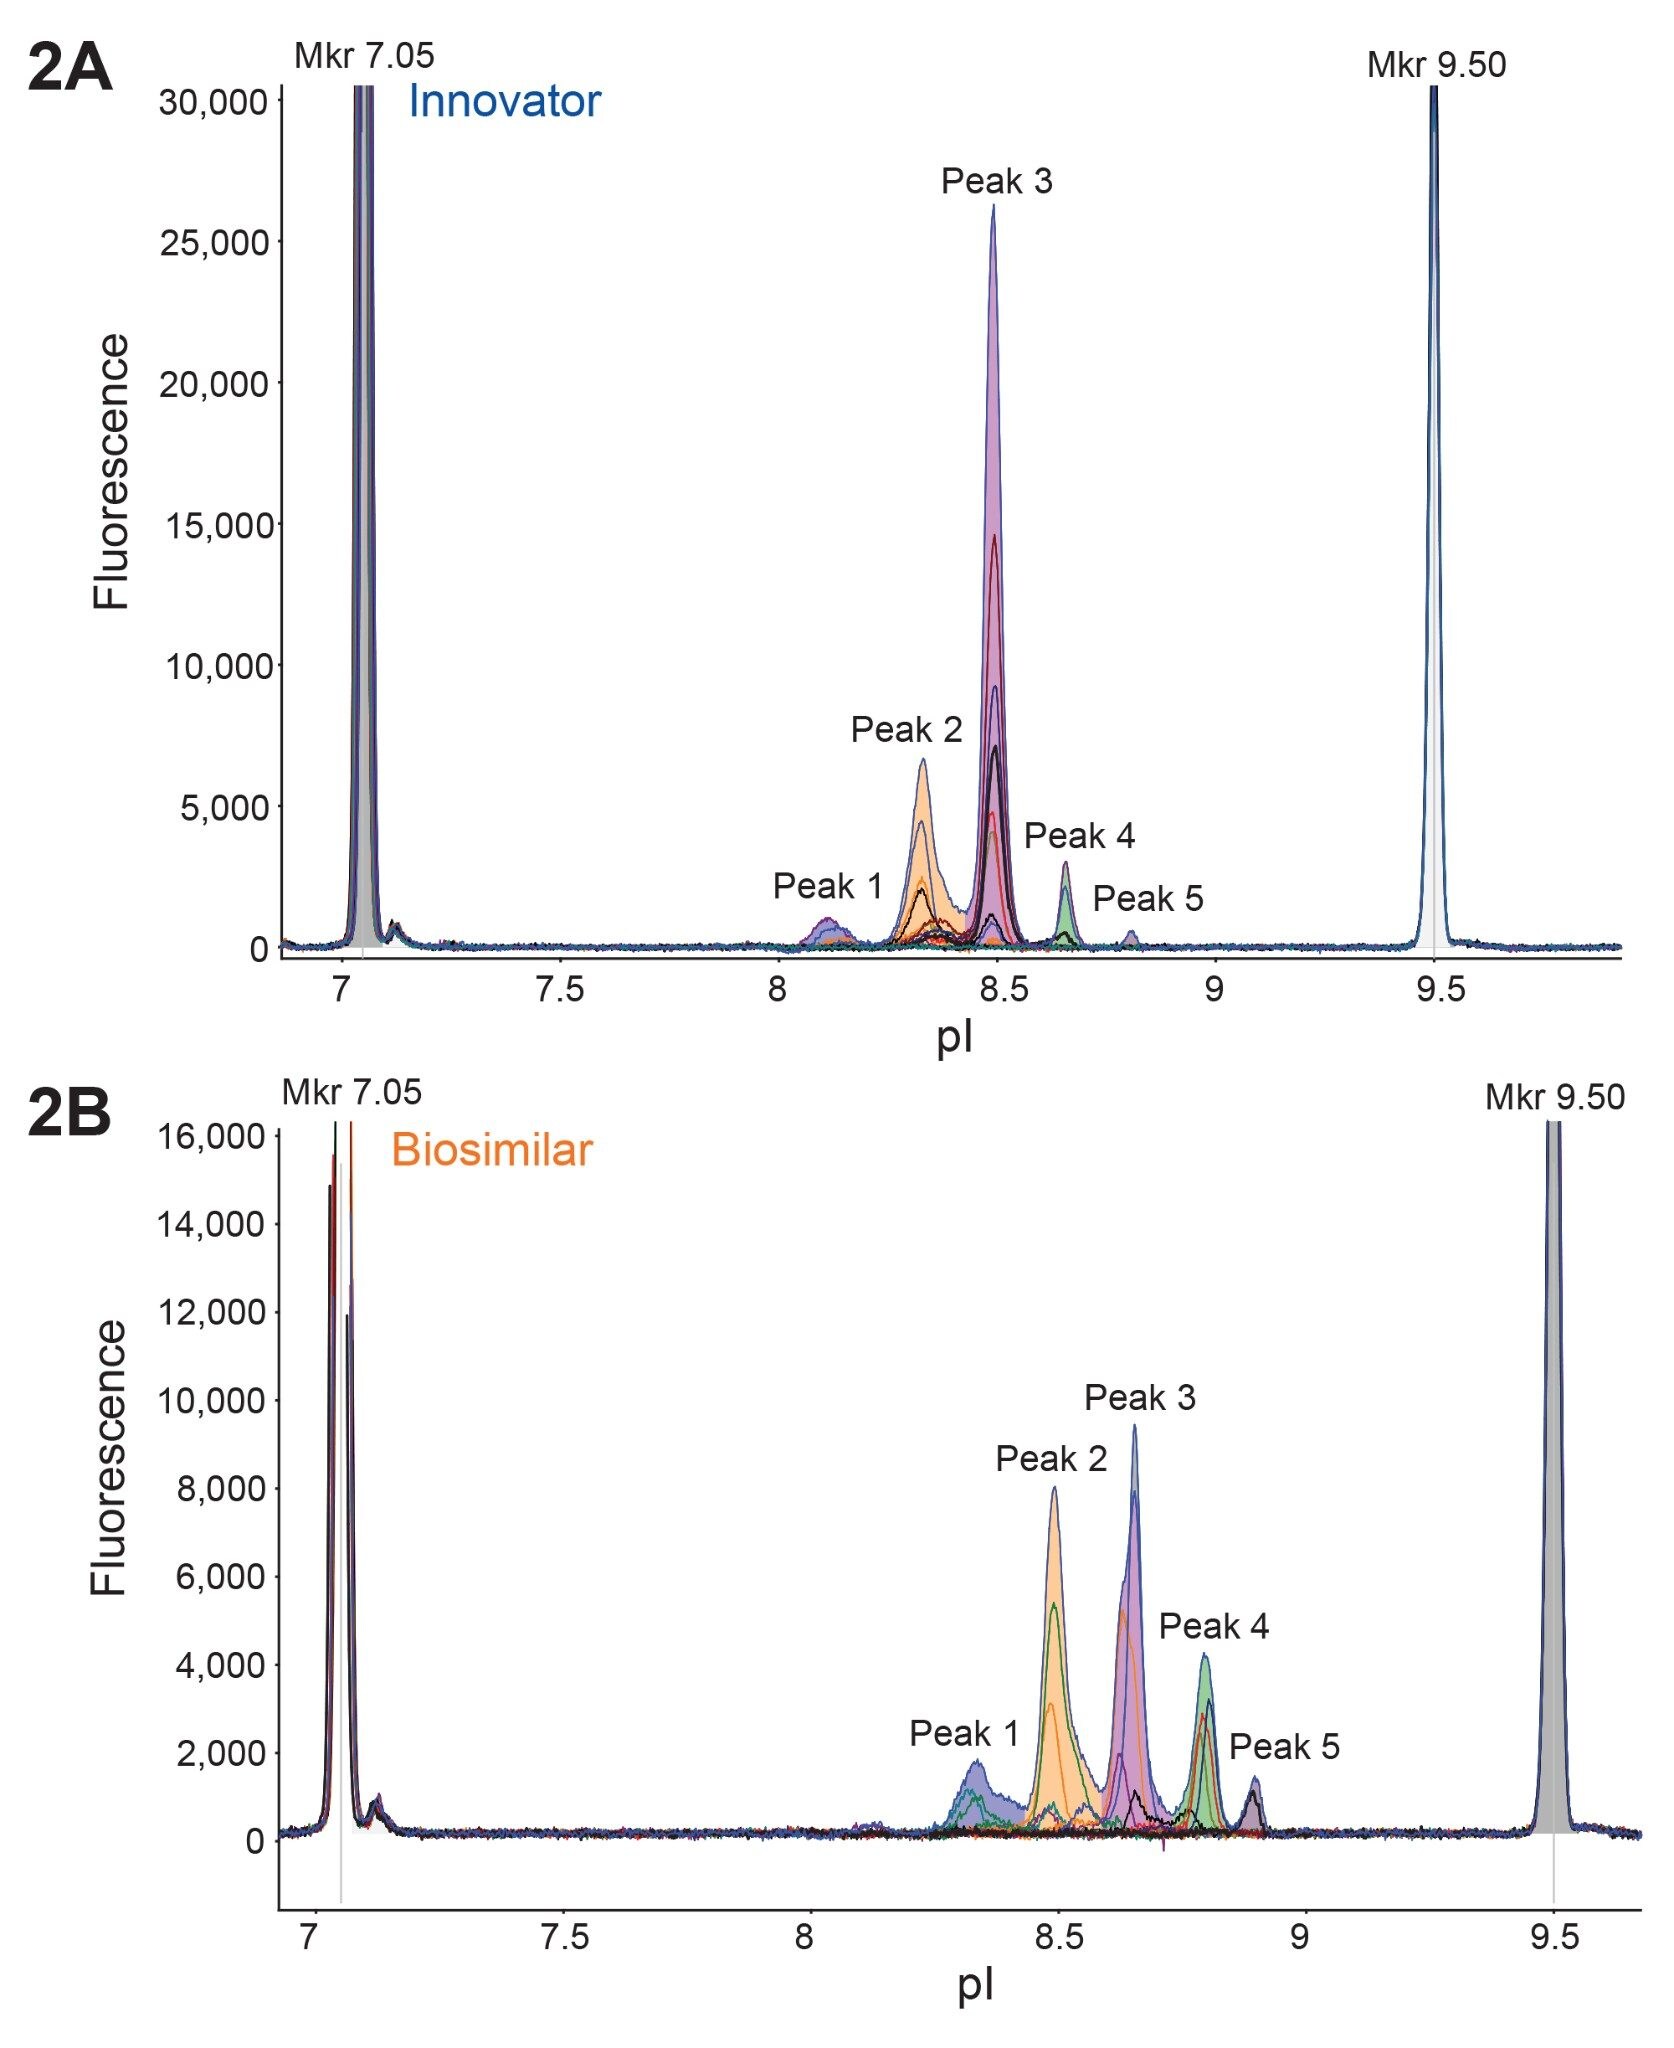 Figure 2. The MauriceFlex system fractionates both mAb samples, providing relevant charge variant fractions for further analysis. Each mAb was fractionated using the same method, producing 14 fractions for the innovator (A) and 16 for the biosimilar (B). Unfractionated sample was overlayed to locate and identify fractions. The collected fractions were quantitated and used for subsequent downstream analysis.
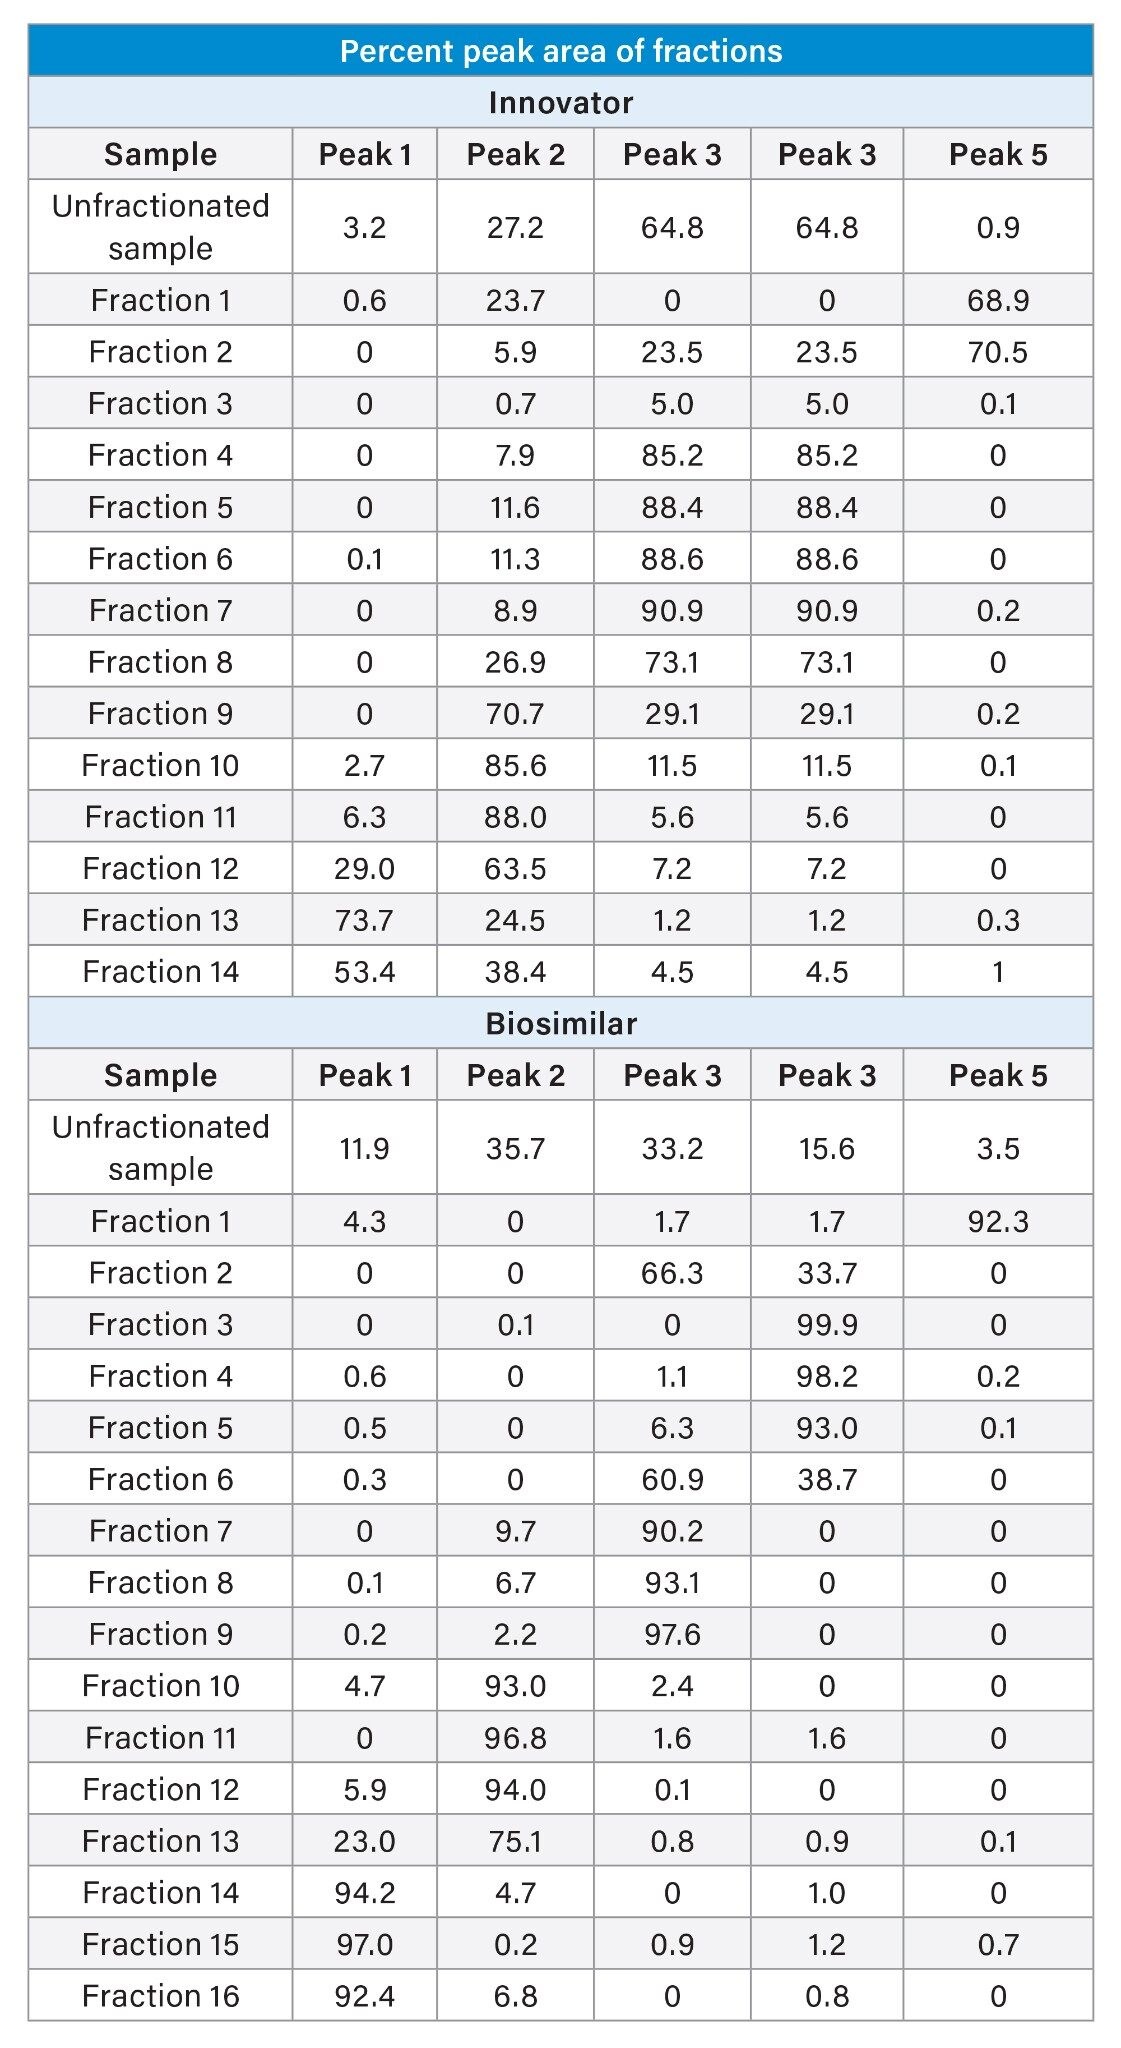 Table 2. Percent peak area of different fractions collected. Peaks 1 and 2 are acidic, Peak 3 is the main peak, and Peaks 4 and 5 are basic.
Intact Mass Analysis
Acidic, main, and basic fractions of the innovator and biosimilar were analyzed with LC-MS and compared. Deconvolution revealed some critical modifications, especially in the biosimilar peaks, thus offering key insights into the shift in apparent pI values observed during icIEF analysis. Figure 3A shows the spectra of acidic peaks of the innovator and biosimilar, and data of both samples indicate the possibility of deamidation. Analysis of the main peak (MP) from both samples also presented some discrepancies. The MP represents the most abundant species corresponding to the intact monoclonal antibody or its predominant form. The innovator MP showed free LC and LC dimers (data not shown) along with the main peak, while the biosimilar’s MP showed multiple species, including unprocessed C-terminal lysine (1K) of the heavy chain and a break in the light chain between glutamic acid and leucine (E3/L4), as shown in Figure 3B, in addition to the LC and LC dimers. Basic fractions of both samples revealed the presence of multiple species, and highlighted further differences between the two mAbs, as seen in Figure 3C. The innovator’s basic fractions predominantly showed the presence of C-terminal lysine, while the biosimilar’s additionally showed a break in the light chain between serine and glutamic acid (S2/E3). The key differences found between the two samples are summarized in Table 3. All fractions analyzed also highlighted the differences in N-glycoforms between the innovator and biosimilar.
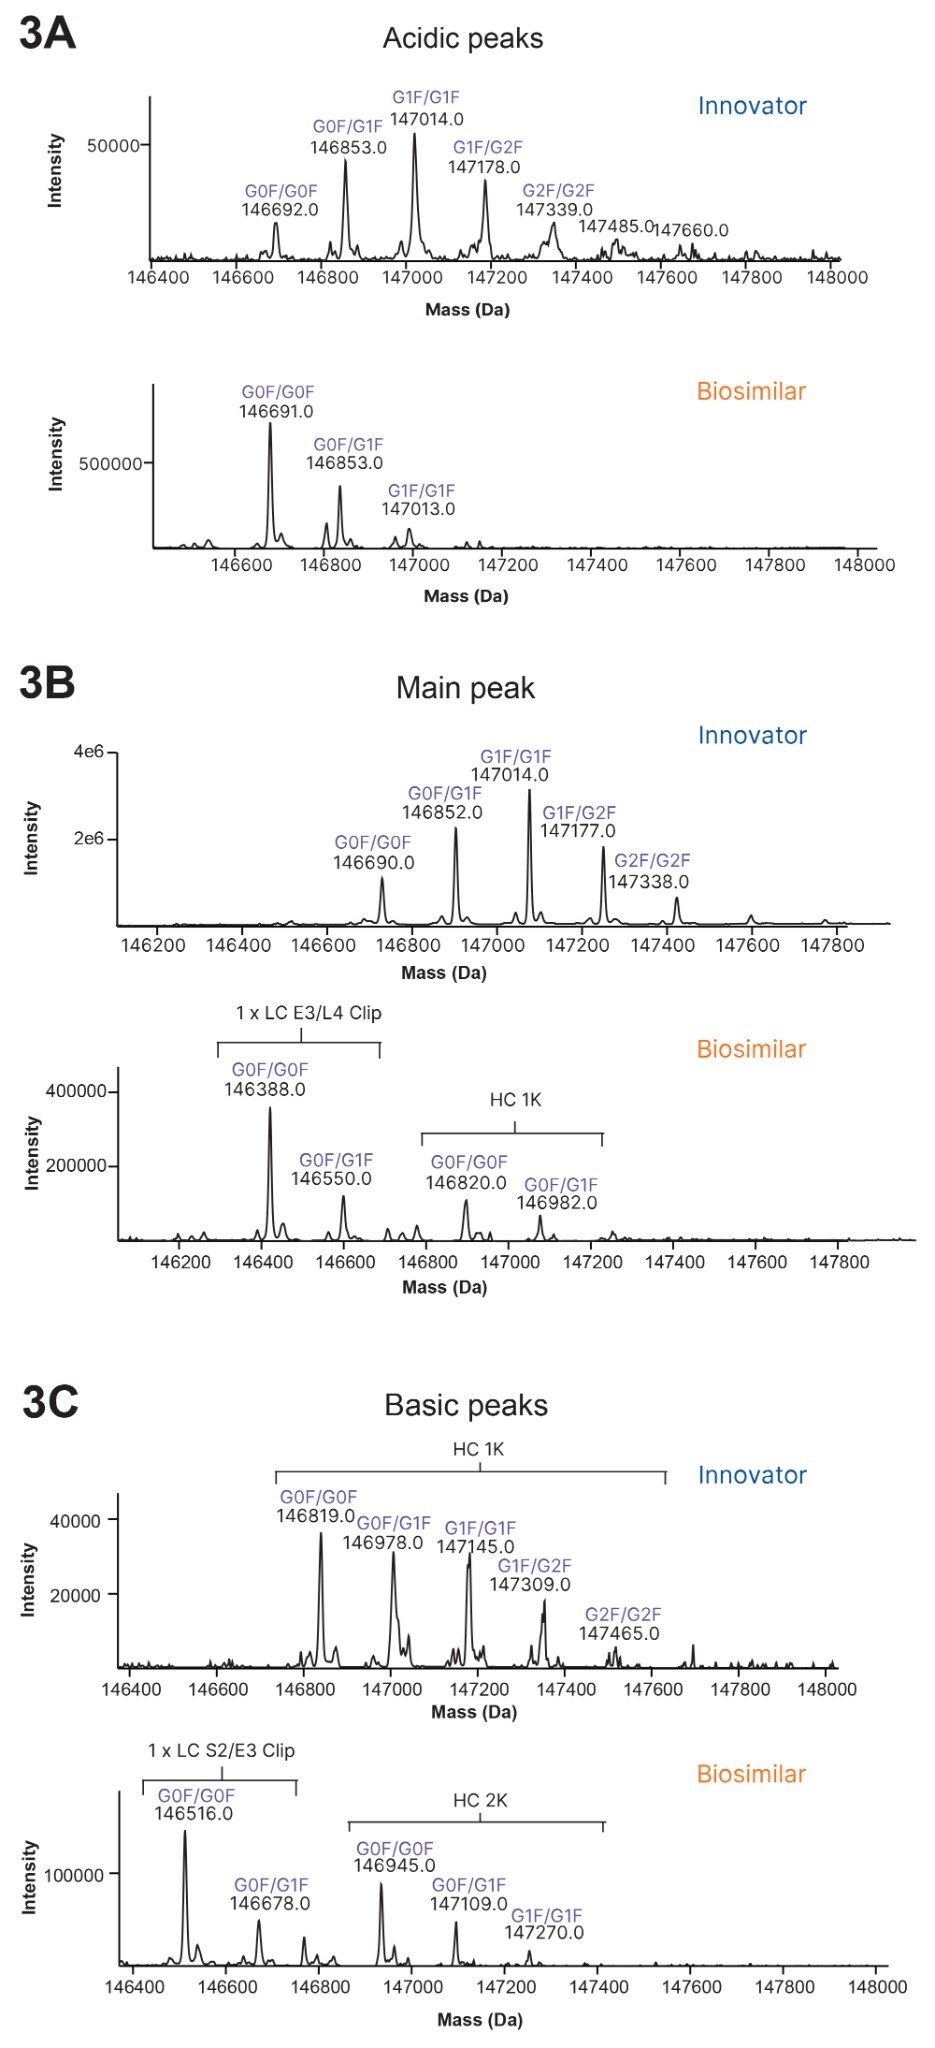 Figure 3. Deconvoluted spectra of charge variant fractions highlight key differences between the innovator and biosimilar. (A) Acidic fractions of the innovator and biosimilar, with deconvolution revealing potential deamidation in both samples. (B) Main peak fractions, highlighting discrepancies such as unprocessed C-terminal lysine (1K) and a break between glutamic acid and leucine (E3/L4) in the biosimilar. (C) Basic fractions, showing multiple species with the innovator primarily exhibiting C-terminal lysine and the biosimilar also displaying a break between serine and glutamic acid (S2/E3).
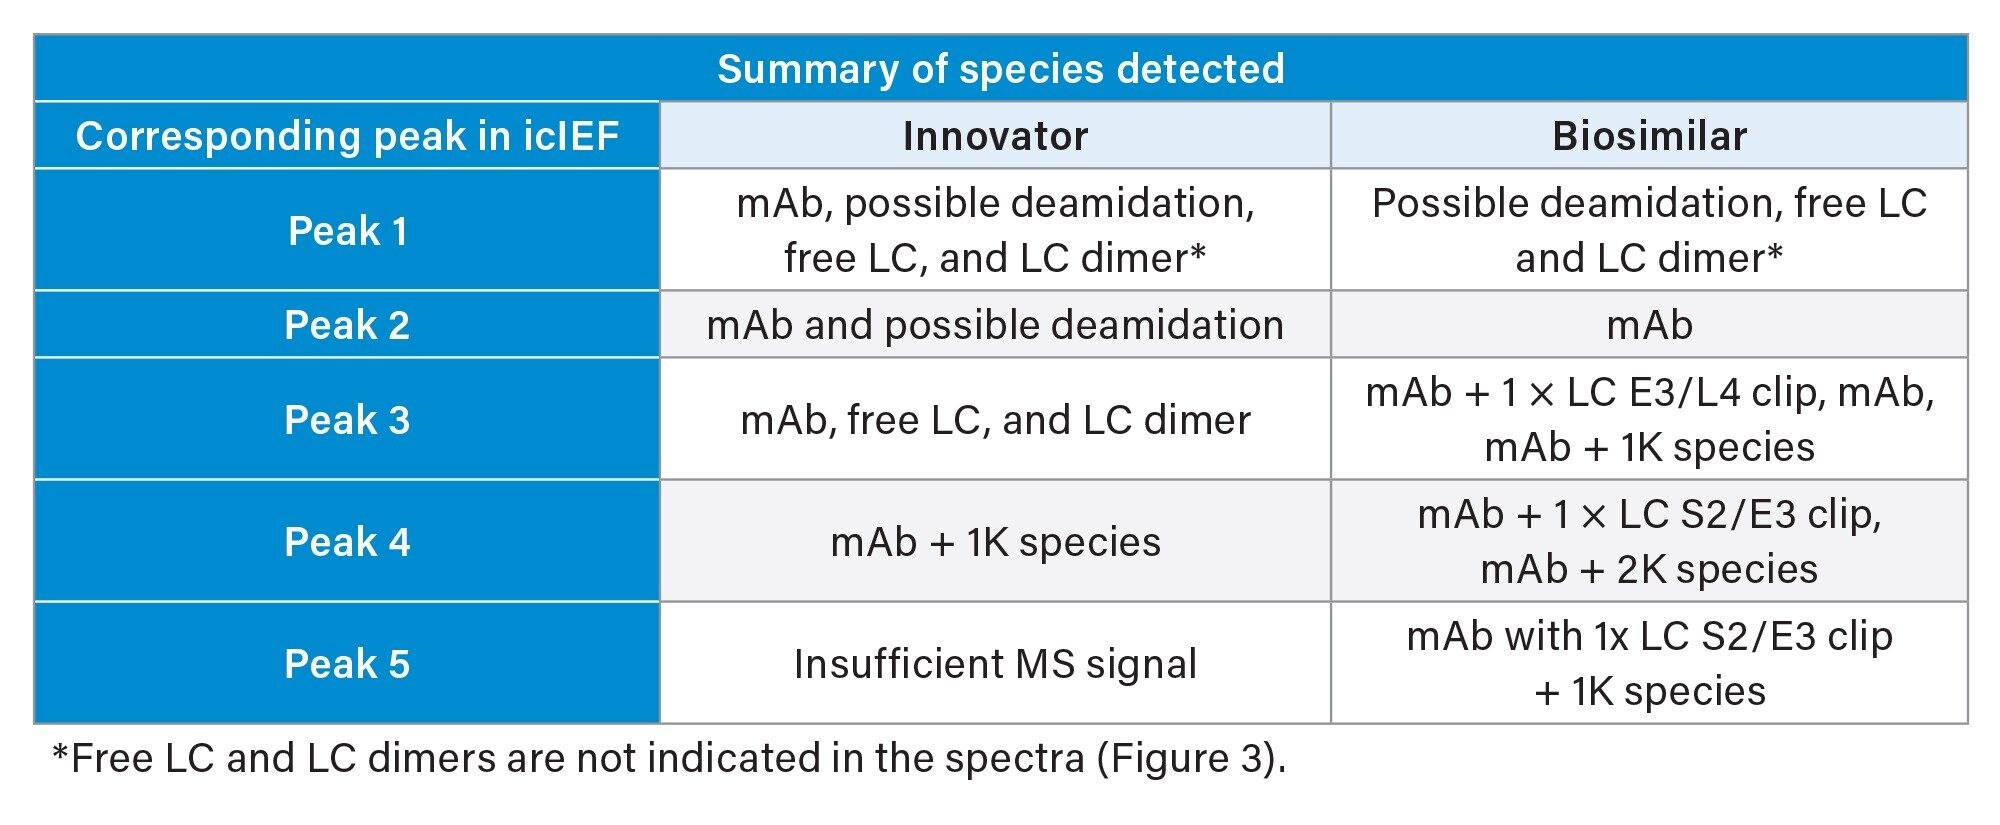 Table 3. A summary of various species detected after LC-MS analysis of select acidic, main, and basic fractions collected after icIEF.
*Free LC and LC dimers are not indicated in the spectra (Figure 3).
Conclusion
This application note demonstrates an efficient and successful workflow to separate, collect, and characterize mAb charge variants. Leveraging the MauriceFlex System for icIEF-based separation and fractionation, with the benchtop BioAccord System for LC-MS analysis, an innovator and a research-grade biosimilar were analyzed, revealing critical differences between the two.
Acidic, main, and basic peaks were analyzed separately, uncovering the origin of a variety of charged species, including C-terminal lysine, amino acid clipping, and possible deamidation. Given that charge variants can have significant implications for drug safety, continuous monitoring across various phases of development—such as process characterization, formulation development, and QC lot release—is essential.4
By implementing efficient workflows like the one demonstrated here, the ability to ensure the quality and consistency of drug substances and products is significantly enhanced. This approach not only aids in meeting regulatory expectations, but also supports the development of safer and efficacious therapeutics by providing identity information on charge variants.
References
- Zhang X, Chen T, Li V, Bo T, Du M, Huang T. Cutting-edge mass spectrometry strategy based on imaged capillary isoelectric focusing (icIEF) technology for characterizing charge heterogeneity of monoclonal antibody. Anal Biochem. 2023;660:114961. doi:10.1016/j.ab.2022.114961.
- Dai J, Lamp J, Xia Q, Zhang Y. Anal Chem. 2018;90(3):2246–2254. doi:10.1021/acs.analchem.7b04.
- Review and Approval, Biosimilars. U.S. Food and Drug Administration.
- Chung S, Tian J, Tan Z, et al. Industrial bioprocessing perspectives on managing therapeutic protein charge variant profiles. Biotechnol Bioeng. 2018;115(7):1646–1665. doi:10.1002/bit.26587.
720008541, October 2024