Improving Peptide Mapping Separations Containing Phosphopeptides Using MaxPeak™ Premier Column Technology on an ACQUITY™ Premier System
Abstract
Peptide mapping studies can be complicated by the presence of phosphorylated peptides due to their affinity for binding to exposed metal surfaces throughout the chromatographic flow path. Mobile phase additives which are commonly used in RPLC do not sufficiently mitigate these interactions, leading to a reduction in chromatographic quality for an already challenging RPLC separation. MaxPeak High-Performance Surface (HPS) Technology is Waters™ solution to this challenging problem. This is accomplished though the innovative design of MaxPeak HPS Technology to reduce non-specific interaction of analytes that are prone to adsorb to flow path surfaces. In this paper, an ACQUITY Premier Binary UPLC™ System is compared to a leading biocompatible binary UHPLC system using an ACQUITY Premier Column for a phosphopeptide mapping application using MS detection. Critical parameters for chromatographic quality are monitored including peak tailing, peak area, and signal-to-noise. Mobile phase additive concentrations are modified to determine if more MS friendly conditions could be achieved. The ACQUITY Premier System and Column demonstrated measurable benefits compared to a traditional biocompatible system for use in RPLC applications employing MS detection for difficult compounds such as phosphopeptides.
Benefits
- Improved chromatographic performance for phosphopeptide mapping using ACQUITY Premier System and Column
- Lower mobile phase additive enabling more sensitive MS detection and lower LOD
Introduction
Peptide mapping studies of proteins can be complex, particularly for larger proteins, and require methods that can resolve multiple peaks in a single analysis. A commonly used approach to monitor peptide maps is reversed-phase liquid chromatography (RPLC) paired with electrospray-ionization mass spectrometry (ESI-MS). This technique can be complicated by the presence of phosphorylated peptides (phosphopeptides) in the digest. Many cellular processes such as cell growth and differentiation are controlled through phosphorylation of proteins at the serine, threonine, and tyrosine amino acid residues by protein kinases.1 Moreover, at least 2/3 of all proteins encoded by the human genome have been shown to contain phosphorylation at some point in their lifecycle.2 Phosphopeptides are “sticky” compounds which, due to a negatively charged phosphate group, readily adsorb to positively charged metal surfaces throughout the chromatographic flow path. This interaction can lead to peak tailing and reduced recovery of phosphopeptide peaks as well as poor overall quality of the peptide map due to the complex nature of the chromatographic results.3
To control selectivity and recovery of analytes in reversed-phase peptide mapping methods, acidic mobile phase additives such as trifluoroacetic acid (TFA) or formic acid (FA) are used. These ion-pairing agents neutralize free metal ions and limit binding of the analyte to the chromatographic system.4 In the case of RPLC-MS peptide mapping, FA is a commonly used weak ion-pairing agent due to its low ion-suppression compared to other additives.5 Ion-suppression is an important consideration when using mass spectrometry-based methods, as it can significantly impact detector response. When monitoring low-abundance peaks, optimization of signal-to-noise (S/N) is important for improving the limit of detection (LOD) and assay accuracy.
In this study, an ACQUITY Premier Binary System (Figure 1) is compared to a traditional biocompatible UHPLC system (System X) for the separation of phosphopeptides using an ACQUITY Premier Column. Biocompatible systems reduce corrosion and potential sample contamination by eliminating iron from the flow path using PEEK and MP35N instead of stainless-steel system components. The ACQUITY Premier System and MaxPeak Premier Column offer additional value with MaxPeak HPS technology, designed to minimize analyte/surface interactions that can lead to sample losses. Suitability parameters such as peak tailing, S/N, and peak area are monitored using a ACQUITY QDa™ Mass Detector with several sample sets run over multiple days. Additionally, FA is reduced from 0.1% to 0.01% in the mobile phase to determine if milder mobile phase conditions may be used for more sensitive MS detection.
Experimental
Sample Description
Vials of MassPREP Enolase Digest with Phosphopeptides Mix (p/n: 186003286) and MassPREP Phosphopeptide Standard Enolase (p/n: 186003285) were reconstituted in 100 µL of 0.1% FA in water, vortexed for 10 seconds, and pooled together. Pooled samples were vortexed for 10 seconds and aliquots (90 µL for MassPREP Enolase Digest with Phosphopeptides Mix and 50 µL for MassPREP Phosphopeptide Standard Enolase) stored at -20 °C until used for testing.
LC Conditions
|
LC system: |
1. ACQUITY Premier Binary System with ACQUITY APC Reservoir Cap Kit (p/n: 205001152) 2. System X biocompatible UHPLC binary system with standard reservoir caps |
|
Vials: |
Total Recovery (p/n: 186002805) |
|
Column: |
ACQUITY Premier Peptide CSH™ C18 Column, 130 Å, 1.7 µm, 2.1 X 150 mm (p/n: 186009489) |
|
Column temperature: |
65 °C |
|
Sample temperature: |
6 °C |
|
Injection volume: |
1. MassPREP Enolase Digestion with Phosphopeptide Mix=1 µL 2. MassPREP Phosphopeptide Standard Enolase=1, 3, and 5 µL |
|
Mobile phase A: |
0.1% or 0.01% Formic Acid (FA) in Milli-Q Water |
|
Mobile phase B: |
0.1% or 0.01% FA in Acetonitrile (ACN) |
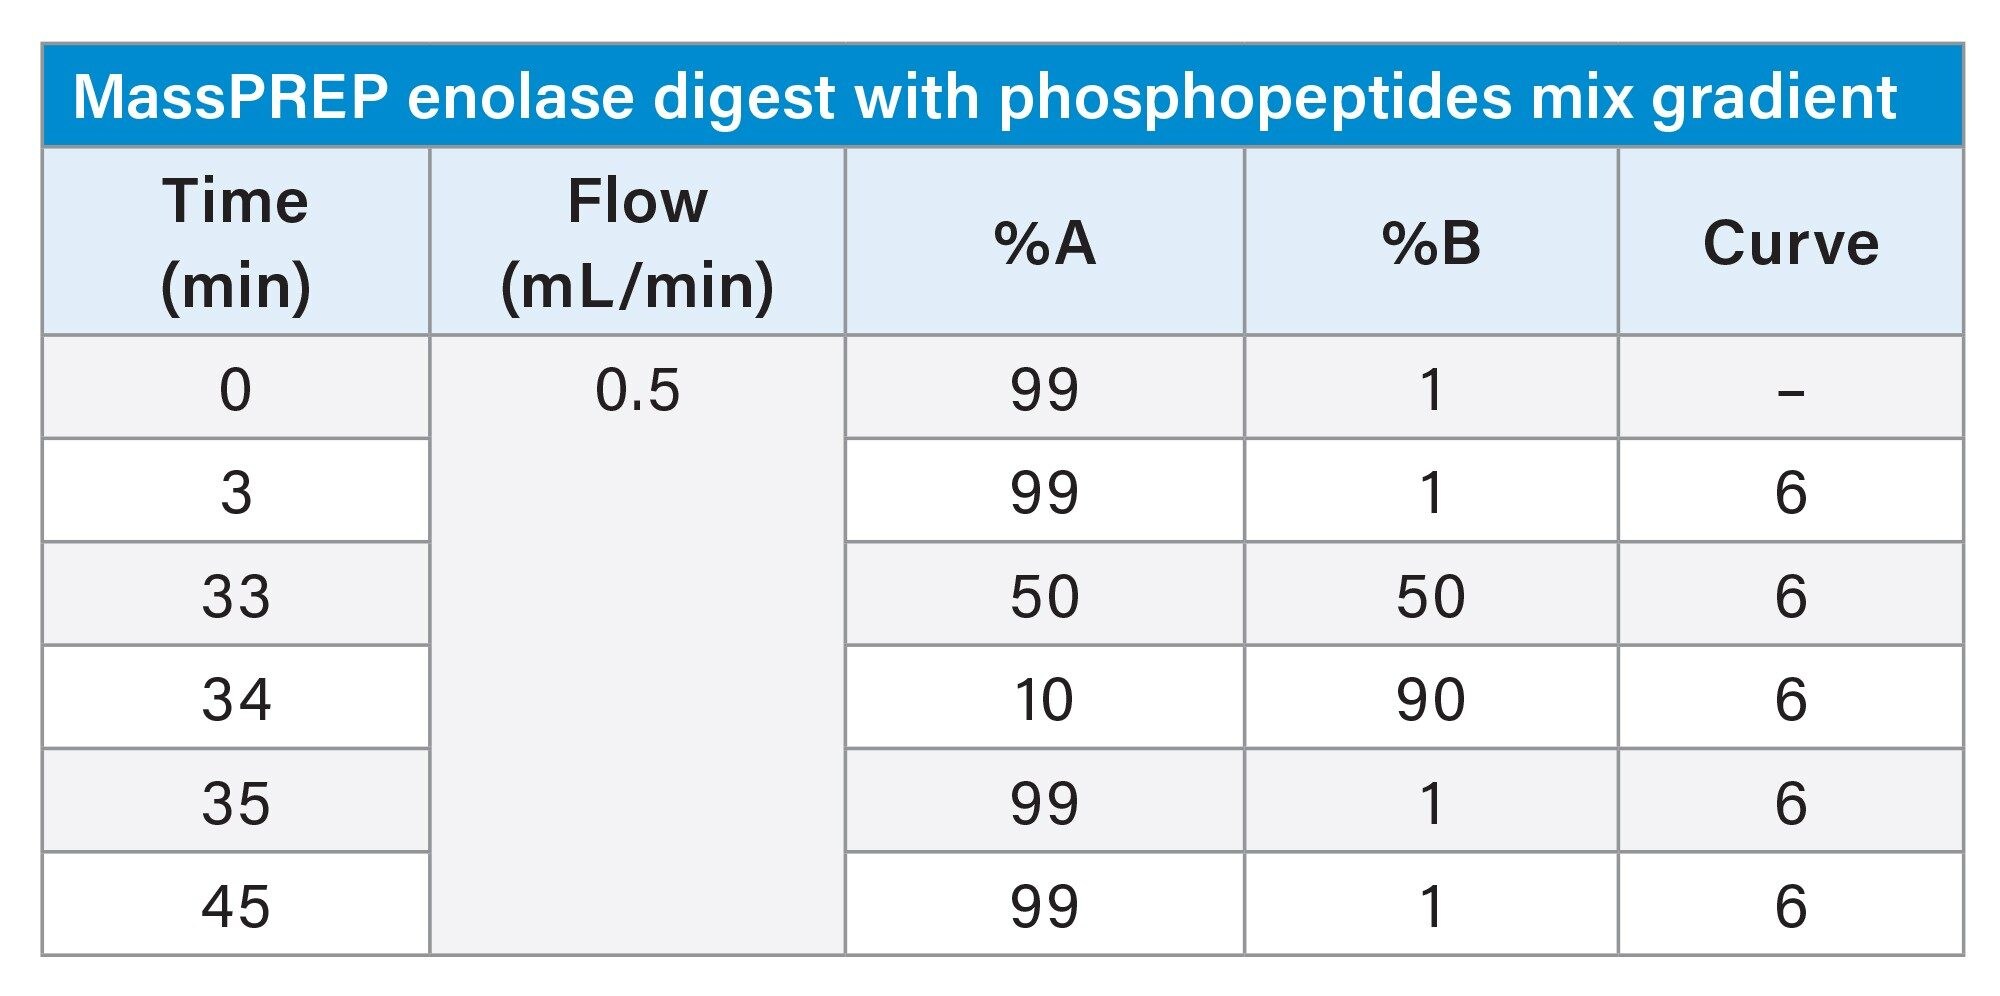
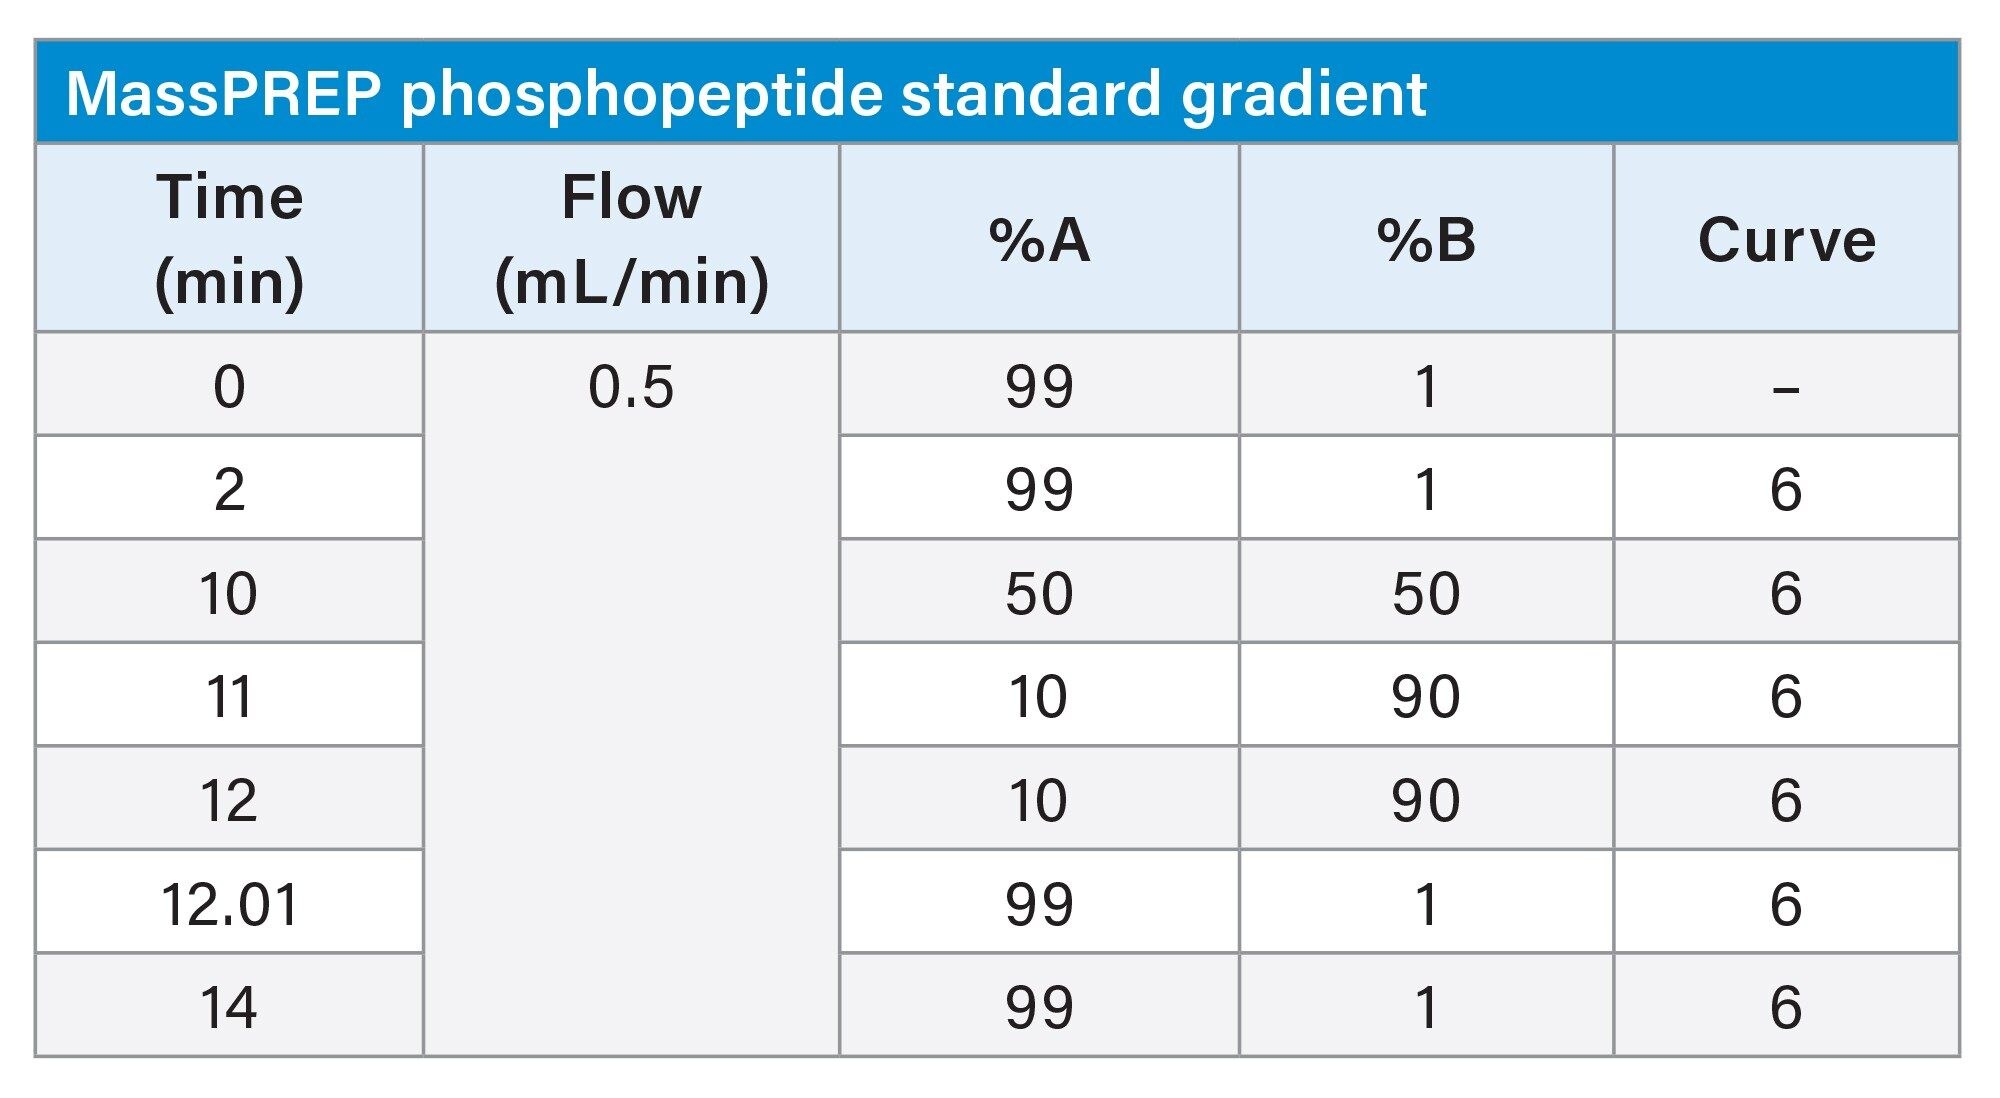
Gradient Table
MS Conditions
|
MS system: |
QDa |
|
Ionization mode: |
Positive |
|
Capillary voltage: |
1.5 kV |
|
Cone voltage: |
15 V |
Data Management
|
Chromatography software: |
Empower™ 3.6.1 |
Results and Discussion
To assess both UHPLC systems for use in the RPLC-MS separation of phosphopeptides, testing was performed over three days on both systems. Samples used include a phosphopeptide standard consisting of three singly phosphorylated peptides and a single doubly phosphorylated peptide as well as a yeast enolase protein tryptic digest with the same four phosphopeptides spiked in. A gradient slope of 6.13% B/min and 1.63% B/min was used for the phosphopeptide standard and the enolase digestion respectively to ensure peptides were sufficiently resolved. Multiple injection volumes (1 µL, 3 µL, and 5 µL) of the phosphopeptide mix were tested to assess LOD. Both systems were run using the same QDa Mass Detector, and only mass data is used for comparison. The use of mass data is integral for peptide mapping studies where mass confirmation of peaks is necessary to elucidate protein peptide sequence. The concentration of FA, the acidic mobile phase additive used in this study, can be optimized for desired selectivity of peptide peaks. In general, a concentration of 0.1% additive in the mobile phase system is sufficient for good resolution of most peaks in the peptide map.6–8 The surface modification used in the ACQUITY Premier System and column should allow for the use of less mobile phase additive by reducing the need to mitigate analyte/surface interactions. To this effect, two mobile phase systems were tested and compared: the standard 0.1% FA, and a lower ion-pairing mobile phase containing 0.01% FA.
Total ion chromatograms (TICs) of the enolase digestion were collected at the start of the study to locate target peptide peaks that spanned the gradient. Once target peptides were selected, Single Ion Recording (SIR) was used to monitor the peptides throughout the study. This method allows users to increase the scan time to maximize detector sensitivity as well as collect singly- and doubly-charged states of the peptide ions for further confirmation of targets.
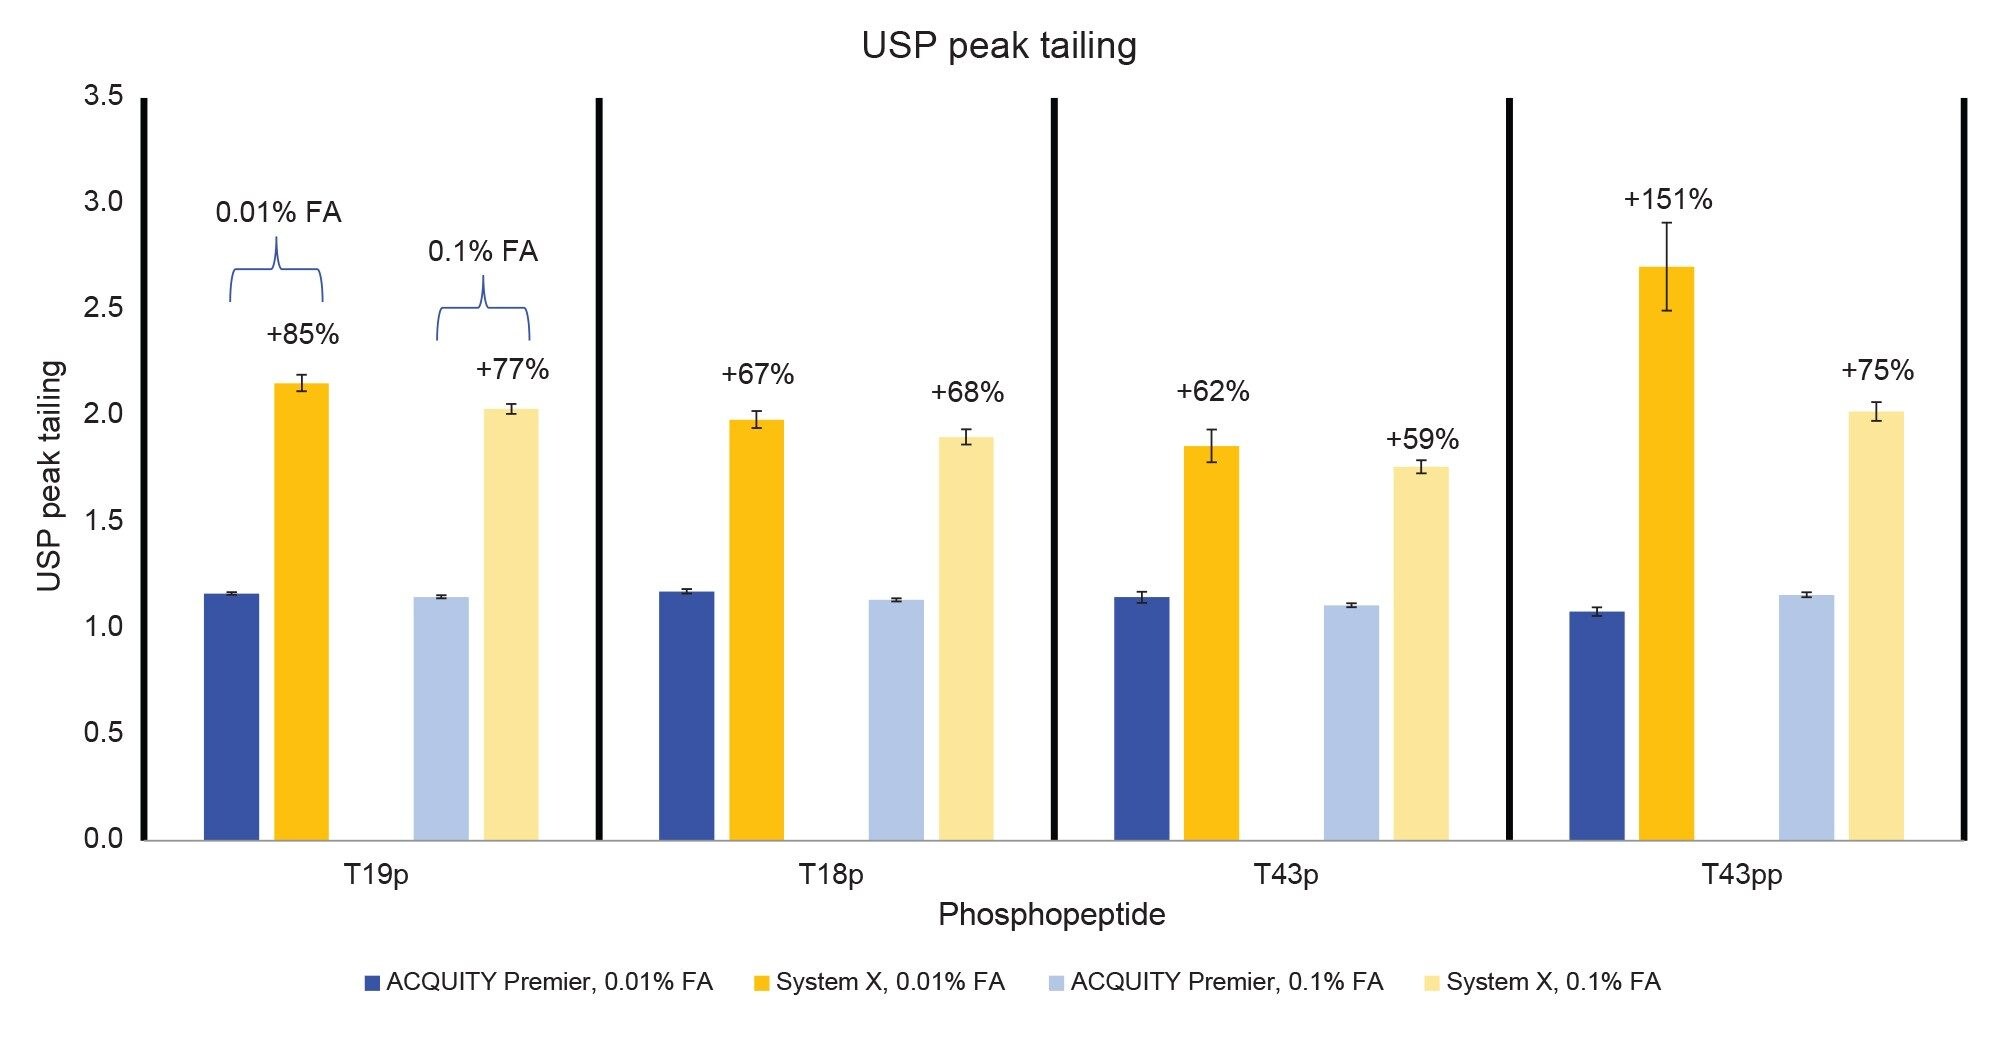
Figure 2 displays the MassPREP Phosphopeptide Mixture separation on both systems using both 0.1% and 0.01% FA mobile phase conditions. The ACQUITY Premier System displays better peak shape than System X using both conditions. Additionally, there is no significant increase in peak tailing when lowering the mobile phase additive concentration on the ACQUITY Premier System while there is a slight increase in peak tailing on System X. These observations are confirmed in Figure 3, which compares peak tailing using the 5 µL injections. System X demonstrates between 62% and 151% higher peak tailing with the 0.01% FA mobile phase. When using the 0.1% FA mobile phase peak tailing increases were between 59% and 75% on System X compared to the ACQUITY Premier. The reduction in difference between systems is expected as the ion-pairing agent works to suppress off-target interactions. Even with the higher level of FA, System X demonstrated consistently higher peak tailing than the ACQUITY Premier System. In addition, the ACQUITY Premier System offered lower deviation in peak tailing across all peaks under both conditions. It is important to note that while using the ACQUITY Premier System, when the mobile phase additive was decreased from the standard 0.1% FA to 0.01% FA, there was no significant increase in peak tailing supporting the notion that MaxPeak HPS enables the use of less ion-paring agent without sacrificing chromatographic performance. This is especially true for the doubly phosphorylated form of the T43 peptide (T43pp) which is particularly susceptible to off-target interactions with the flow path. System X demonstrates comparable results between mobile phase conditions for the three singly phosphorylated peptides in the standard, showing slight increases in peak tailing with the 0.01% FA mobile phase that are within a deviation from that observed with 0.1% FA. However, for the T43pp peptide, a significant increase in tailing is observed on System X that is not seen on the ACQUITY Premier System.
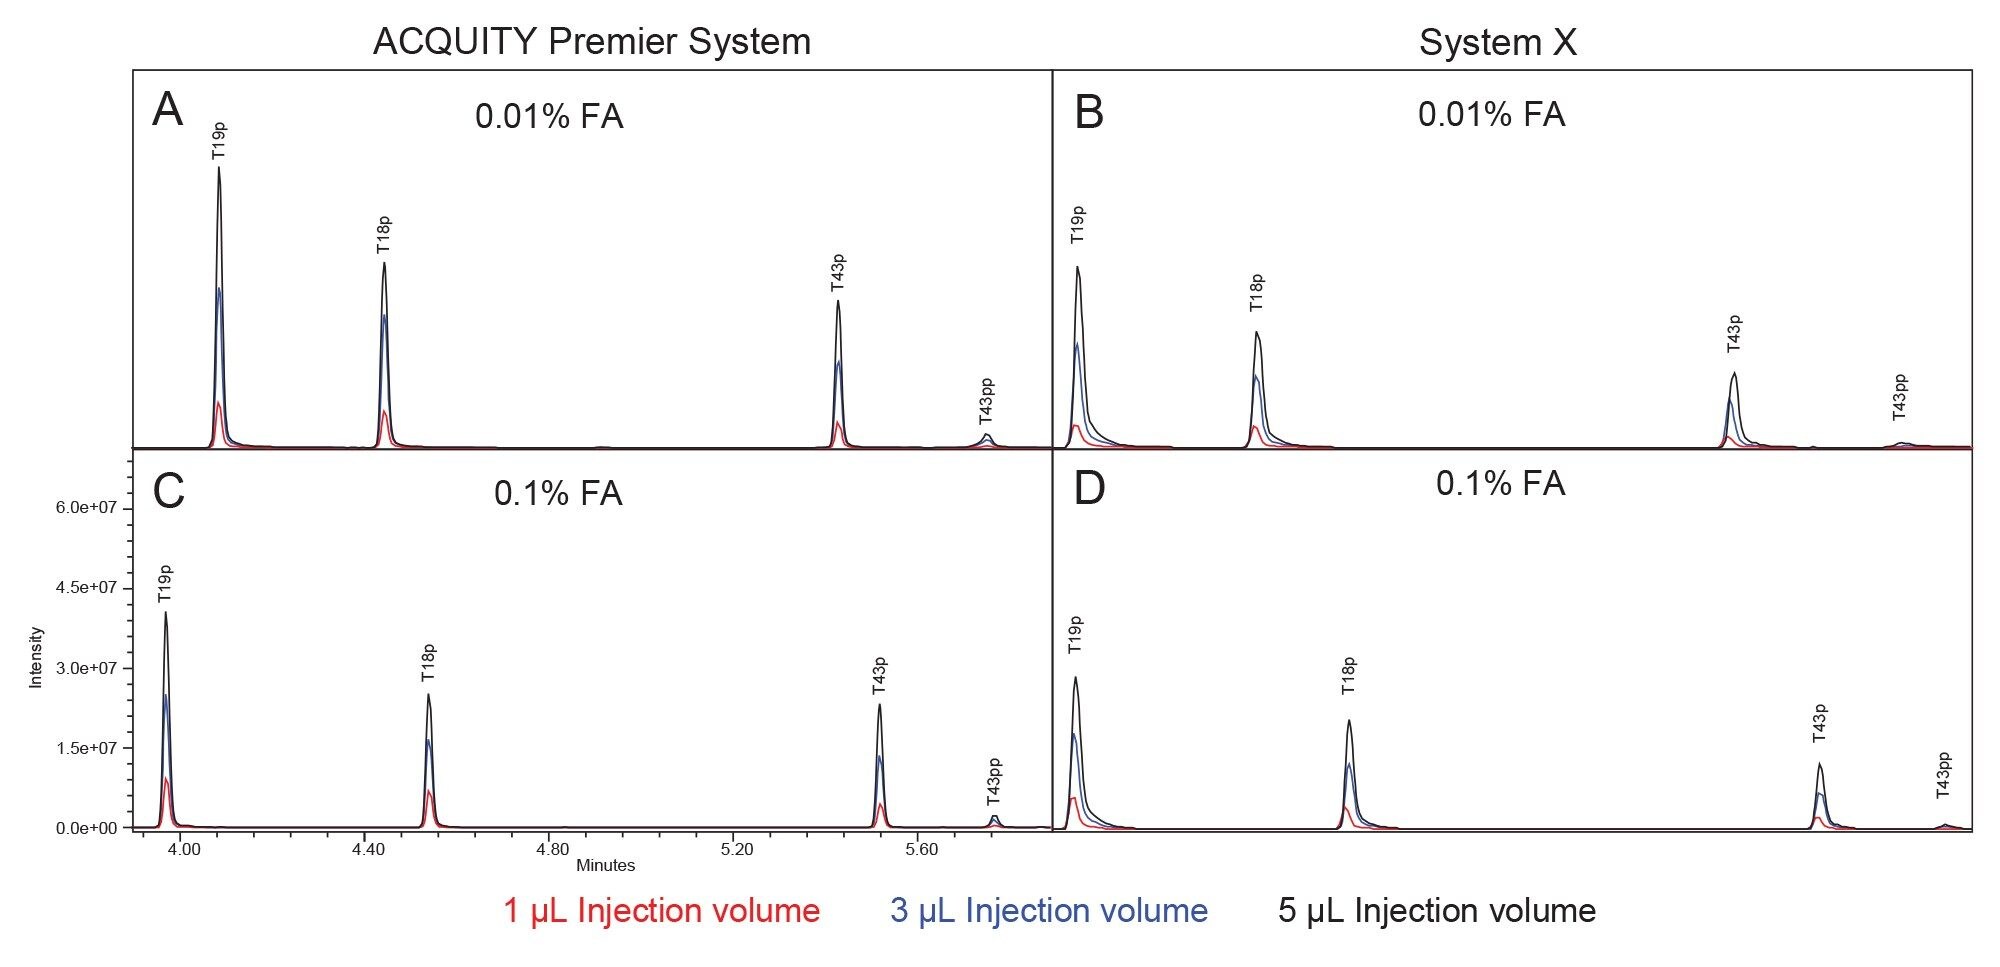
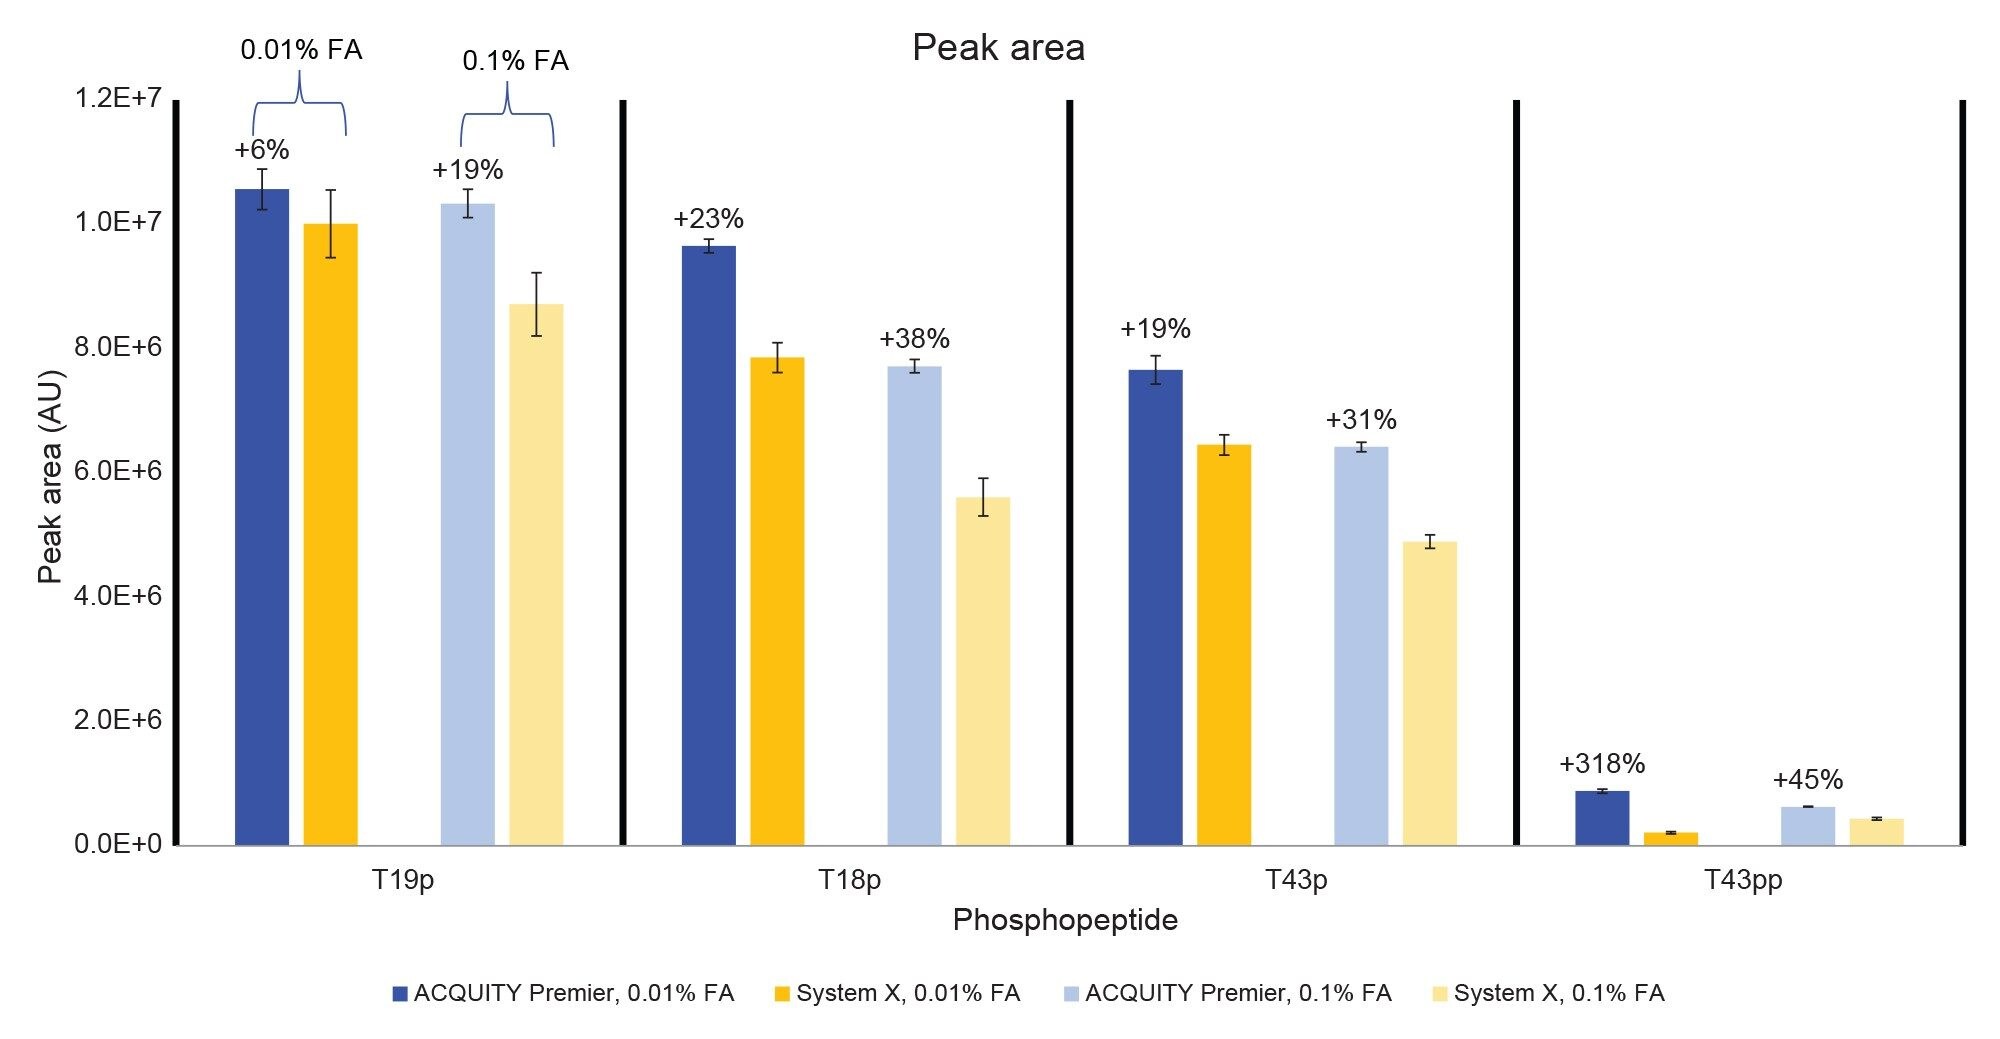
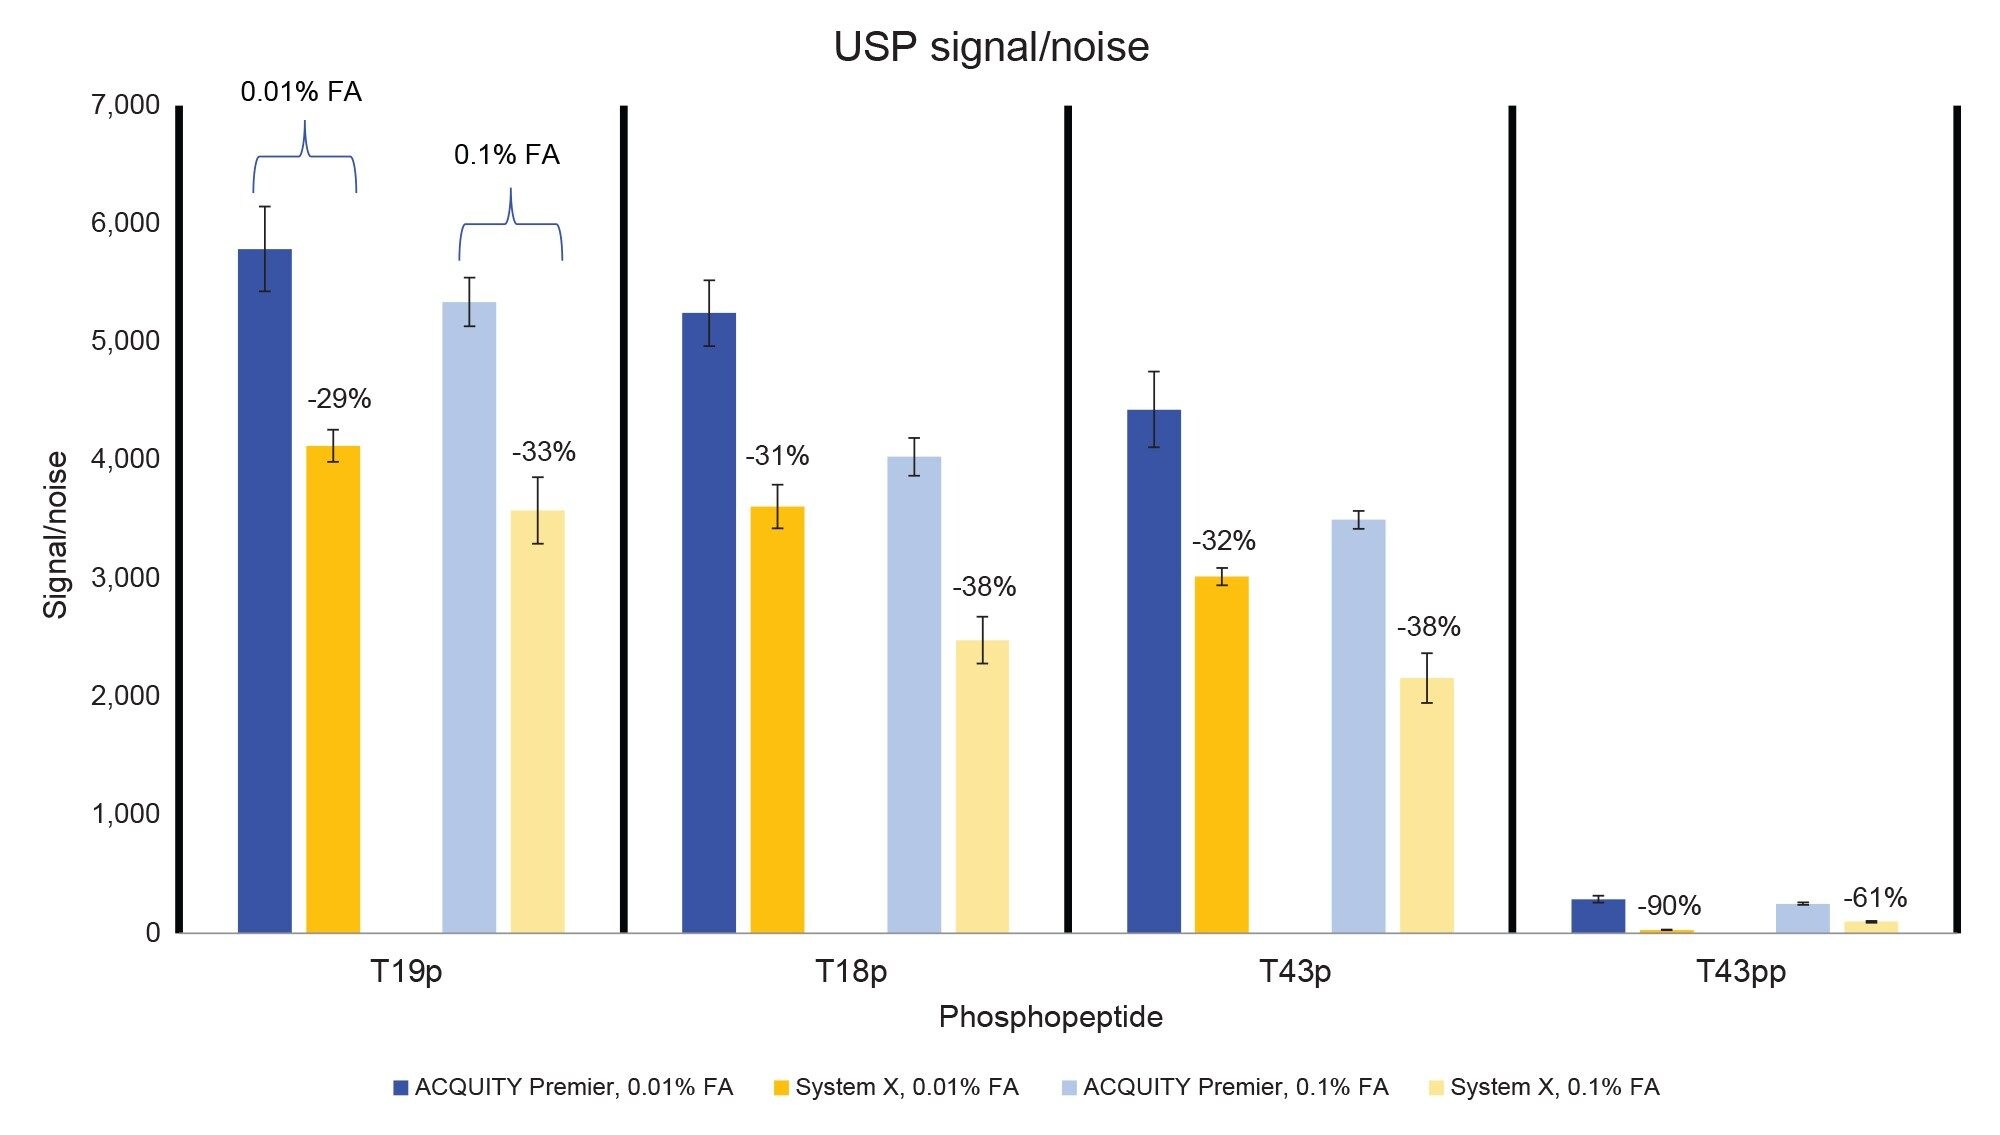
In addition to better peak shape the ACQUITY Premier System demonstrated higher analyte recovery and S/N (Figures 4 and 5). Increases in peak area observed on the ACQUITY Premier System compared to the biocompatible system range from 6% for the T19p phosphopeptide and up to a 3-fold increase for the T43pp peptide using the lower ionic strength mobile phase. Similarly, increases in analyte recovery (19% and 45%) were observed at the higher ionic strength mobile phase demonstrating the value Premier Technology can offer in conventional analyses (Figure 4). Furthermore, increasing the ionic strength of the mobile phase when using a biocompatible system does not sufficiently mitigate this loss of analyte, as demonstrated by the increased peak areas on the ACQUITY Premier System compared to System X at 0.1% FA. When decreasing mobile phase additive concentration, both systems experienced an increase in peak area and signal/noise for all singly phosphorylated peptides, likely due to less ion suppression. System X demonstrated a decrease in both measures with the doubly phosphorylated peptide that is not observed on the ACQUITY Premier System. This discrepancy indicates that the biocompatible system is more reliant on the mobile phase additive for preventing off-target interactions for difficult analytes. It is important to note that even though the ACQUITY Premier System does not show a large improvement in signal/noise or peak area for the T43pp peptide, the HPS mitigates the loss of performance experienced with the biocompatible system using 0.01% FA. Referring to the chromatograms displayed in Figure 2, we see that T43pp is barely visible on System X but is easily discerned using the ACQUITY Premier System, as indicated by both the peak area and signal/noise measurements. System X exhibits losses in S/N between -29% (T19p) and -90% (T43pp) compared to the ACQUITY Premier System using 0.01% FA mobile phase. These decreases change to -33% and -61% for the same peaks respectively when using the higher ionic strength mobile phase.
LOD was calculated for both conditions on each system using the low-abundance T43pp peptide from the Phosphopeptide Standard injections. A S/N of three was used as the cutoff criteria. Using 0.1% FA the ACQUITY Premier System achieved a LOD of 1.53 pmol, and System X achieved 2.74 pmol. Using the 0.01% FA mobile phase the ACQUITY Premier System achieved a LOD of 5.06 pmol while System X was 10.67 pmol. As expected, the higher concentration of mobile phase additive masks binding sites within the flow path of the system, allowing for a low LOD on both systems. As the concentration of additive is decreased differences between the chromatographic systems becomes more evident as the ACQUITY Premier System demonstrated an LOD 2X lower than System X. This can be attributed to the MaxPeak HPS of the ACQUITY Premier System continuing to limit off target interactions of the analyte within the chromatographic system, even when mobile phase additive concentration is decreased.
The results discussed thus far demonstrate benefits when using HPS technology for MS detection of “sticky” analytes such as phosphopeptides. However, peptide maps are complex and contain many peptides, both phosphorylated and non-phosphorylated. To expand this study to encompass a full peptide mapping method, an enolase digestion standard was used (Figure 6). This standard contains peptides produced by the tryptic digestion of yeast enolase with the four phosphopeptides of the Phosphopeptide Mixture spiked in.9 Nine peptides spanning the gradient were chosen for monitoring via SIR, including the four phosphopeptides. Immediately evident is the superior shape and height of the peaks in the chromatogram on the ACQUITY Premier System. This is confirmed by the peak tailing and peak area measurements shown in Figures 7 and 8. All peaks monitored, including non-phosphorylated peptide peaks, demonstrated lower peak tailing on the ACQUITY Premier System ranging from 12% (T6) to 77% (T43pp) for the 0.01% FA mobile phase and 4% (T4) to 85% (T43pp) for the 0.1% FA mobile phase (Figure 7). Peak area increases using the lower ionic strength mobile phase ranged from 11% (T14) to 113% (T43pp). For the higher ionic strength mobile phase, the T18 peptide did not show a significant change in peak area on the ACQUITY Premier System, but the T6 peptide demonstrated a 212% improvement.
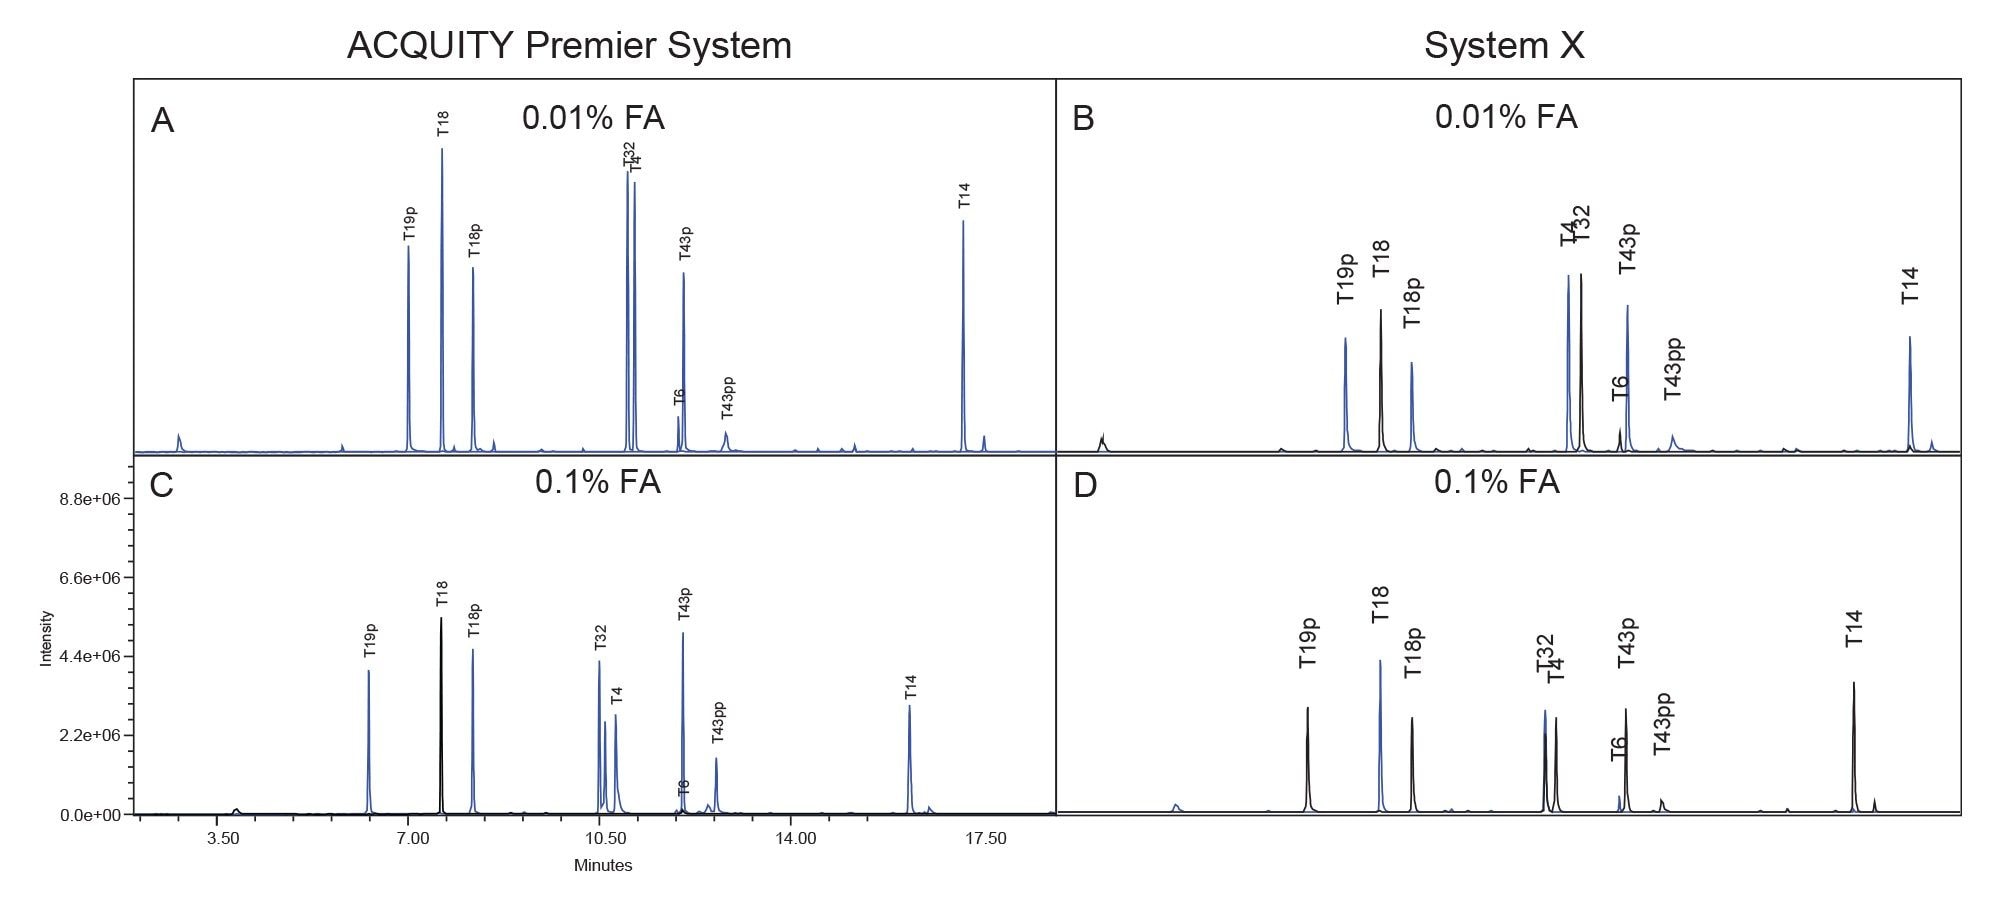
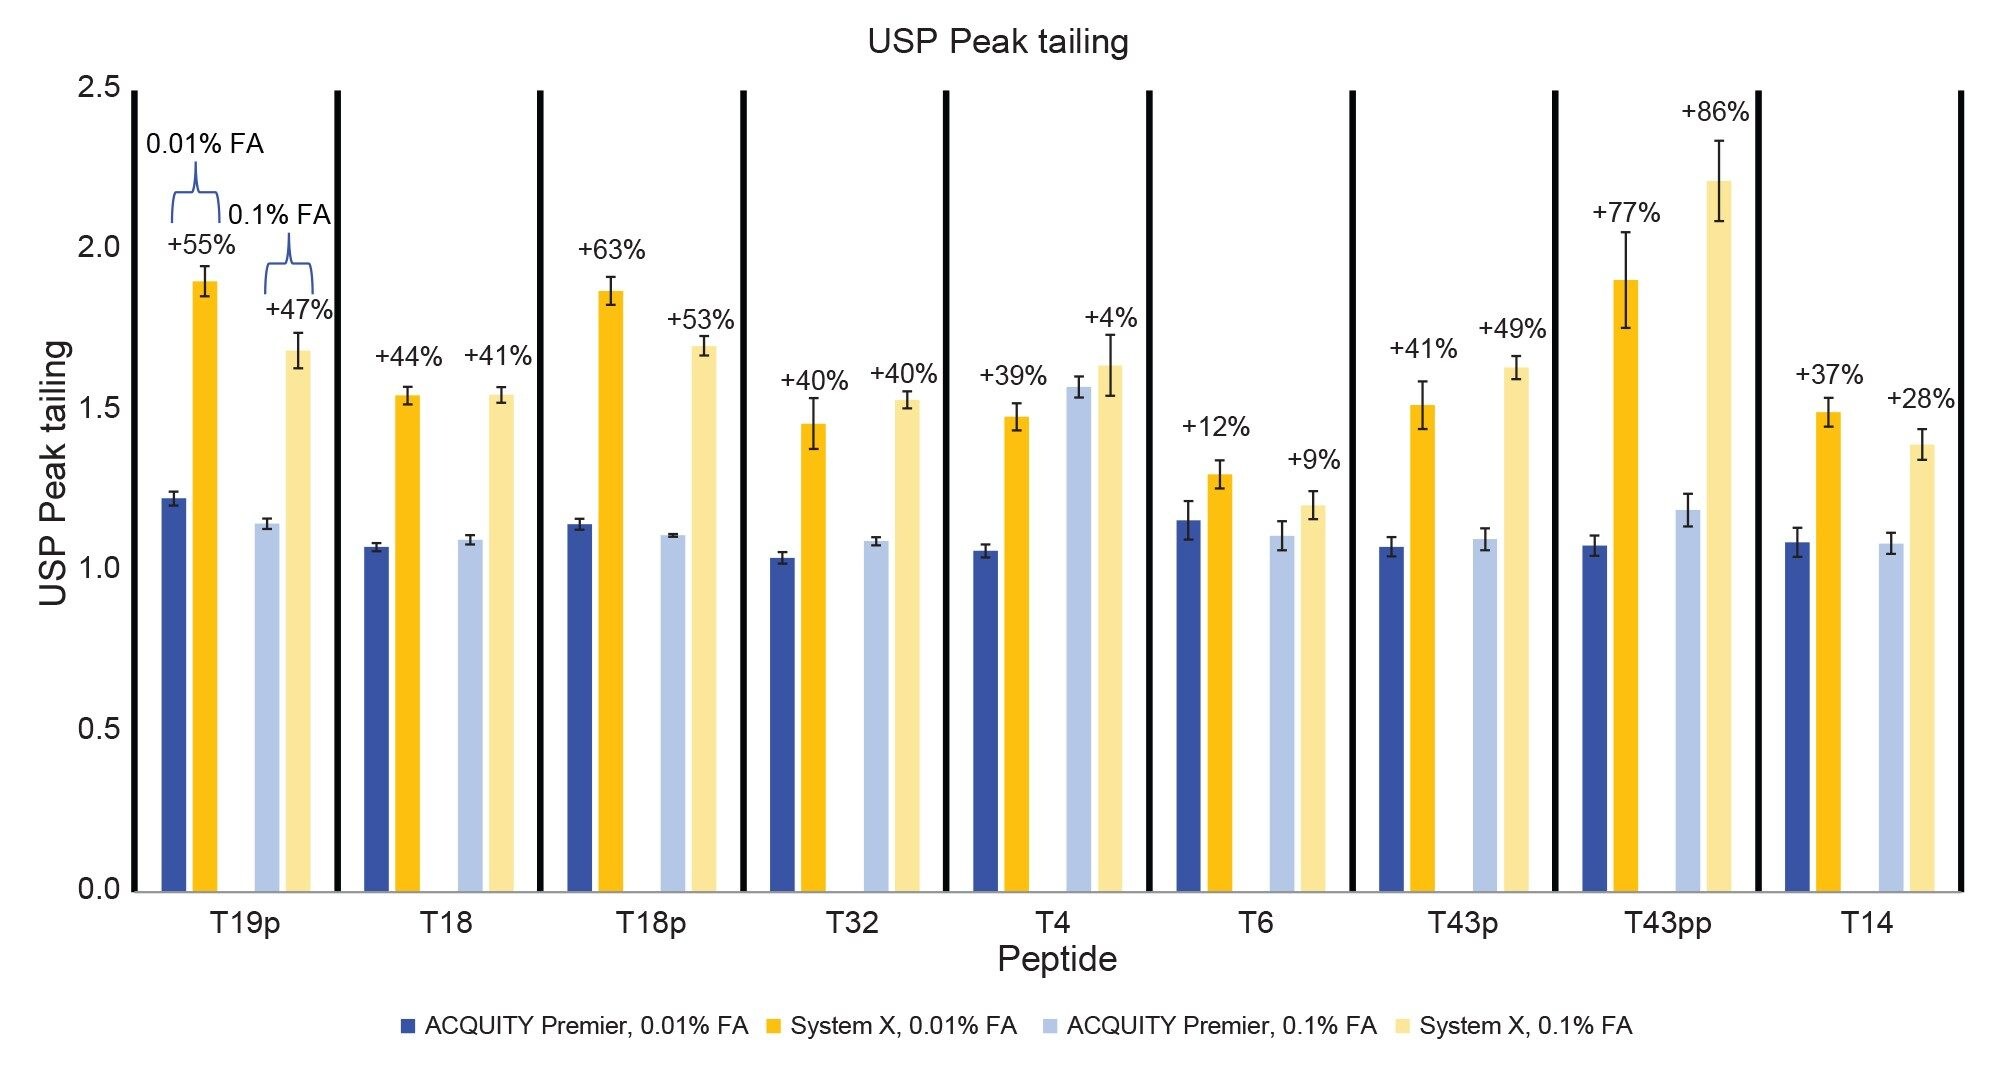
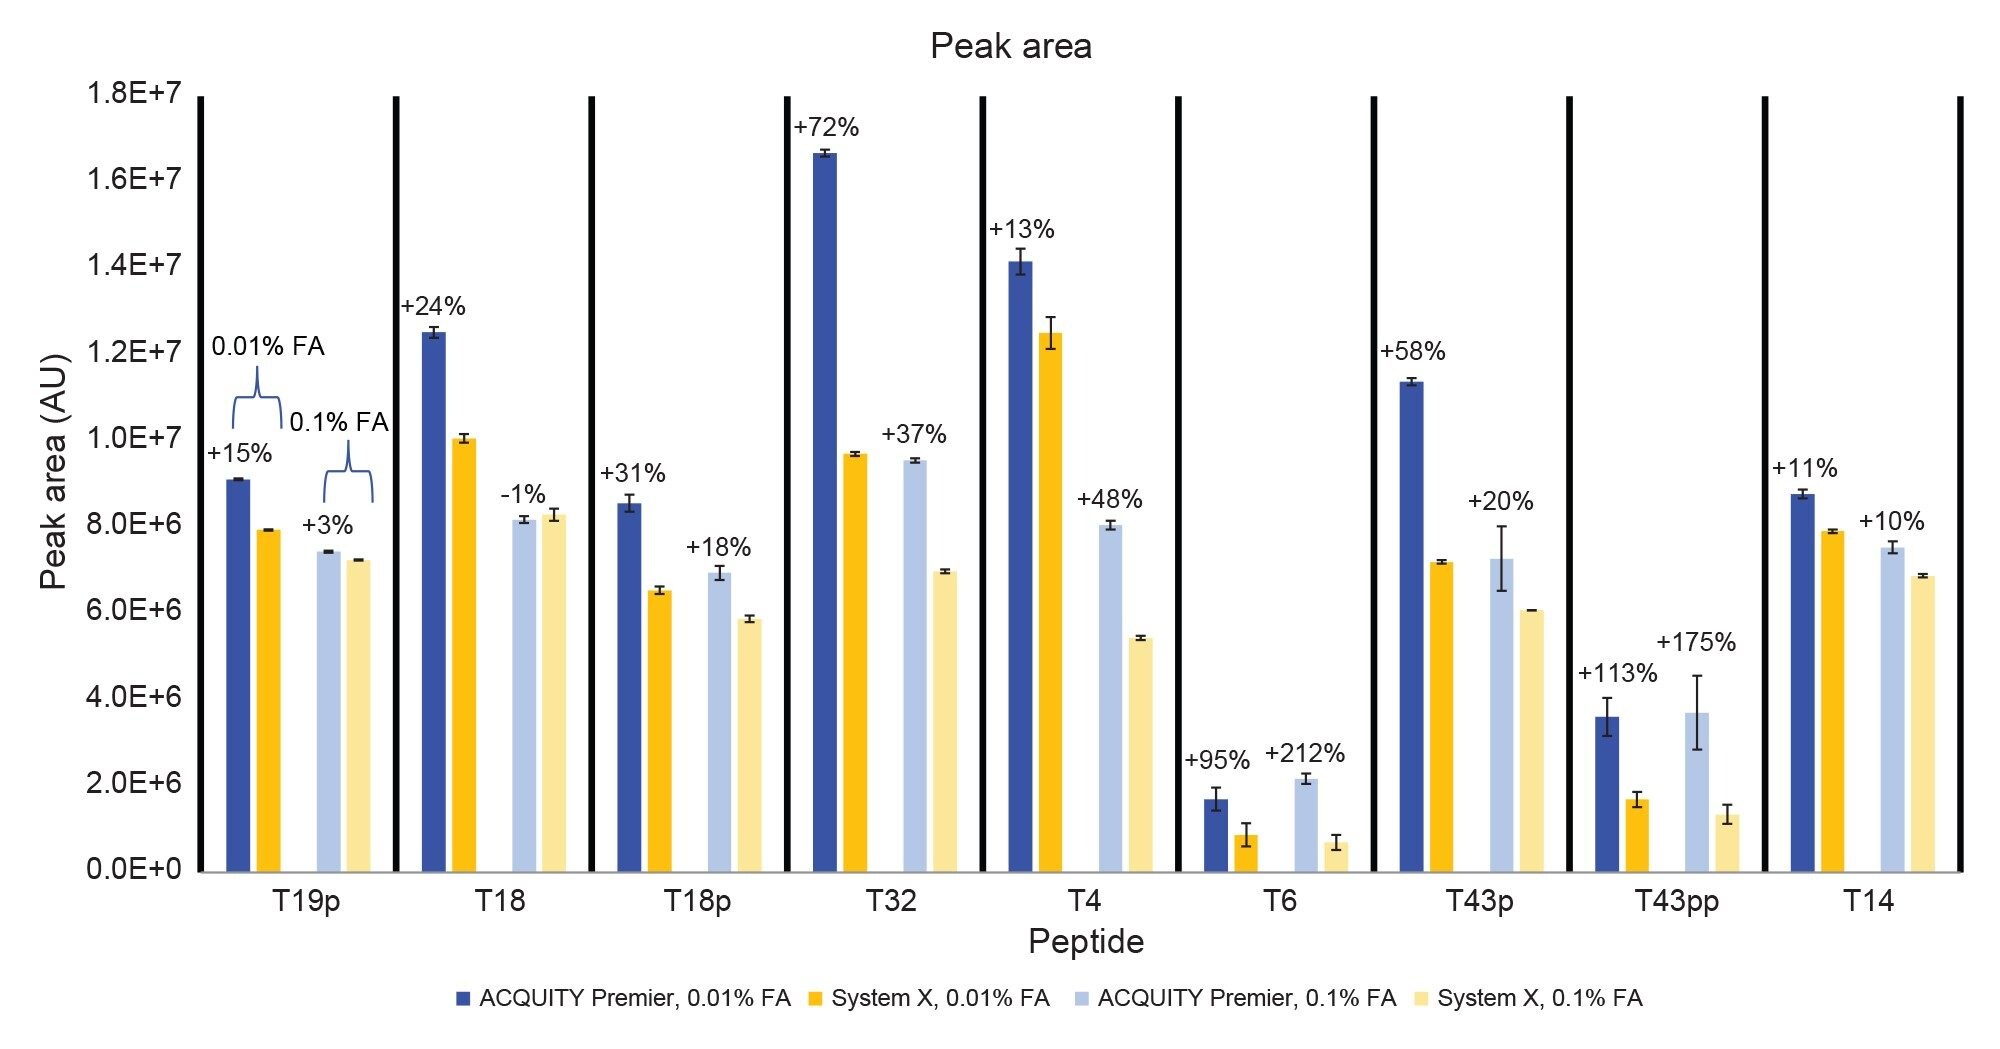
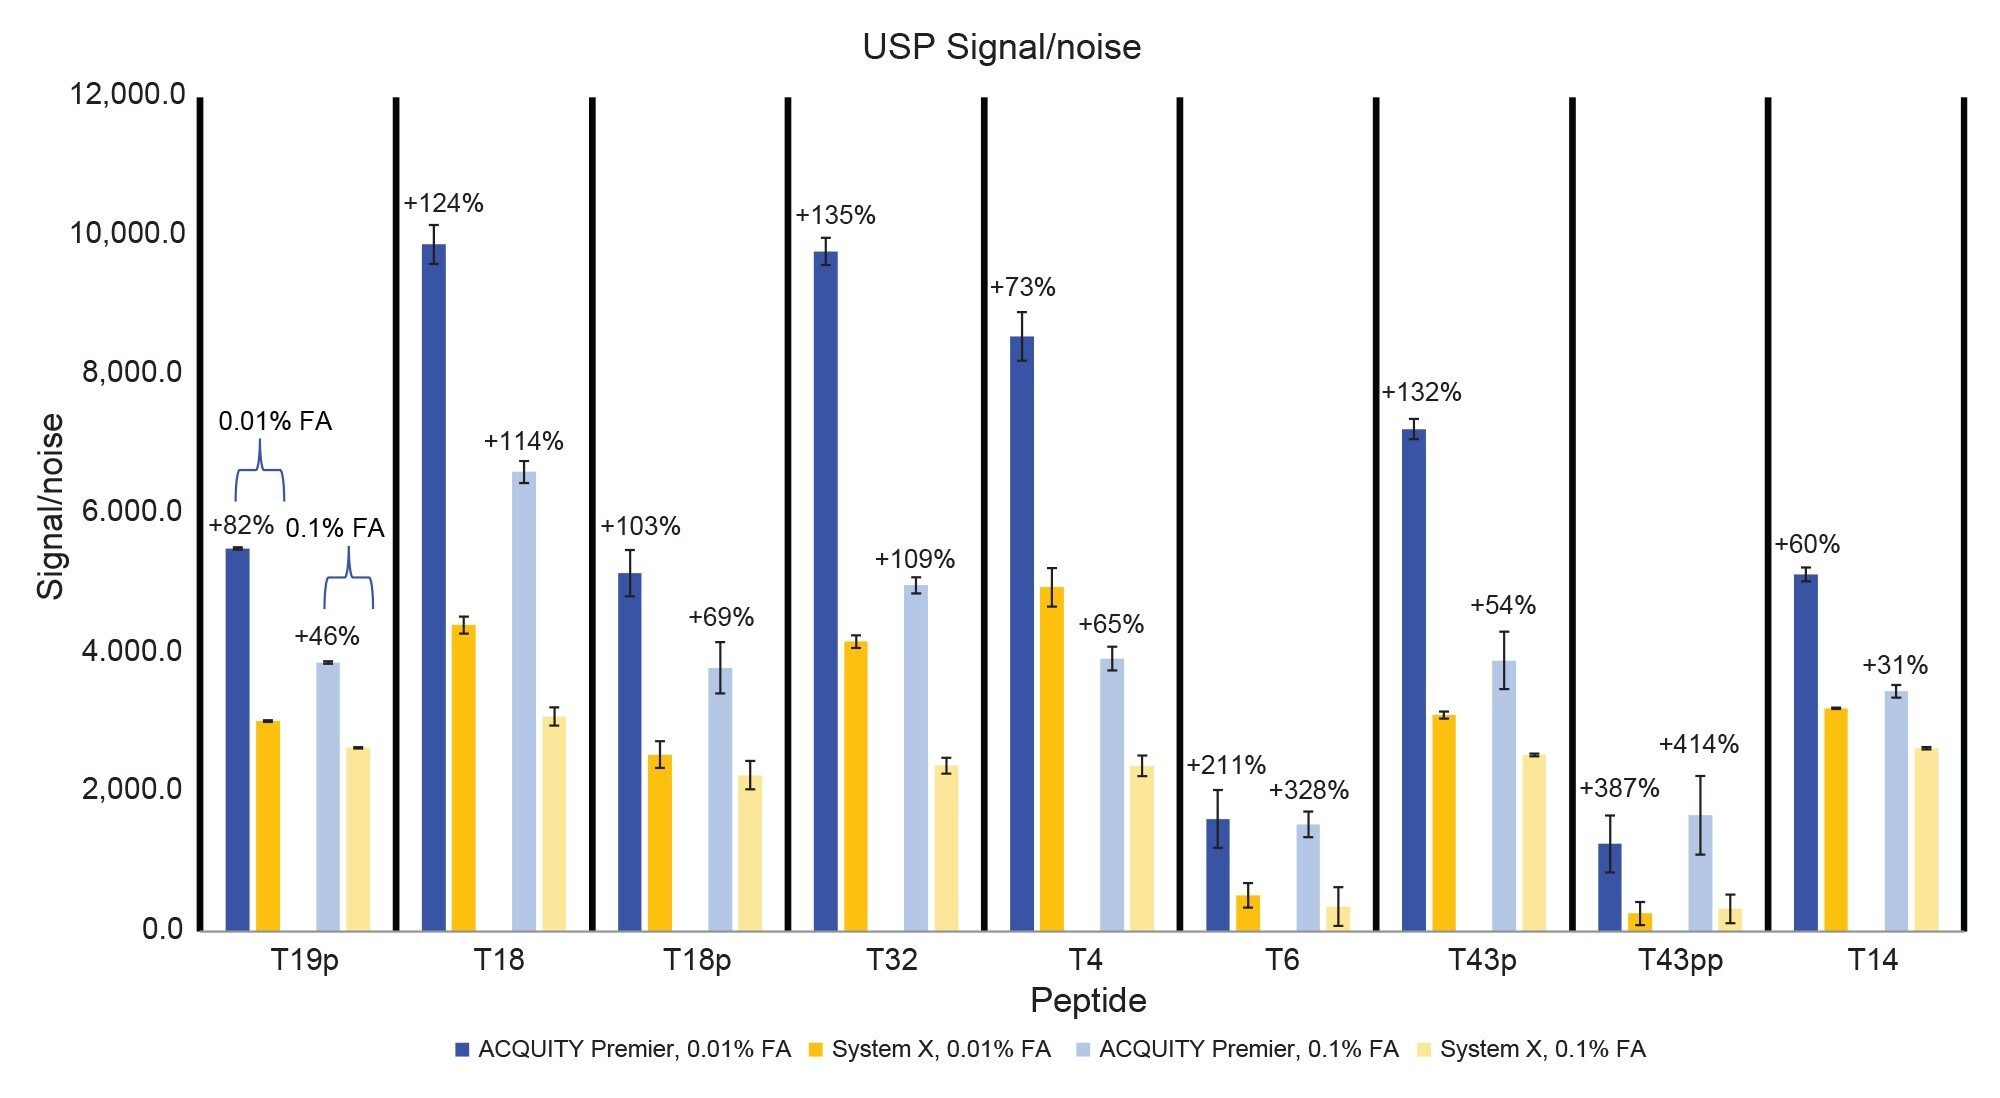
Figure 9 shows a signal/noise comparison between the two systems. Using the high ionic-strength mobile phase the ACQUITY Premier System achieves improvements in signal/noise ranging from 31% (T14) to 414% (T43pp). With the low ionic strength mobile phase these improvements range from 60% (T14) to 387% (T43pp). The largest improvement in this measure is seen with the doubly phosphorylated T43pp peptide, which as discussed earlier, is present in low amounts and can be difficult to detect. Overall, the ACQUITY Premier System equipped with a MaxPeak Premier Column is an excellent chromatographic solution for phosphopeptide mapping studies using mass detection.
Conclusion
The ACQUITY Premier System with MaxPeak High-Performance Surface technology was compared to a traditional biocompatible system for the RPLC-MS separation of phosphopeptides using a MaxPeak Premier Column under two different mobile phase conditions. Using a phosphopeptide mixture, the ACQUITY Premier System demonstrated decreased peak tailing, greater peak area, and better signal-to-noise than the biocompatible system, with greater benefit being derived using a lower ionic-strength mobile phase. These improvements result in lower limits of detection on the ACQUITY Premier System. Using a tryptic enolase digestion with phosphopeptides spiked in, the ACQUITY Premier System outperformed the biocompatible system for both phosphorylated and non-phosphorylated peptides in a complex peptide map. Peak tailing on the biocompatible system increased up to 77% (T43pp, 0.01% FA) and 86% (T43pp, 0.1% FA) depending on the strength of the mobile phase. Increases in peak area and signal-to-noise on the ACQUITY Premier System using the low ionic-strength mobile phase were up to 113% (T43pp) and 387% (T43pp) respectively. These improvements change to up to 212% (T6) and 414% (T43pp) for the same measures using the high ionic-strength mobile phase. The MaxPeak HPS of the ACQUITY Premier System allows users to decrease acidic mobile phase additive for RPLC separations without hindering separation quality, as observed on the biocompatible system. This translates to decreased ion-suppression when using mass spectrometry for peptide assays, resulting in improved signal/noise and ultimately lower limits of detection. Overall, the ACQUITY Premier System with MaxPeak HPS technology enables analysts to generate high quality peptide maps for difficult compounds such as phosphopeptides using conditions that traditional biocompatible systems struggle with.
References
- Lord, J.; Bunce, C.; Brown, G. The Role of Protein Phosphorylation in the Control of Cell Growth and Differentiation. Br. J. Cancer 1988, 58 (5), 549–555. https://doi.org/10.1038/bjc.1988.256.
- Ardito, F.; Giuliani, M.; Perrone, D.; Troiano, G.; Lo Muzio, L. The Crucial Role of Protein Phosphorylation in Cell Signaling and Its Use as Targeted Therapy (Review). Int. J. Mol. Med. 2017, 40 (2), 271–280. https://doi.org/10.3892/ijmm.2017.3036.
- Separation of Phospho- and Non-Phosphopeptides Using Reverse Phase Column Chromatography. FEBS Lett. 1995, 368 (3), 452–454. https://doi.org/10.1016/0014-5793(95)00710-Q.
- Birdsall, R. E.; Kellett, J.; Yu, Y. Q.; Chen, W. Application of Mobile Phase Additives to Reduce Metal-Ion Mediated Adsorption of Non-Phosphorylated Peptides in RPLC/MS-Based Assays. J. Chromatogr. B 2019, 1126–1127, 121773. https://doi.org/10.1016/j.jchromb.2019.121773.
- Núñez, O.; Lucci, P. Applications and Uses of Formic Acid in Liquid Chromatography-Mass Spectrometry Analysis; 2014; pp 71–86.
- Reed, C. E.; Simeone, J.; Hong, P. Demonstrating the Applicability of the ACQUITY Premier Binary System for Long Shallow Gradient Peptide Mapping Analysis. Waters Application Note 720007631. 2022.
- Dao, D.; Koshel, B. M.; Birdsall, R. E.; Yu, Y. Q. Peptide Mapping Retention Time Repeatability Under Shallow Gradient Conditions. Waters Application Note 720007086. 2020.
- Simeone, J.; Hong, P.; McConville, P. R. Performance of the ACQUITY UPLC I-Class PLUS System for Methods Which Employ Long, Shallow Gradients. Waters Application Note 720006290. 2018.
- MassPREP Enolase Digest with Phosphopeptides Mix.
720008136, December 2023