• Application Note

Analysis of Rat Urine Using Rapid Microbore Metabolic Profiling (RAMMP) HILIC Chromatography with Ion Mobility-MS

Analysis of Rat Urine Using Rapid Microbore Metabolic Profiling (RAMMP) HILIC Chromatography with Ion Mobility-MS

  • Adam King
  • Lauren Mullin
  • Paul D. Rainville
  • Robert S. Plumb
  • Ian D. Wilson
  • Waters Corporation
  • Dept. Surgery & Cancer, Imperial College

For research use only. Not for use in diagnostic procedures.

Abstract

Here, we analyzed urine-based samples collected from rats dosed with tienilic acid (TA), a loop diuretic, to demonstrate the benefits and throughput capabilities when using the combined approach of HILIC RAMMP with ion mobility mass spectrometry.

Benefits

  • Rapid analysis for high throughput metabolomics enables increased lab throughput
  • Reproducible separation of polar metabolites using HILIC chromatography
  • Improved peak capacity with an ion mobility workflow demonstrates improved specificity and increased confidence for compound identifications

Introduction

Large scale metabolic phenotyping studies require the ability to perform accurate and reproducible analysis, but when using current profiling LC-MS methods, large sample cohorts can take weeks to complete, often across several batches of analysis. Acquiring the data in these multiple batches can lead to variation in the reproducibility of the assay with differences between batches developing due to variation in signal intensities from day to day.1,2 Reducing the overall batch run time can greatly improve this reproducibility alongside increasing laboratory throughput. Typical LC-MS profiling assays have sample cycle times greater than 10 minutes and in particular, hydrophilic interaction liquid chromatography (HILIC) requires extended re-equilibration phases prior to subsequent sample injections. For example, a continuous analysis based on conventional UPLC for a study cohort of 1000 samples would require several days of instrumentation time. Previous studies utilizing rapid microbore metabolic profiling (RAMMP) have shown comparable group discrimination and improved selectivity over conventional UPLC chromatography.3 The number of overall detected features with RAMMP can be compromised when compared with UPLC. However, combining the RAMMP methodology with data independent acquisition (DIA) strategies involving an ion mobility (IMS) workflow, such as HDMSE,4 results in both high peak capacity and ultimately larger numbers of detected features. Here, we analyzed urine-based samples collected from rats dosed with tienilic acid (TA), a loop diuretic, to demonstrate the benefits and throughput capabilities when using the combined approach of HILIC RAMMP with ion mobility mass spectrometry.

Experimental

Sample Description

Rat urine was collected from 16 rats dosed with tienilic acid, tienilic acid isomer, and a control dose solution of a 0.25M trizma  base solution at two, six, and 24 hours. A pooled sample was prepared by combining 10 µL of all samples (vehicle and dosed)  which was subsequently stored at -20 °C until use. Prior to analysis, each sample was diluted at a ratio of 1:10 with LC-MS grade deionized water. 

LC Conditions

LC system:

ACQUITY UPLC I-Class

Column:

BEH Amide 1.7 μm, 1 mm Å~ 50 mm

Column temp.:

50 °C

Sample temp.:

4 °C

Injection volume:

0.2 μL

Flow rate:

0.2 mL/min

Mobile phase A:

0.1% formic acid in water

Mobile phase B:

0.1% formic acid in acetonitrile

Gradient

Time

%B

0

99

0.03

99

2.33

50

3.33

99

3.33

99

MS Conditions

MS system:

SYNAPT G2 Si

Ionization mode:

ESI +/-

Acquisition range:

50–1200 m/z

Capillary voltage:

2.5 kV

Acquisition mode:

HDMSE 50 to 1200 m/z (low and elevated energy)

Cone voltage:

35 V

IMS T-wave velocity:

700 m/z

IMS T-wave pulse height:

40 V

Collision energy:

Low energy function at 6 eV and elevated energy function 20–50 eV

Resolution:

30,000 FWHM

Data Management

MS software:

MassLynx

Informatics:

Progenesis QI, EZInfo, TargetLynx

Bioinformatics

The LC-MS metabolite data were processed and searched with Progenesis QI. Peak picking and normalized label-free quantification was achieved with additional multi-variate statistical analysis conducted using EZInfo (Umetrics, Sweden). Compound searches were conducted using a variety of database sources, including HMDB.

Results and Discussion

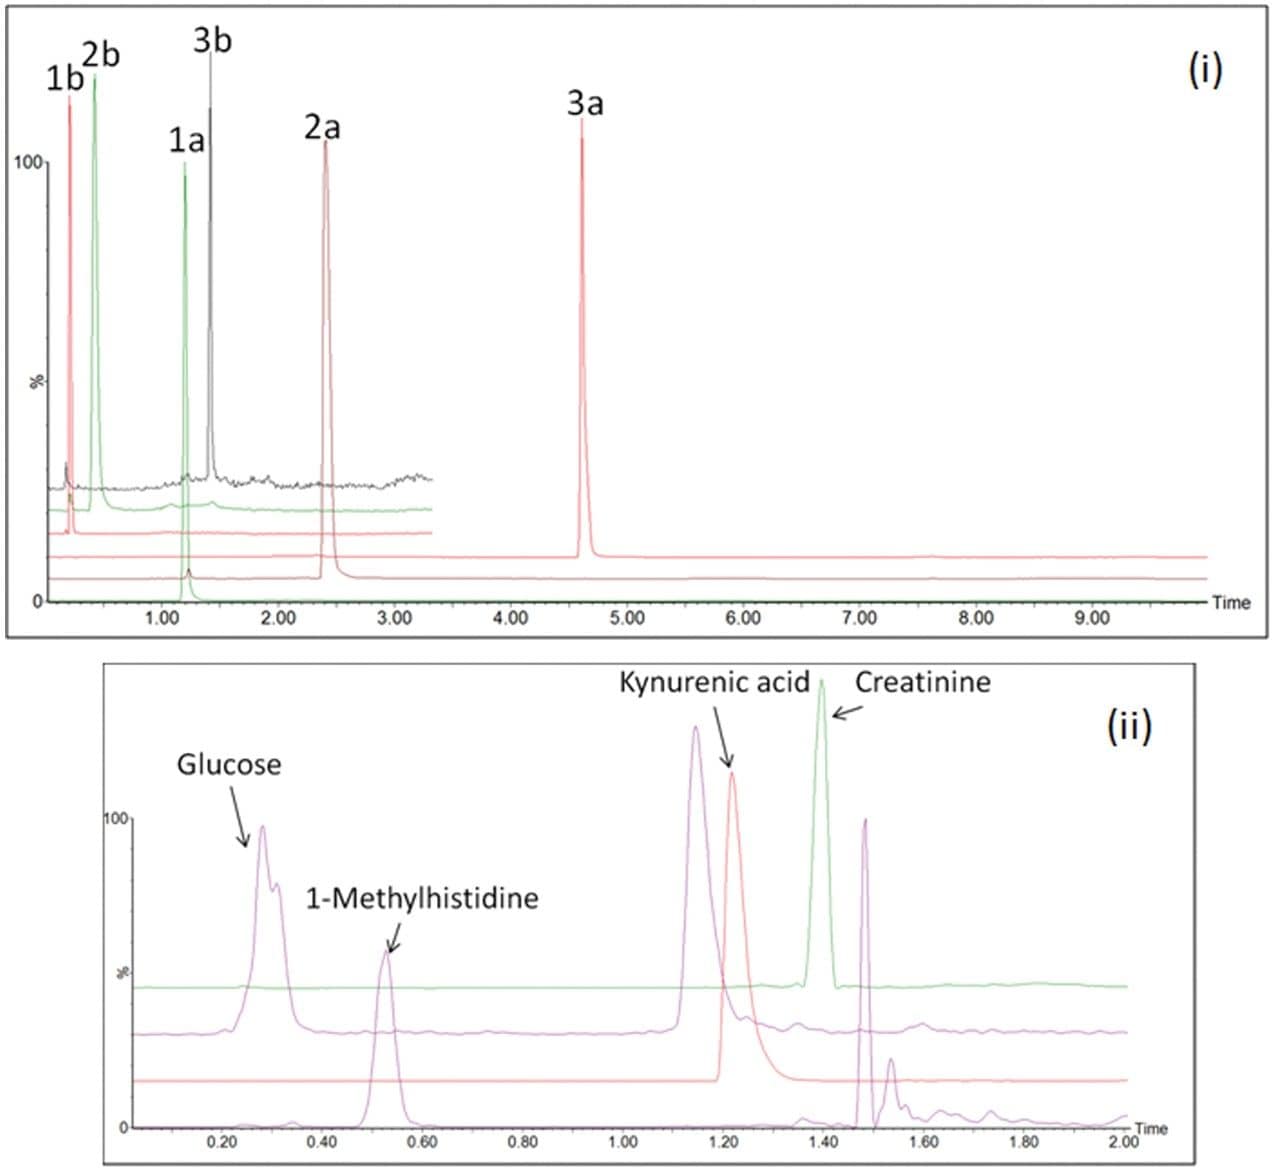
To address issues of batch effects across phenotyping studies, a reduction in the overall batch run time is required. Simply speeding up the chromatographic gradient and shortening  the sample cycle time is not sufficient as this will ultimately affect the overall chromatographic performance, reducing the assays efficiency and fundamentally the reliability. The chromatographic method used in this study was scaled down from a conventional 10 min HILIC profiling method to a RAMMP method of 3.3 min which showed minimal impact on chromatographic separation. Figure 1(i) is an example chromatogram representing a LC-MS system suitability mixture, for comparison of conventional UPLC and RAMMP HILIC.  Extracted ion chromatograms (XIC) for compounds of interest related to the study sample set include compounds such as  glucose, 1-methylhistidine, kynurenic acid and creatinine, which are identified from the pooled QC (Figure 1(ii)) and demonstrate  the utility of the RAMMP HILIC workflow.

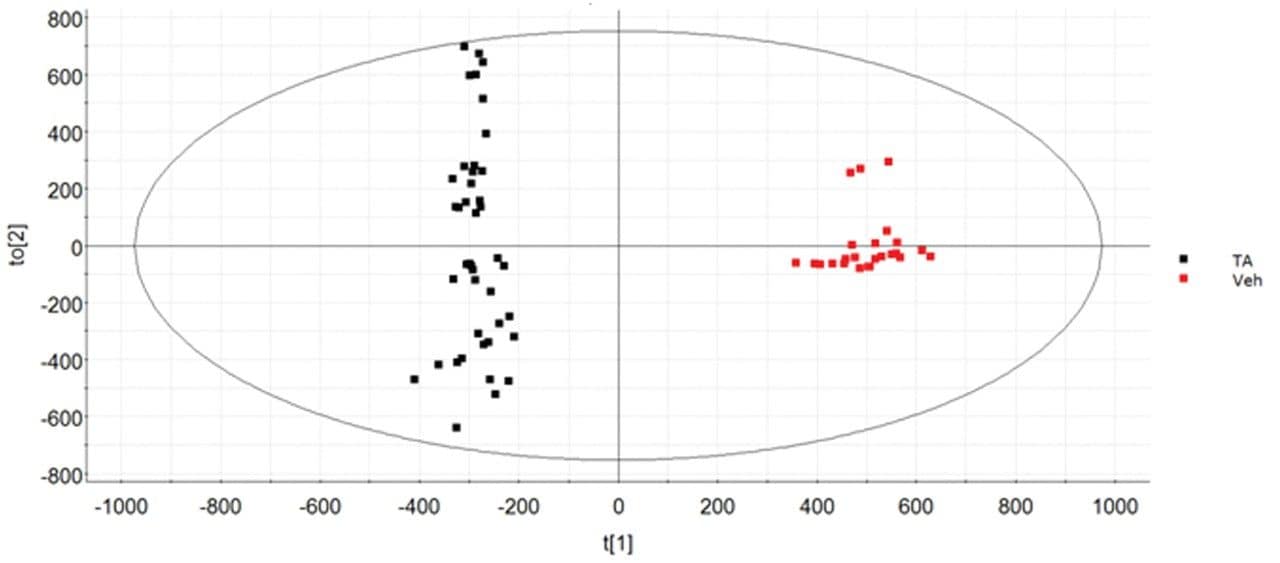
Multivariate statistical analysis (MVA) shows clear separation between vehicle and TA dosed rats, with discrimination between both groups demonstrated when applying an orthogonal partial least squares (OPLS-DA) approach (Figure 2). To ensure that the peak capacity is maintained when switching from conventional UPLC to RAMMP, IMS was implemented as part of the workflow resulting in an overall increased peak capacity of 51%. 

Comparative chromatograms for components of the LC-MS system suitability mix (1 = sulfadimethoxine; 2 = sulfaguanidine; 3 = leucine enkephalin) representing conventional HILIC (a) and RAMMP HILIC (b) respectively. (ii) Example XICs for four endogenous compounds identified in the urine QC pool.
Figure 1. (i) Comparative chromatograms for components of the LC-MS system suitability mix (1 = sulfadimethoxine; 2 = sulfaguanidine; 3 = leucine enkephalin) representing conventional HILIC (a) and RAMMP HILIC (b) respectively. (ii) Example XICs for four endogenous compounds identified in the urine QC pool.
Multi-variate statistical analysis of the analysed urine for TA versus vehicle groups:  (A) OPLS-DA based on the RAMMP HILIC methodology; (B) unsupervised PCA of the pooled QC comparing IMS and non-IMS acquired data.
Figure 2. Multi-variate statistical analysis of the analysed urine for TA versus vehicle groups:  (A) OPLS-DA based on the RAMMP HILIC methodology; (B) unsupervised PCA of the pooled QC comparing IMS and non-IMS acquired data.

As demonstrated previously,5 this correlates with an increased number of detections when implementing IMS (Figure 3). A large proportion of the same statistically validated features are detected in both cases, however an additional 16% are identified as unique to IMS. 

Additional benefits of implementing IMS also include improved spectral clarity and measurement of collision cross section (CCS) values. Figure 4 shows the CCS distribution with m/z for the QC pool highlighting both charge state separation and CCS determination of all detected features, including creatinine and 1-methylhistidine as example compounds. These experimentally determined CCS measurements are within 5% of the predicted CCS values.6 The ability to mobility separate and thereby increase peak capacity provides higher confidence results, containing fewer false positives. Based on the Progenesis QI processed results, cumulative identification scores are shown to have an average increase of 56% for the curated features of the IMS based dataset (Figure 5).

Graphical representation showing an increase in the number of detected features when comparing IMS vs. non-IMS datasets with RAMMP and conventional UPLC. In both cases, features have been curated on the basis of coefficient of variance (CV <30%) and fold changes >2 (TA vs vehicle).
Figure 3. Graphical representation showing an increase in the number of detected features when comparing IMS vs. non-IMS datasets with RAMMP and conventional UPLC. In both cases, features have been curated on the basis of coefficient of variance (CV <30%) and fold changes >2 (TA vs vehicle).
CCS vs. m/z distribution of the pool QC urine. Charge state separation for +1 (purple) and +2 (blue) ions are shown with experimentally determined CCS values highlighted for 1-methylhistidine (136 Å) and creatinine (120.3 Å). The theoretically predicted CCS values for these compounds are 139 and 119.6 Å respectively.
Figure 4. CCS vs. m/z distribution of the pool QC urine. Charge state separation for +1 (purple) and +2 (blue) ions are shown with experimentally determined CCS values highlighted for 1-methylhistidine (136 Å) and creatinine (120.3 Å). The theoretically predicted CCS values for these compounds are 139 and 119.6 Å respectively.
Stacked bar graph illustrating the additional confidence provided by increased identification scores when implementing a DIA-IMS workflow. The identifications for TOF (blue) and IMS (red) presented here are curated based on CV (<30%), fold change (>2) and ANOVA (p<0.05).
Figure 5. Stacked bar graph illustrating the additional confidence provided by increased identification scores when implementing a DIA-IMS workflow. The identifications for TOF (blue) and IMS (red) presented here are curated based on CV (<30%), fold change (>2) and ANOVA (p<0.05).

Conclusion

  • A rapid HILIC profiling assay has been successfully developed and applied for the investigation of polar metabolites originating from rat urine after treatment with tienilic acid.
  • Reducing the analysis time from 10 to 3.3 min using a RAMMP approach has shown that retention and peak shape of polar metabolites is maintained and the same statistically relevant features are identified, whilst increasing throughput and improving batch to batch robustness.
  • Acquiring LC-MS data using an HDMSE workflow has shown increased peak capacity, specificity and spectral clarity, which ultimately provided improves confidence for the identified compounds.

References

  1. Dunn et al. Procedures for Large-Scale Metabolic Profiling of Serum and Plasma Using Gas Phase Chromatography and Liquid Chromatography Coupled to Mass Spectrometry. Nature Protocols. 2011; 6:1060–83.
  2. Dunn et al. The Importance of Experimental Design and QC Samples in Large-Scale and MS-Driven Untargeted Metabolomi Studies of Humans. Bioanalysis. 2012; 4:2249–64.
  3. Gray et al. Development of a Rapid Microbore Metabolic Profiling Ultraperformance Liquid Chromatography-Mass Spectrometry Approach for High-Throughput Phenotyping Studies. Anal. Chem. 2016; 88:5742–51.
  4. Rodr.guez-Su.ez et al. An Ion Mobility Assisted Data Independent LC-MS Strategy for the Analysis of Complex Biological Samples. Current Analytical Chemistry. 2012; 9:199–211.
  5. Ruotolo et al. Peak Capacity of Ion Mobility Mass Spectrometry: Separation of Peptides in Helium Buffer Gas. J Chromatogr B Analyt Technol Biomed Life Sci. 2002; 782:385–92.
  6. MetCCS Predictor Website

720006276, April 2018

Back To Top Back To Top