• Application Note

Determination of Isoflavones in Dietary Supplements: A Comparison of Mass Detection with UV Detection

Determination of Isoflavones in Dietary Supplements: A Comparison of Mass Detection with UV Detection

  • Jinchuan Yang
  • Mark E. Benvenuti
  • Gareth E. Cleland
  • Waters Corporation

Abstract

This study demonstrates that in the analysis of complex samples, such as plant extracts, the use of mass detection greatly reduces the interferences from co-eluting compounds. Furthermore, time-consuming troubleshooting for out of specification results are reduced, which will in turn can improve overall lab productivity and analytical data quality.

Benefits

  • Mass detection generates comparable quantitative results to UV detection.
  • Mass detection helps to reduce co-elution issues found in UV detection.

Introduction

In previous application notes,1,2 we discussed the benefits of the Waters ACQUITY QDa Mass Detector for method development and transfer of a USP isoflavones method3 using a Waters CORTECS C18 Column and the ACQUITY Arc UHPLC System. In the new method, the LC run time was reduced from 74 minutes to 18 minutes.1 The ACQUITY QDa Mass Detector was used in conjunction with a PDA detector to locate the target peaks and identify co-elution issues.2 In this application note, we focus on the quantitative aspect of mass detection. The concentrations of six isoflavones (daidzein, glycitein, genistein, daidzin, glycitin, and genistin) in dietary supplements were determined by the ACQUITY Arc UHPLC method with both PDA and mass detection. The benefits of using a mass detection for  the quantitative determination of isoflavones are illustrated.

Experimental

Sample preparation

The standards, daidzin, glycitin, genistin, daidzein, glycitein, genistein, and apigenin, were purchased from ChromaDex (Irvine, CA) and INDOFINE Chemical (Hillsborough Township, NJ). The structures of relevant isoflavones are shown in Figure 1. Defatted powdered Soy RS was purchased from US Pharmacopeia (Rockville, MD). NIST SRM 3238 was purchased from NIST (Gaithersburg, MD). Isoflavone dietary supplement samples from major brands were purchased from online retail stores.

The standard and sample solutions were prepared the same way as in the USP isoflavone method.3 Sample solutions were further diluted with acetonitrile water mixture (2/3 by volume) to various levels to fit the calibration range. The concentration of the internal standard was kept constant at 4 ppm.

Figure 1. Structures of the isoflavones in this study.

UHPLC conditions

UHPLC system:

ACQUITY Arc

UV system:

2998 PDA

Software:

Empower 3

Column:

CORTECS C18 2.7 μm, 3.0 x 100 mm (186007372)

Column temp.:

30 °C

Mobile phase A:

Water with 0.1% formic acid

Mobile phase B:

Acetonitrile with 0.1% formic acid

Injection volume:

2.0 μL

Flow rate:

1.08 mL/min

Run time:

18.0 min

UV detection:

260 nm

UV resolution:

1.2 nm

Elution gradient:

Time (min)

Flow rate (mL/min)

%A

Curve

Initial

1.08

90

6

14.40

1.08

70

6

14.50

1.08

10

6

15.20

1.08

10

6

15.40

1.08

90

6

18.00

1.08

90

6

MS conditions

MS system:

ACQUITY QDa (Performance)

Polarity:

ESI+

Capillary voltage:

0.8 kV

Cone voltage:

15 V

Probe temp.:

600 °C

SIR masses:

See Table 1

Table 1. Masses of isoflavone molecular ions.

Results and Discussion

Comparison of UV and mass detection for calibration and detection sensitivity

The UV (260 nm) and the ACQUITY QDa single ion recording (SIR) chromatograms of the USP reference materials (heated and unheated defatted soy powder) are shown in Figure 2. Details of the method development and transfer can be found in the references.1,2 The ACQUITY QDa calibration results for daidzein, glycitein, genistein, daidzin, glycitin, and genistin are shown in Table 2. Both linear and quadratic fit models were evaluated in the regression analysis of the mass detection data. The quadratic model had a better fit with the ACQUITY QDa response than the linear model and was therefore used. A linear regression model was used with the UV data as shown in Table 3. The limit of quantitation (LOQ) in mass detection is compound dependent (Tables 2 and 3). For the glycitein and the daidzein, the ACQUITY QDa's LOQs are about four times more sensitive than the UV LOQs, while for the daidzin, UV detection has approximately twice the sensitivity of the ACQUITY QDa. The acetyl and malonyl isoflavones are not stable, and their standards are not commercially available. The calibration curves for these acetyl and malonyl isoflavones were not constructed in this study. 

Figure 2. UV chromatograms of unheated defatted soy (black, the bottom trace) and heated defatted soy (red trace next to the bottom one), and the corresponding SIR traces (top) for each compound. The SIR traces from unheated defatted soy are shown here. Peak ID: 1. Daidzin; 2. Glycitin; 3. Genistin; 4. Malonyl daidzin;  5. Malonyl glycitin; 6. Acetyl daidzin; 7. Acetyl glycitin; 8. Malonyl genistin; 9. Daidzein; 10. Glycitin; 11. Acetyl genistein; 12. Genistein; 13. Apigenin.

Table 2. Isoflavones mass detection calibration results and LOQs.

*: RSD% values were calculated from at least 20 injections.

Table 3. Isoflavones UV calibration results. 

Comparison of isoflavone results in dietary supplements

The ACQUITY QDa Mass Detector and UV results for the NIST reference materials (NIST 3238 SRM) are shown in Table 4. The relevant NIST certified values are also listed for comparison. The mass detection results are within ±4% difference from the UV results, and showed a 4 to 11% difference from the NIST certified values. A literature search found that a high daidzein value was also reported elsewhere.4 The average repeatabilities of mass detection and UV results (n=3) have RSDs that are less than 2.2% and 1.1%, respectively.

Table 4. Comparison of the QDa results, the UV results, and the certified values for NIST 3238 SRM.

†:n=3;  

*: Determined from UV peak height.

The quantitation results for the isoflavones in four dietary supplements are shown in Table 5. These dietary samples were purchased from retail stores and represent typical dietary supplements from plant sources (soy and red clover). The mass detection and UV results for all except one isoflavone in these samples are comparable to each other with less than 10% difference. The QDa results for genistin in Sample E was 37% less than the UV results. A closer look at the mass spectrum at the peak apex of genistin in Sample E (see Figure 3) shows a base peak of m/z 166.8 Dalton (the most intense peak in mass spectrum), which was not present in the mass spectrum of the standard. This indicates that most likely there may be an additional compound(s) that co-elute with the genistin peak, and contribute to the genistin’s UV peak, leading to a higher UV result for genistin compared to the ACQUITY QDa result. The mass spectra for the other isoflavones in Sample E were comparable to the mass spectra of their corresponding standards.

Table 5. Comparison of the mass detection and UV results for dietary supplements from plant sources.

*Peak heights were used in quantitation.

Figure 3. Comparison of the genistin’s UV peaks and the mass spectra (background subtracted) for Sample E and the standard.

Mass detection helps to reduce co-eluting errors in UV detection

It is important to note that due to the complex sample matrix, co-elution often occurs in isoflavones analysis. It was found that the UV peaks of daidzein in Sample C and in the NIST 3238 SRM had small fronting, and the UV peak of glycitin in Sample B showed some tailing. Figure 4 shows the UV peak fronting for the daidzein in NIST 3238 SRM. This is not surprising because these samples are from plant extracts. The quantitation error that is caused by these minor interferences could be removed by using a different quantitation approach, such as using the UV peak heights instead of UV peak areas. However, for interfering compound(s) that elute closely with the target analytes, such as the example shown in Figure 3, the selectivity of the ACQUITY QDa Mass Detector  is required to enable accurate determination.

Figure 4A. Comparison of the UV (top) and the SIR (bottom) peaks for the daidzein in NIST 3238 SRM. A small peak fronting is observed in the UV, but not in the SIR peaks. 4B. Comparison of the mass spectra (background subtracted) from the MS scan channel at daidzein peak’s apex (top) and the peak front (bottom) for NIST 3238 SRM. The mass spectrum at peak front is different from the spectrum at peak apex. This confirms that the peak front is caused by a compound other than the daidzein.

Conclusion

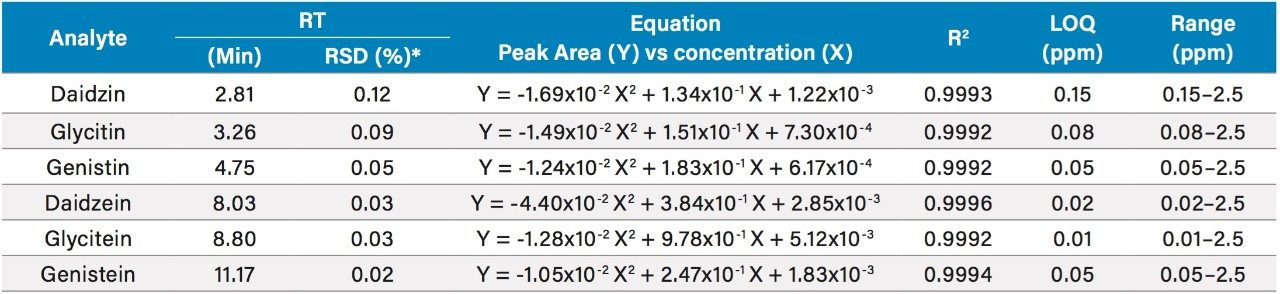
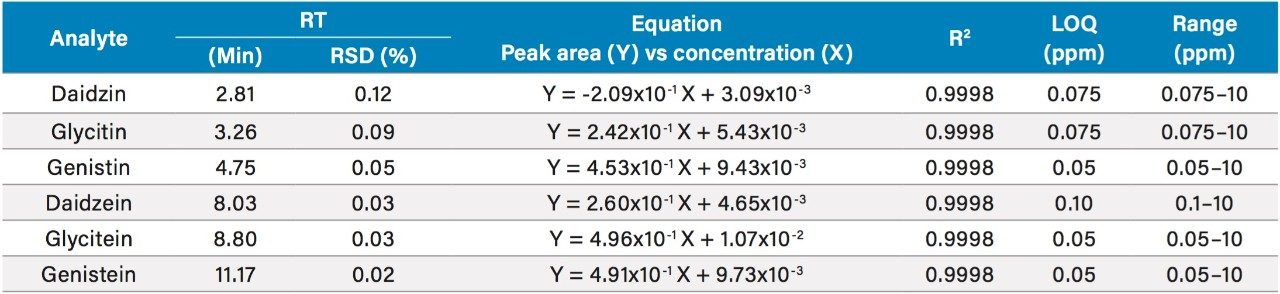
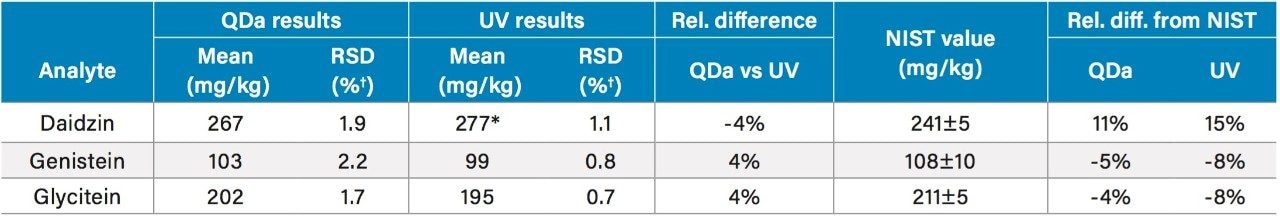
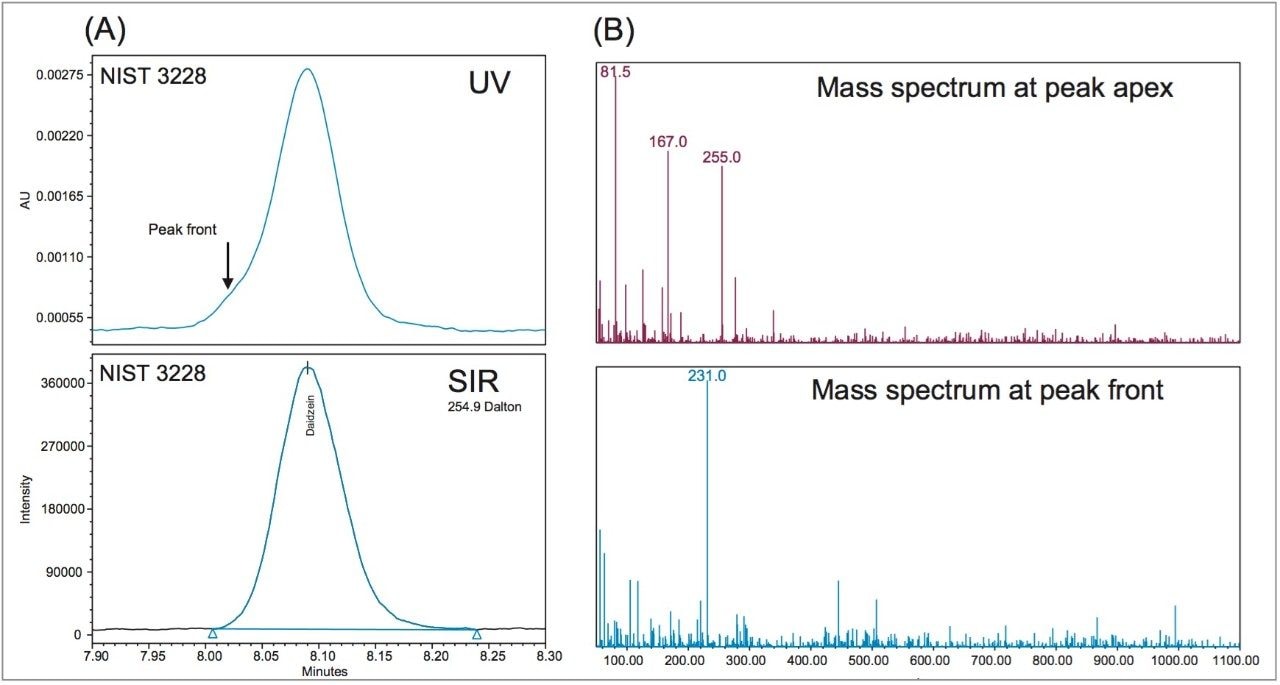
The isoflavone concentrations in NIST reference materials and in dietary supplements were determined by a fast UHPLC method using a  CORTECS C18 Column and the ACQUITY Arc UHPLC System equipped  with the ACQUITY QDa Mass Detector and the 2998 PDA Detector. For the NIST reference materials, the daidzein, genistein, and glycitein results from mass detection agree with the UV results (less than 4% difference), and  QDa mass detection results are within 4 to 11% of the NIST certified  values. The repeatability (RSD) using mass detection are comparable to UV detection. 

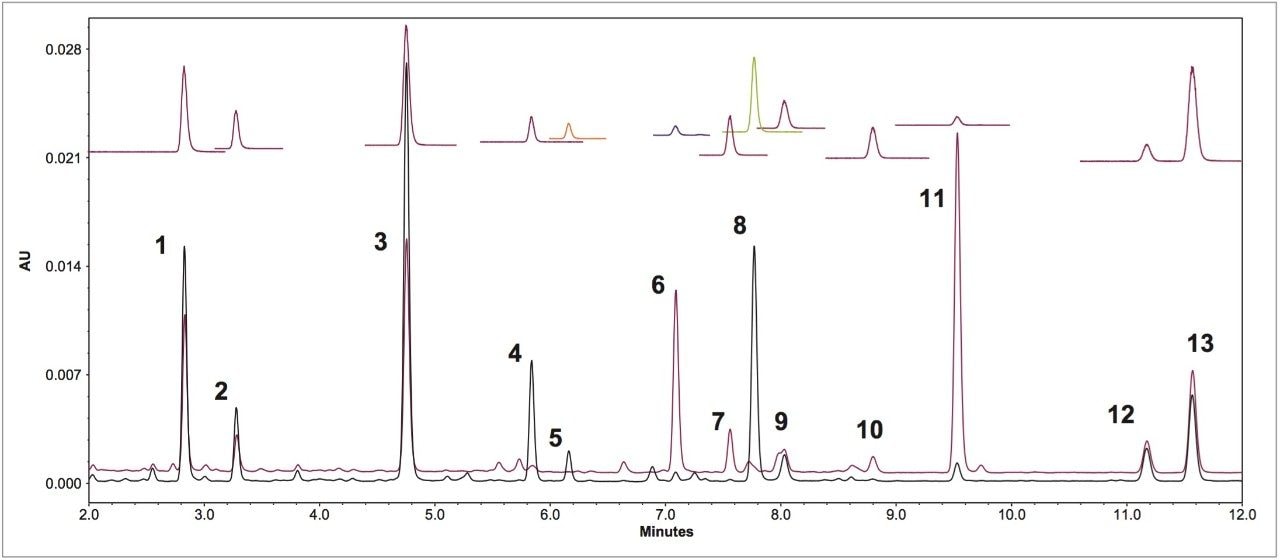
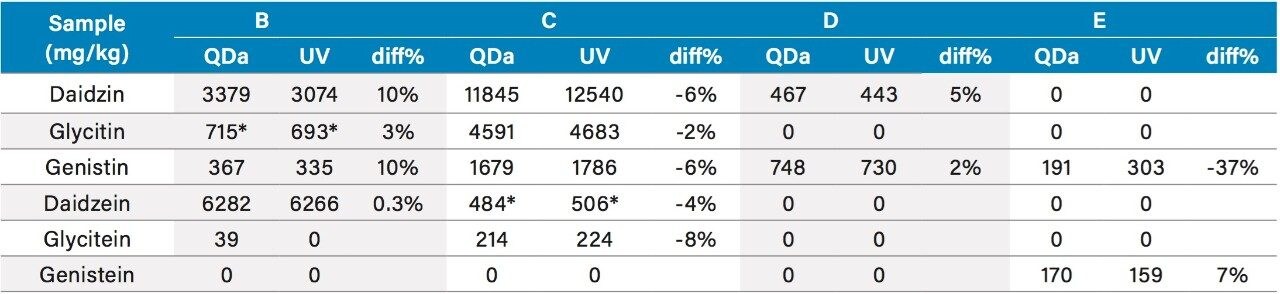
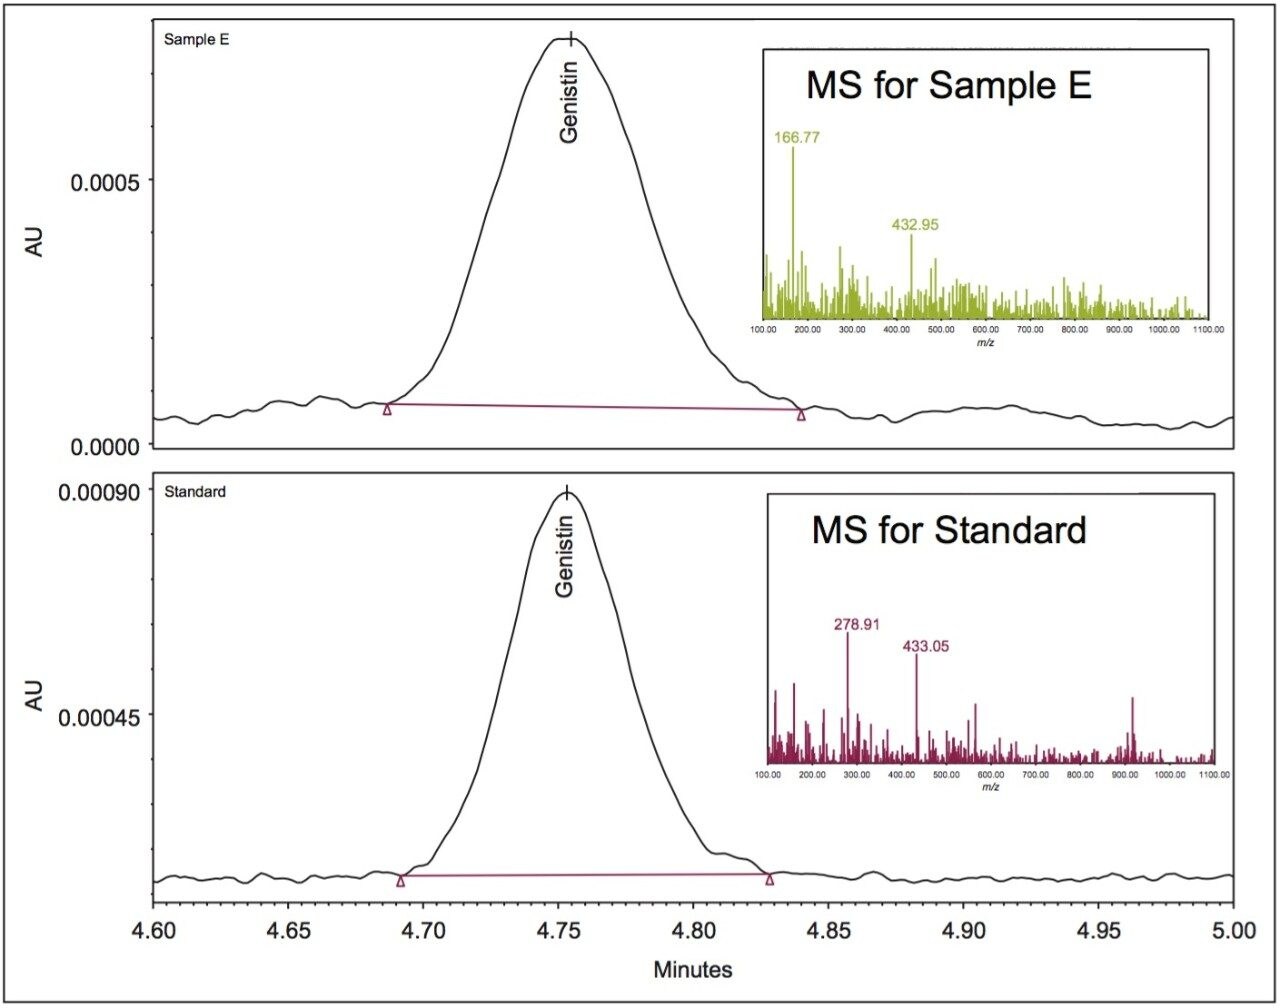
For the dietary supplements, the QDa mass detection results are comparable to the UV results with less than 10% difference for all six isoflavones except for the genistin concentration in one sample (Sample E). The large difference (37%) between the mass detection and UV results for genistin in Sample E was attributed to a co-eluting interference. 

This study demonstrates that in the analysis of complex samples, such as plant extracts, the use of mass detection greatly reduces the interferences from co-eluting compounds. Furthermore, time-consuming troubleshooting for out of specification results are reduced, which will in turn can improve overall lab productivity and analytical data quality.

References

  1. J Yang, M Benvenuti, G Cleland. Fast Analysis of Isoflavones in Dietary Supplements – USP Method Transfer onto a UHPLC System. Waters application note no. 720005858en, 2016.
  2.  J Yang, M Benvenuti, G Cleland. Fast Analysis of Isoflavones in Dietary Supplements – Benefits of Mass Detection in Method Transfer and Sample Analysis. Waters application note no 720005814en, 2016.
  3. USP Monograph. Powdered Soy Isoflavones Extract, USP39–NF34 S1 [6841], The United States Pharmacopeial Convention.
  4. L X Zhang, C Q Burdette, M M Phillips, C A Rimmer, R K Marcus. Determination of isoflavone content in SRM 3238 using liquid chromatography-particle beam/electron ionization mass spectrometry, J AOAC Int. 98(6): 1483–1490, 2015.

720005890, February 2017

Back To Top Back To Top