This application note describes the analysis of extracts from Passiflora species using real time centroid exact mass measurement. The system used comprised of an LCT orthogonal acceleration (oa-Tof) time of flight Mass Spectrometer with LockSpray source, Waters 2996 PDA and Waters Alliance HT 2795 Separations Module.
EU Directive 2001/83/EC will regulate and produce a set of harmonized assessment criteria for the efficacy and safety "Herbal Medicinal Products for traditional use". The current and future E.U. member states will produce and abide by this directive, making 28 states in total. ESCOP (European Scientific Cooperative on Phytotherapy) aim to influence the EU in order to change law, so that patent protection can apply to the properties of natural products discovered, as a result interest in this industry will grow.
Recently issues have arisen with Kava Kava, a natural health product, which is used for its anti-depressant and anti-anxiety properties. Investigations into the safety of Kava have taken place within several European countries, including Germany, U.K., Switzerland, France, Spain and parts of Scandinavia. In Switzerland and Germany cases of liver damage were reported. In the US the FDA has investigated Kava's safety, where as in Canada the public were advised not to take the supplement until product safety could be assured. The Kava market in Germany alone is $25m. Proving the efficacy of such a product is economically viable. Such issues illustrate how regulation currently affects the natural health product market and also why new legislation is required.
The European Pharmacopoeia is constantly updating and assessing the monographs produced for the assessment of herbal medicines.
A plant species profile can be affected by the environment in which it grows, therefore there is a necessity to profile plant makeup.
Trends and challenges in Phytomedicine research will require:
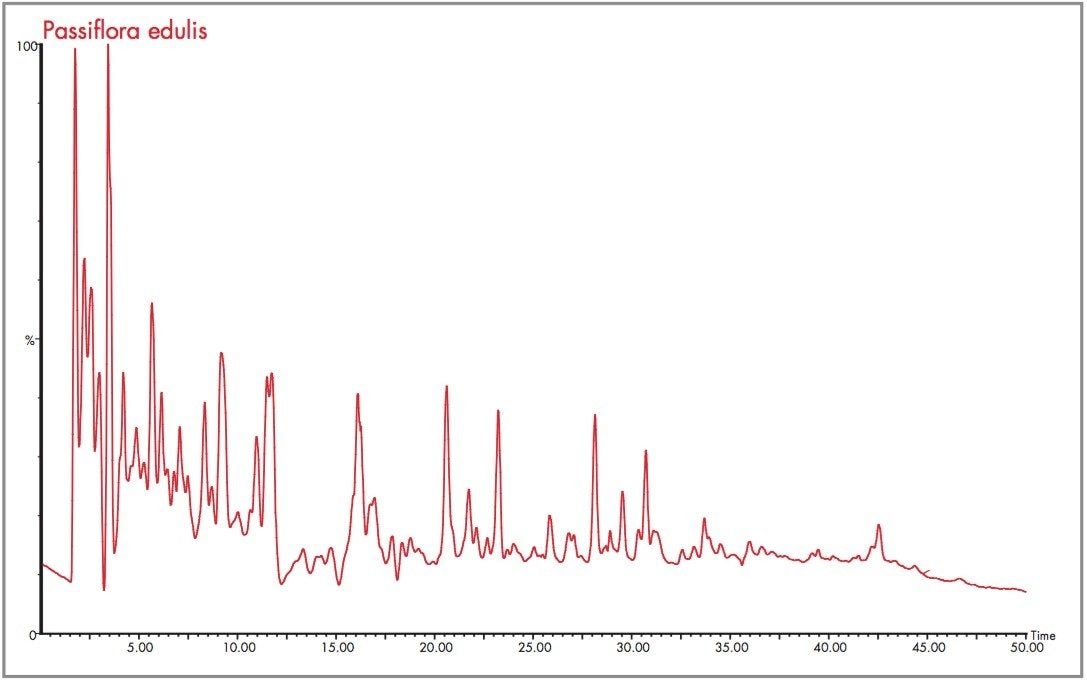
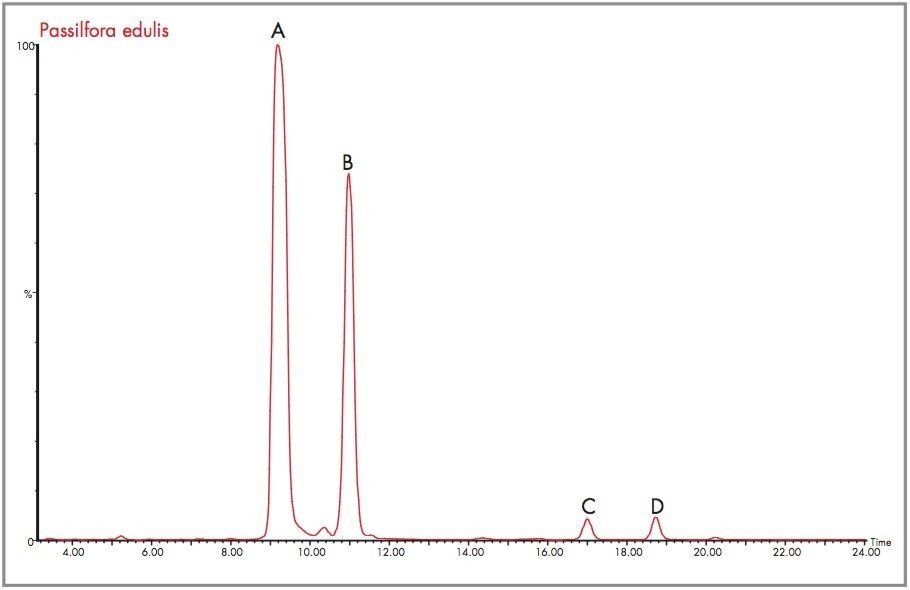
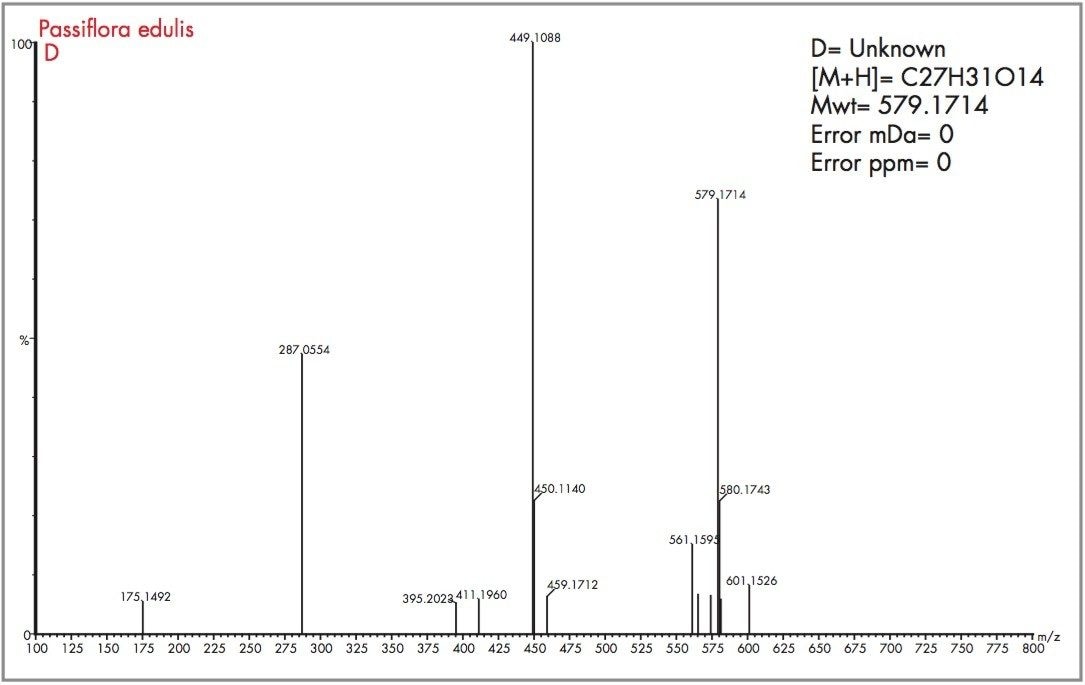
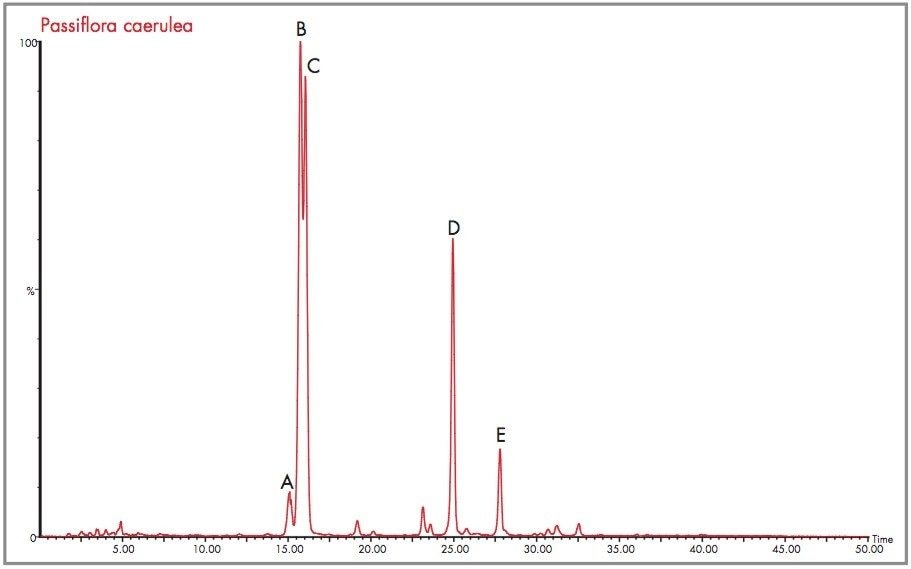
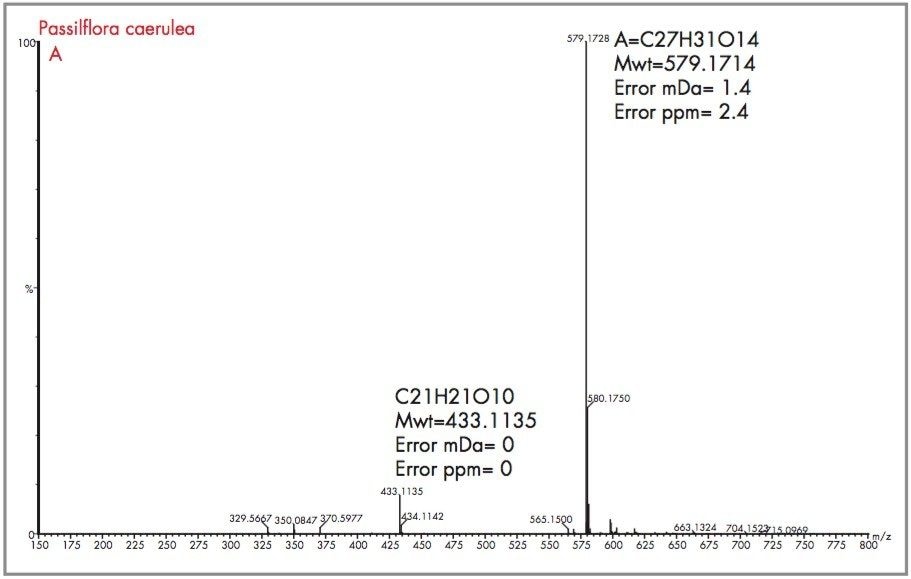
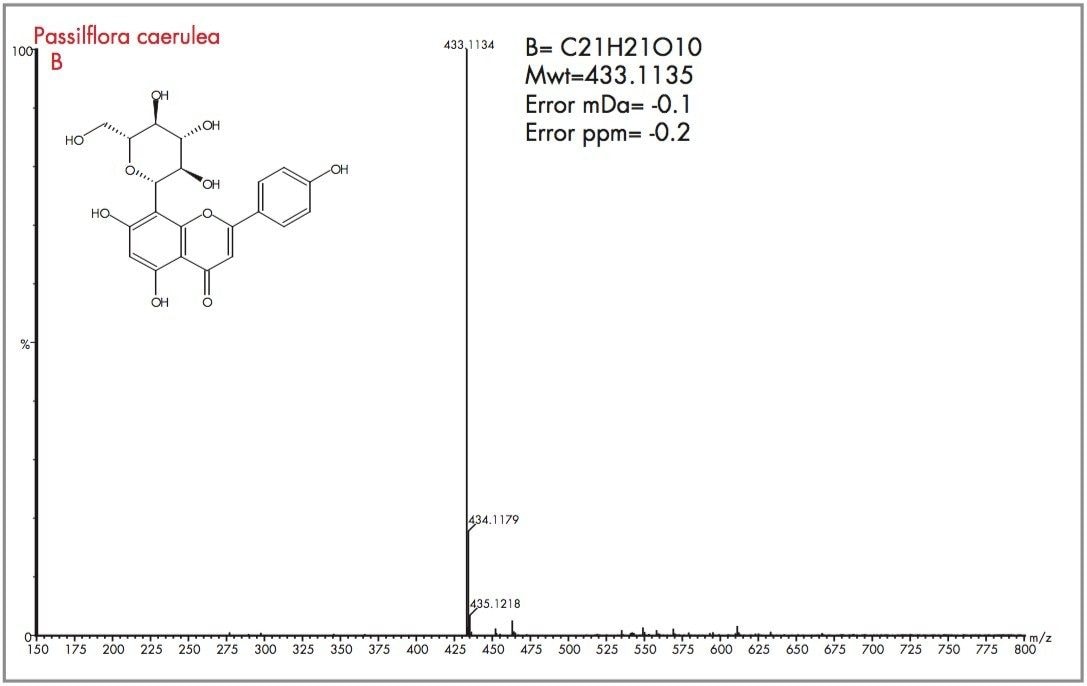
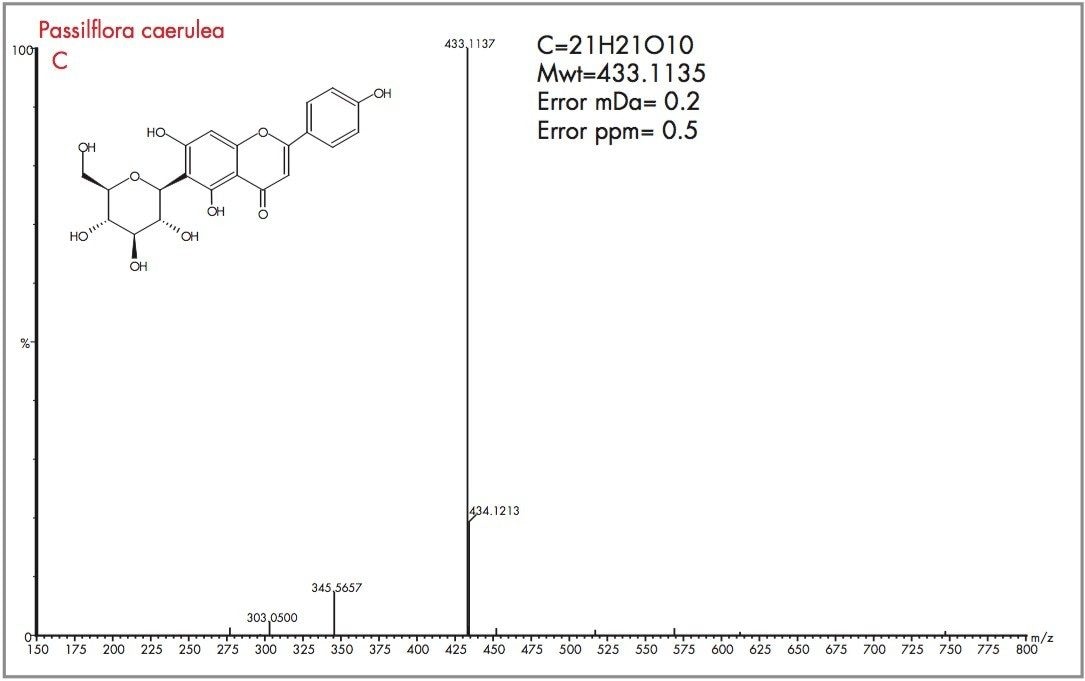
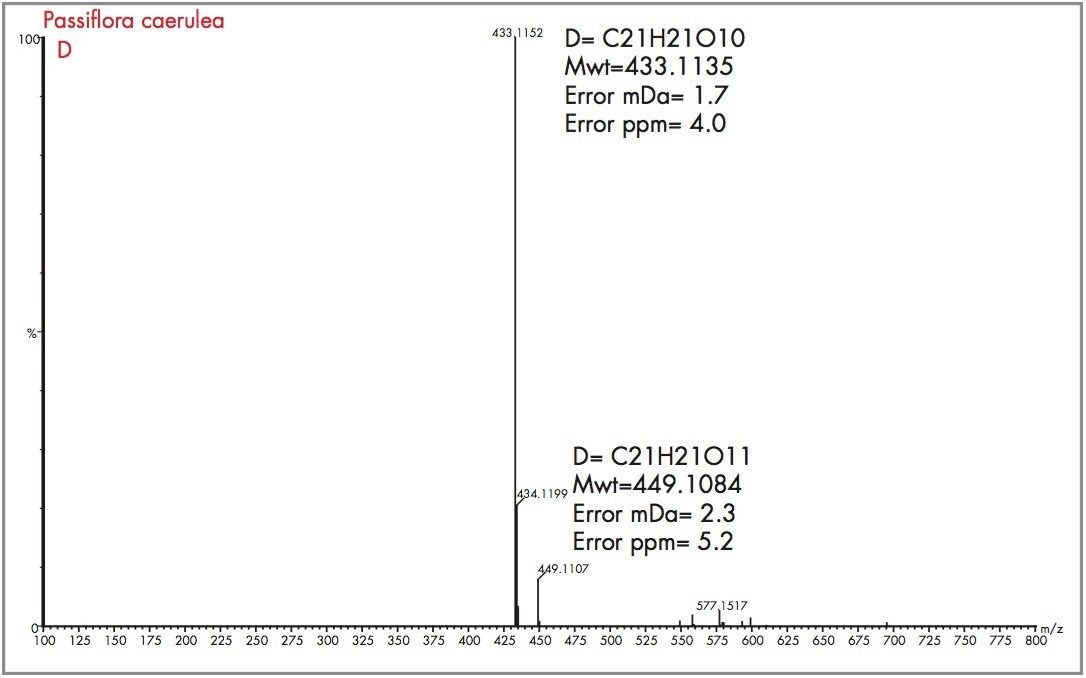
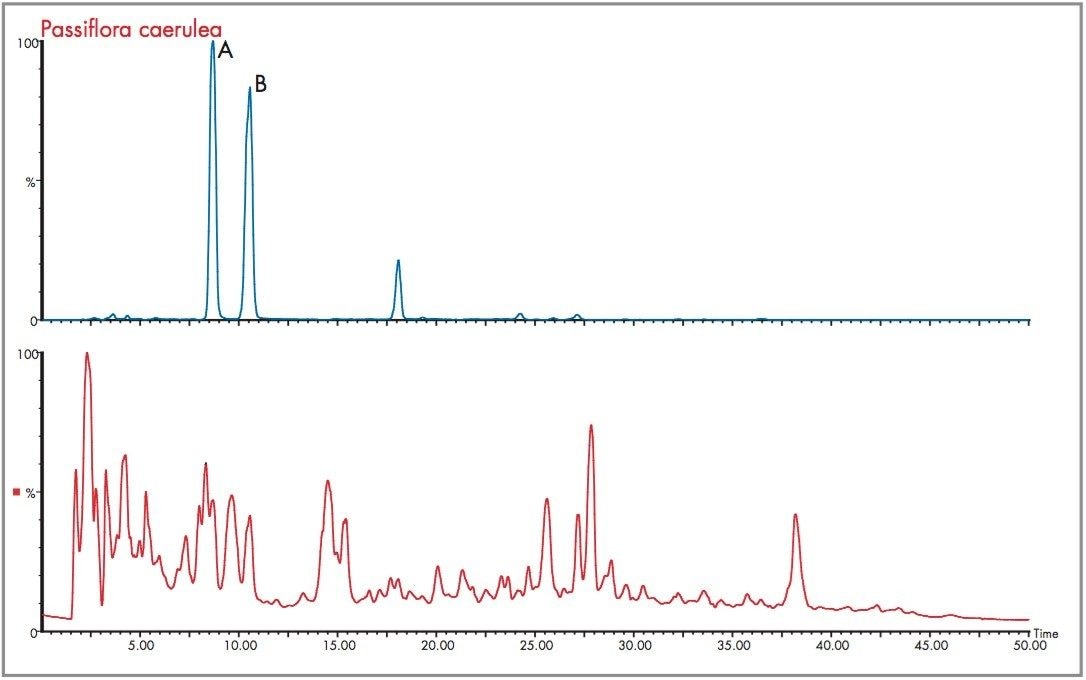
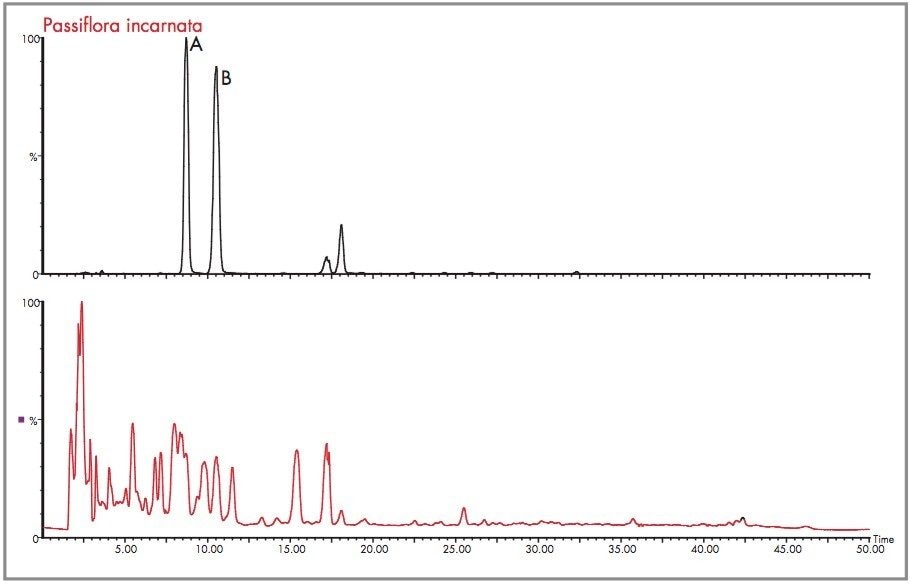
For this study analysis of Passiflora species has been performed. Several Passiflora (Passifloraceae) species are utilized as phytomedicines (sedative/tranquilizing). Passiflora incarnata L. (Passifloraceae) is widely known in Europe due to its sedative and tranquilizing properties. However in the Brazilian climate this Passiflora species does not grow very well. Here an alternative to Passiflora incarnata indicated by the Brazilian Pharmacopoeia is the species Passiflora alata and this has been found to be frequently substituted by Passiflora edulis (utilized in juices). Additionally, P. caerulea should also be studied due to its utilization in Argentina and possibly also in South Brazil.
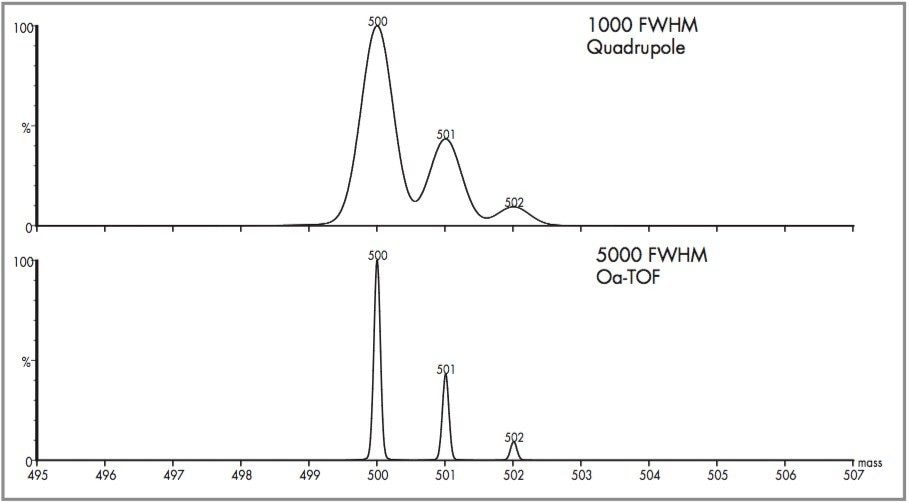
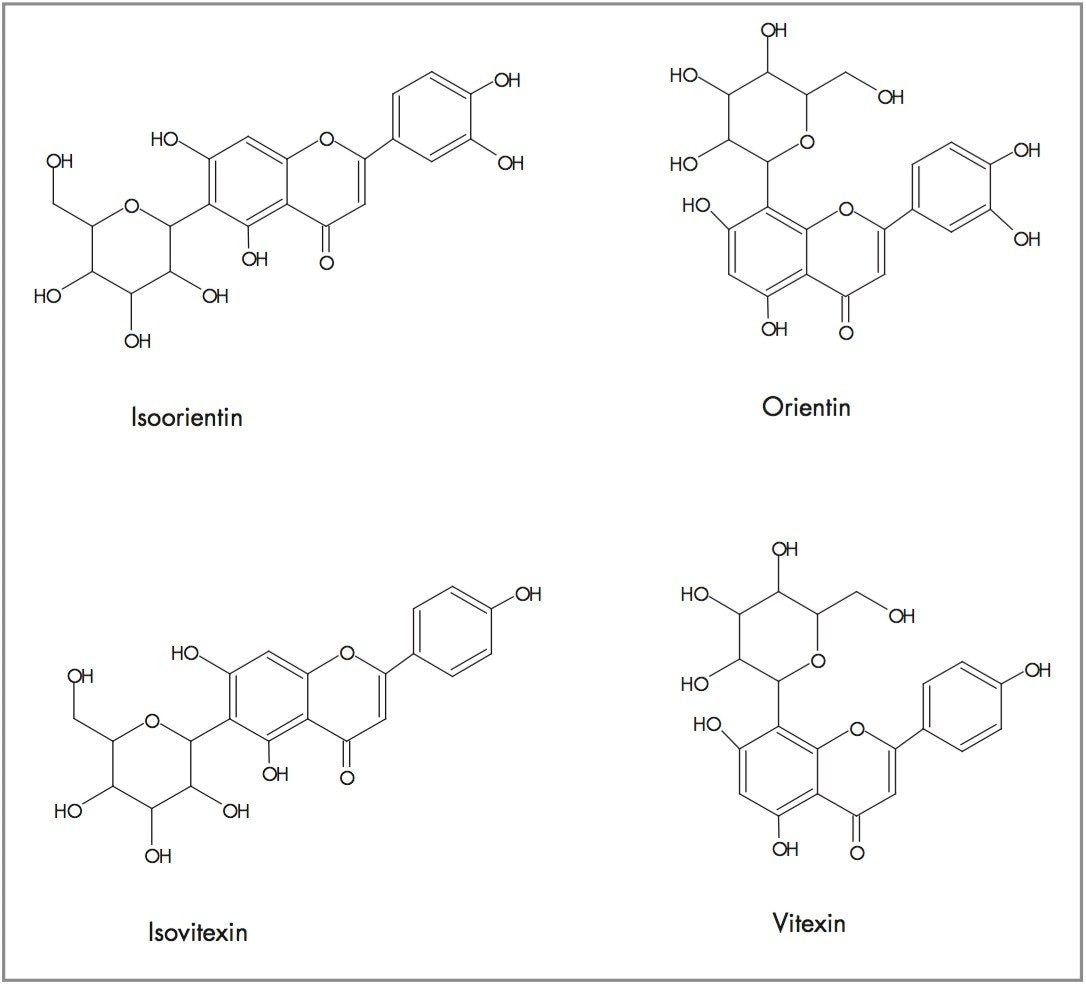
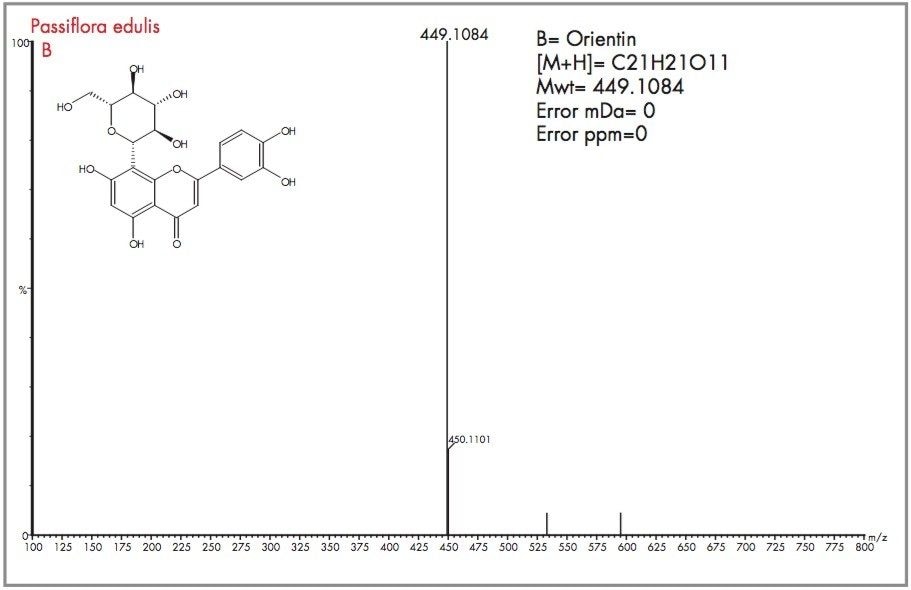
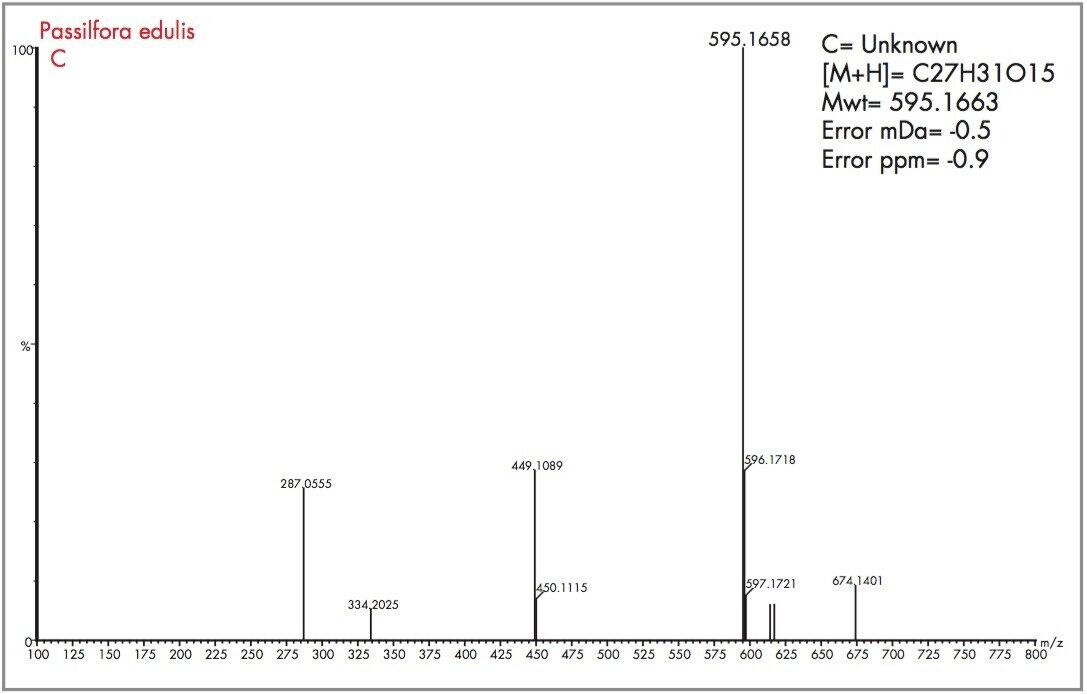
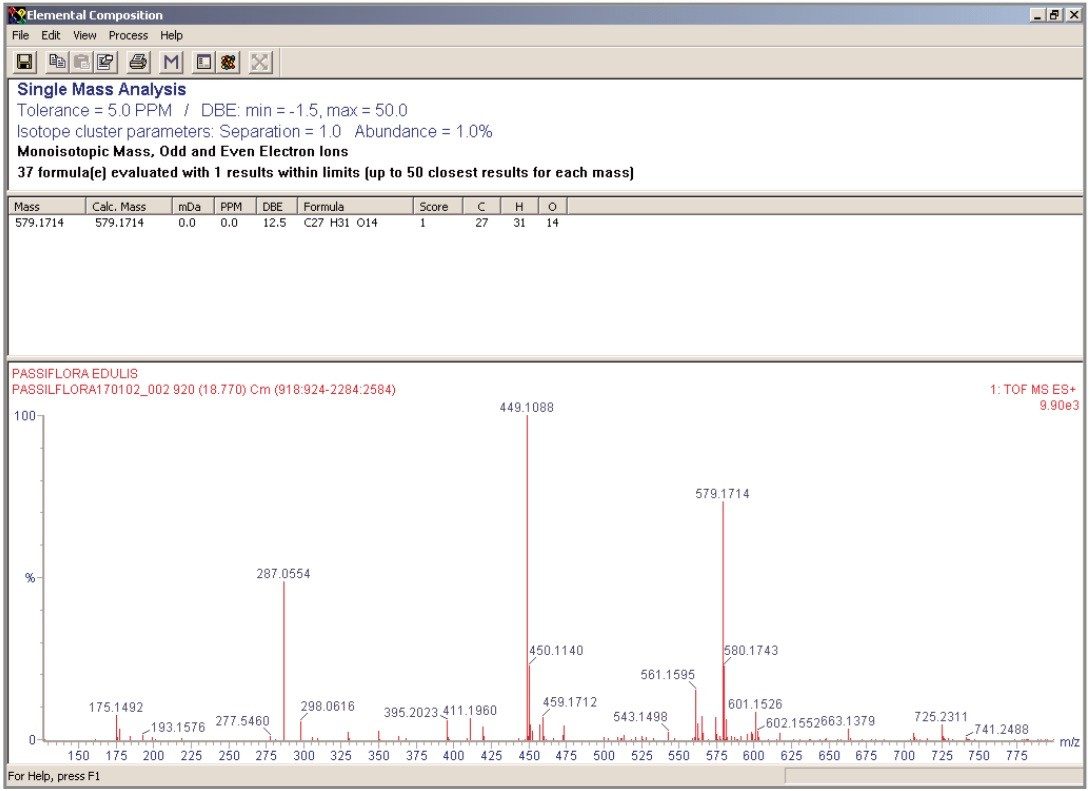
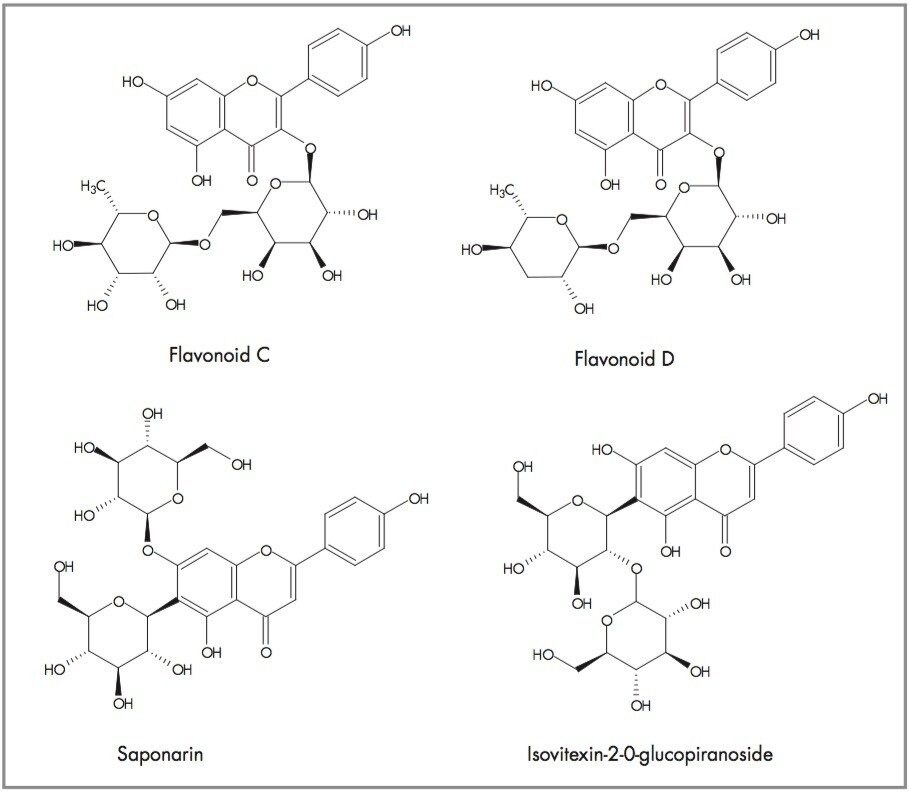
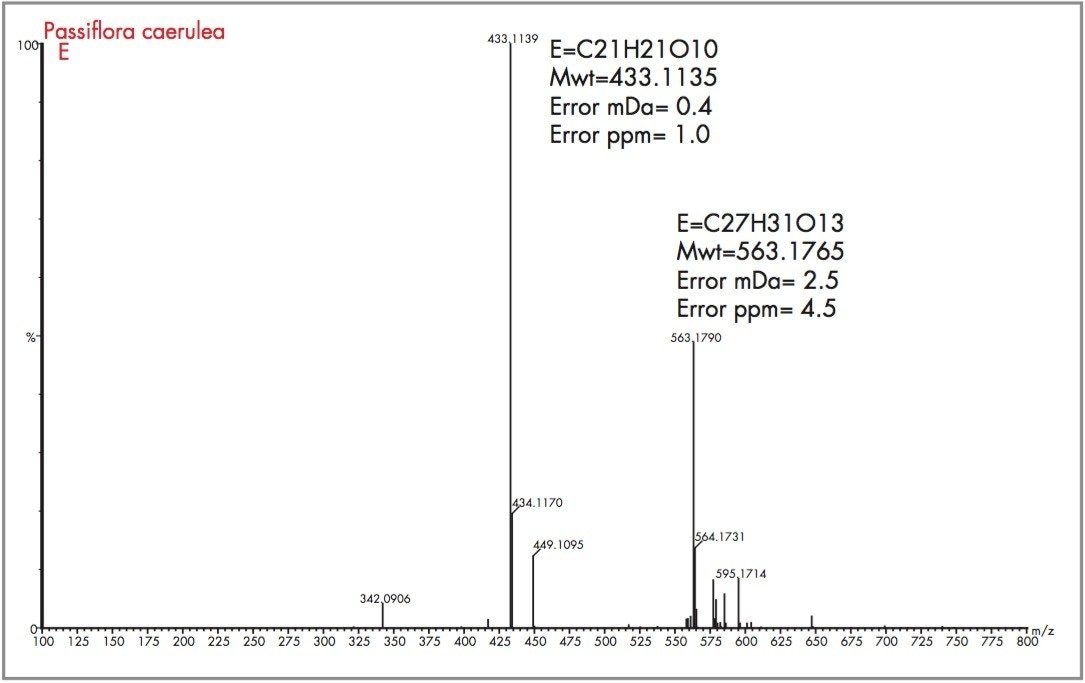
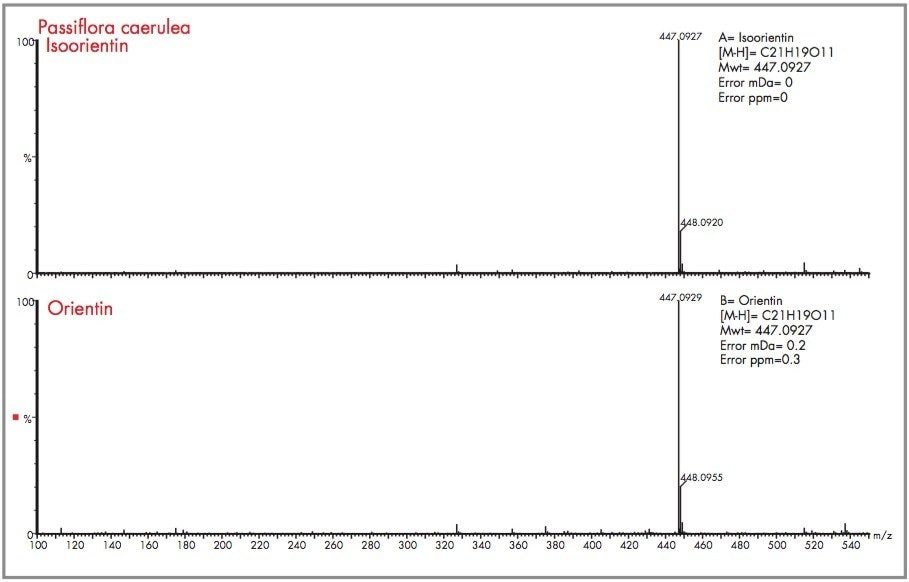
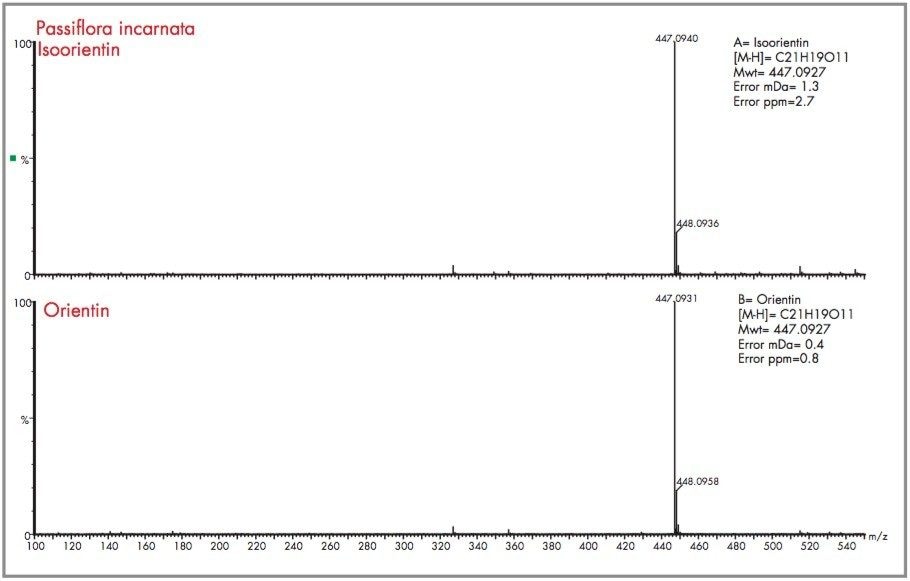
Medicinal Passiflora species contain flavonoids, mainly C-glycosylflavones (apigenin and luteolin derivatives; frequently occurring as isomers). LC-MS techniques combined with exact mass measurement are important tools for unequivocal identification of flavonoid isomers in complex mixtures such as phytomedicines. In this study oa-Tof LC-MS full spectra acquisition has been performed. Therefore it has been possible to distinguish and correctly assign the flavonoids of interest from degradation products due to the presence of other flavonoids, which also have the same luteolin-type or apigenin-type of skeletal structure.1,2,3
The issues relating to Kava Kava highlight the need to identify all components of a natural health product. Specific data is required, and the ability to detect minor components is essential since minor components may possess extremely potent toxic activity. In the case of Kava Kava the extraction method used may have resulted in high levels of Kavalactones being extracted, resulting in liver damage in the patients.
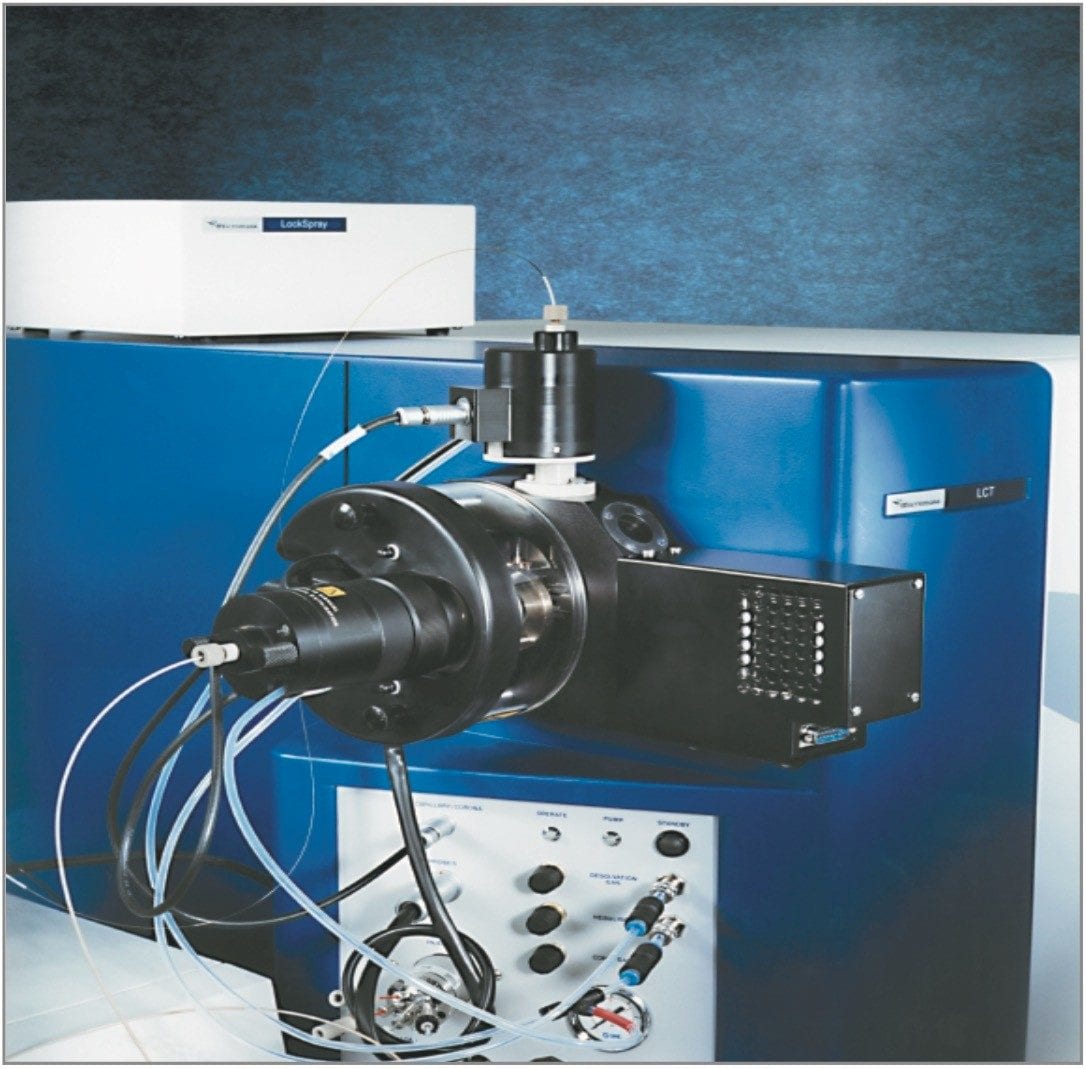
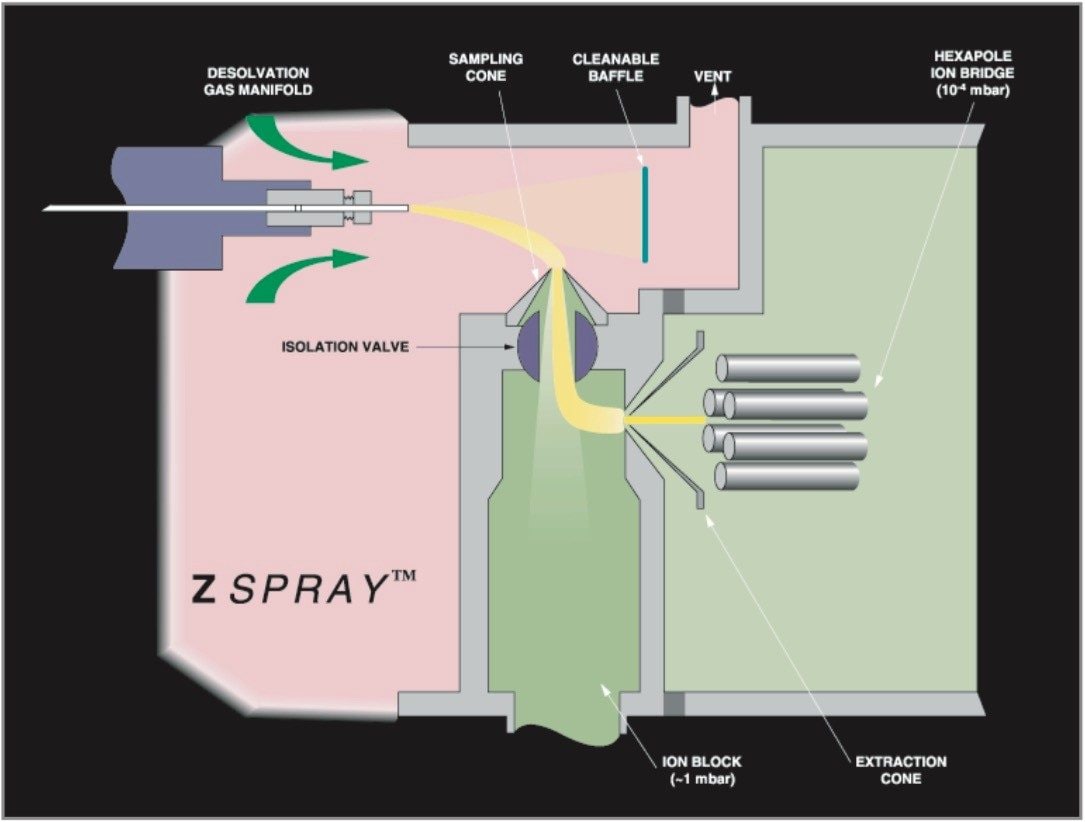
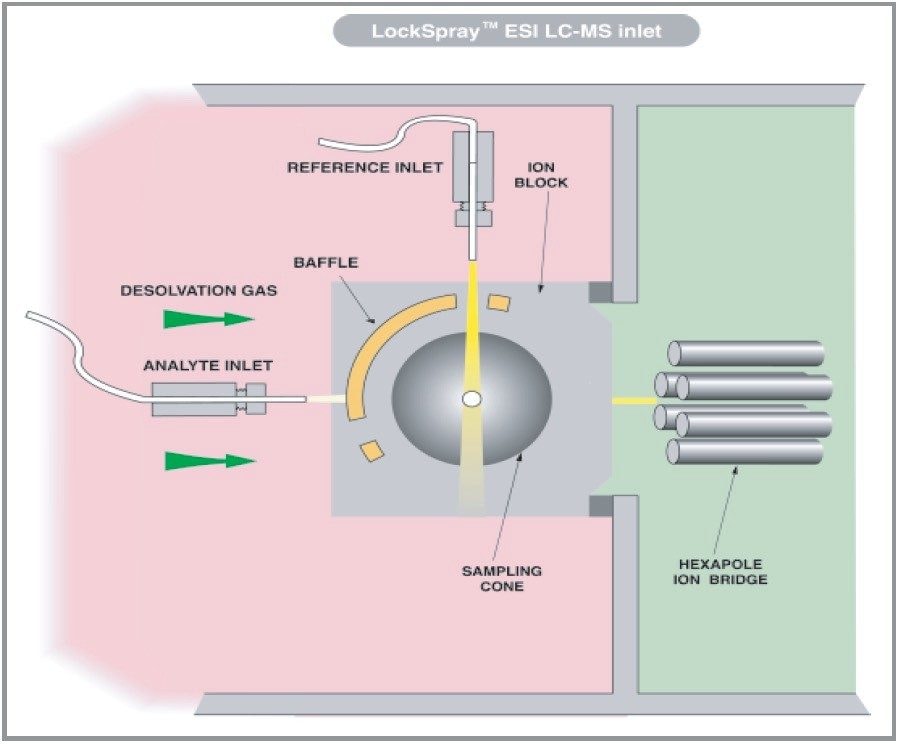
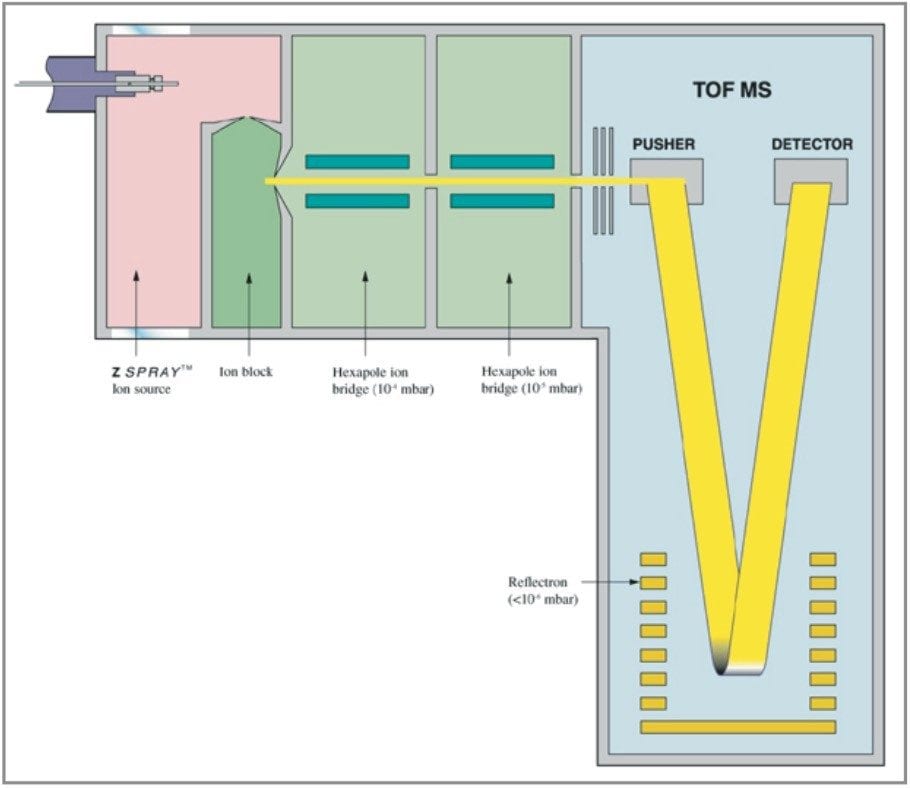
oa-Tof-MS combined with HPLC is a powerful analytical tool because of the acquisition speed, available mass range and ion collection efficiency. Within many laboratories the high duty cycle of Tof is utilized for qualitative studies, generating full spectra with high mass accuracy (<5 ppm) providing an extra degree of information that aids interpretation of the data. oa-Tof is used as a tool for easy acquisition of real time exact mass centroid data; a schematic of an oa-Tof is illustrated in Figure 5. In Figure 3 the LockSpray dual electrospray source is illustrated.
oa-Tof LC-MS instrumentation can be utilized to speed up discovery of new natural products and to play a role in addressing many of the issues of this market, where regulation is now being applied. The LCT incorporates ZSpray technology, giving increased sensitivity with the ruggedness and robustness required for routine analysis of plant extracts. Dual orthogonal sampling of the sample spray exiting the electrospray capillary takes place: the spray is directed towards the baffle plate where collection of involatiles from sample matrices or mobile phase additives takes place. Ions are extracted electrostatically through 90 degrees and they enter through the sample cone. The ions are further electrostatically bent through 90 degrees and enter through the sample extraction cone, where they enter the mass spectrometer. The majority of the involatile ions that actually enter the ion block are pumped away. Due to the source design the sample cone orifice can be made larger to allow more ions to enter the ion block, hence providing greater sensitivity. Dual orthogonal spray sampling provides greater source robustness and sensitivity, and is the exact requirement for dealing with real samples. This produces a perfect combination for natural product analysis.
The use of exact mass measurements, particularly for low molecular weight compounds, provides a greater confidence in compound confirmation through the ability to determine actual elemental compositions. With the introduction of LockSpray as a routine and rugged hardware configuration for the LCT, it is possible to provide a single reference peak against which any subsequently acquired mass spectra are accurately mass measured. Historically it was common working practice on magnetic sector and orthogonal-acceleration time of flight (oa-Tof) mass spectrometers to introduce a reference solution into the eluent stream prior to the ionization source, in order to allow exact mass measurement of LC peaks. The associated inherent problems of teeing in the reference compound can result in a variation in the signal intensity when LC gradients are applied; mass interference with analytes have the same nominal mass and suppression of the reference response with high concentration analyte response. In these instances mass measurement errors can occur.
The resolution that can be achieved using the LCT is compared with that of a quadrupole in Figure 4. The functionality that can be utilized to provide the "Fingerprint" of natural medicines is described as follows:
Standards: Vitexin, orientin, isoorientin and rutin
Passiflora Samples
Vegetal material: dried leaves of Passiflora alata and P. edulis (grown in Ribeirão Preto, SP, Brazil); P. incarnata, (supplied by CPQBA - Campinas - SP, Brazil) and P. caerulea (supplied by IAC - Campinas - SP, Brazil)
Sample Preparation: Extraction with ethanol-water (2:1 v/v, 1 g plant/10 mL solvent according to Brazilian Pharmacopoeia procedure) SPE clean-up (Sep-Pak C18, elution with 60% methanol - H2O) and LC-MS analysis of hydromethanolic fraction (4 mg/mL)
Column: |
Symmetry C18 (250 mm x 4.6 mm x 5 μm) with Guard Column (2 cm x 3.9 mm x 5 μm) |
Column temperature: |
35 °C |
Mobile phase: |
ACN (B) : H2O (0.2% HCOOH) (A) Gradient: 0–10 min: 15% B; 10–40 min: 15–30% B; 40–50 min: 30–15% B |
Flow: |
1 mL/min - split 1:4 |
Instrument: |
LC-Tof-MS, (Micromass) LCT equipped with LockSpray dual electrospray ion source |
Mode: |
ESI positive and negative |
ESI voltage: |
+VE = 3kV -VE = 2.9kV |
Sample cone voltage: |
20V |
Exact mass reference: |
Leucine enkephalin, [M+H]+ = 556.2771 [M-H]- = 554.2615 |
m/z range: |
100 to 800 m/z |
The flavonoids of interest for this study, isoorientin, orientin, vitexin, and isovitexin are shown in Figure 6. Orientin and vitexin are 8-C glycosides and respectively differ from 6-C glycosides isovitexin and isoorientin through the position of the attached glucose group as illustrated. Isovitexin and isoorientin differ with respect to the absence or presence of the hydroxy group shown. This also applies to vitexin and orientin. Orientin and isoorientin have the elemental composition C21H20O11, whereas vitexin and isovitexin have an elemental composition of C21H20O10.
As can be seen from Figure 7, analysis of the Passiflora edulis extract has resulted in a plethora of major and minor components being identified in one analysis. The resultant electrospray positive ion mode total ion chromatogram indicates the complexity of the natural product extracts being identified. The advantage of oa-Tof LC-MS is the ability to achieve full spectra acquisition for such a large number of components in one analysis. For each Passiflora species extract the determination of the presence of isoorientin and orientin was required. From extraction of the m/z 449 mass chromatogram Figure 8 was produced.
The target flavonoid mass for both orientin and isoorientin was m/z 449.1084, for the protonated molecular ion species with an elemental composition of C21H21O11. Ten major and minor peaks containing m/z 449 were detected. The four most abundant peaks are labelled A, B, C and D as shown in Figure 8 for the m/z 449 extracted mass chromatogram obtained for Passiflora edulis. In Figure 9 the exact mass and elemental composition generated for peak A of Figure 8 shows that for the elemental composition C21H21O11, the exact mass obtained was within 0.2 mDa (0.3 ppm). For peak B, mass measurement was obtained within 0 mDa (0 ppm) error as illustrated in Figure 10. Using the elemental composition calculator tool within MassLynx, the most probable elemental composition with a set of defined parameters can be determined. In both cases, the most probable elemental composition of the mass spectra generated for peaks A and B, was determined to be C21H21O11. From the exact mass measurements obtained it can be concluded that A and B are isoorientin and orientin.
The data produced from the elemental composition calculator is shown in Figure 11. Using the resultant exact mass spectrum for orientin, the exact mass data was entered into the elemental composition calculator. An elemental composition is generated and a probability score given, as well as the mass measurement error in mDa and ppm. The elemental composition calculator was used to generate the probable elemental formula of peaks C and D of Figure 8.
Acquiring full spectra allowed the flavonoid candidates C and D to be distinguished from isoorientin and orientin. The mass spectra obtained for peaks D and C, along with the generated elemental compositions and mass measurement errors, can be seen in Figures 12 and 13. The target mass of 449.1084 for orientin and isoorientin was determined within 0.5 mDa for flavonoid C and 0.4 mDa for flavonoid D. In the case of flavonoid C, an elemental composition C27H31O15 was determined to be most probable within -0.5 mDa (0.9 pm). For flavonoid D, C27H31O15 also had a probability score of 1, with mass measurement error of 0 mDa (0 ppm). Figure 14 shows the illustration of elemental composition calculator with mass measurement errors and determined elemental composition for flavonoid (D) found to be present in Passiflora edulis. From the mass spectra acquired for flavonoids C and D, a distinctive fragmentation pattern was observed, possibly caused by thermal degradation or the cone voltage applied. The fragmentation pattern observed was reported by Stoibecki4, for the flavonoid Kaempferol-3-rutinoside.
Other potential flavonoids, previously determined to be present within Passiflora species, are isovitexin-2-0-ß-glucopiranoside and saponarin, both of which have an elemental composition of C27H30O15. Loss of a glucose molecule would result in a mass of 433.1135 (C21H21O10) being observed for both molecules, but this is not the case. However, the fragments observed result from successive losses from a glucose moiety of a disaccharide, i.e. initially m/z 146 and then m/z 163, to produce fragments at m/z 449 and m/z 286 respectively. The same fragmentation pattern observed for flavonoid D also suggests the successive loss from glucose moieties, but in this case the initial loss being from a deoxyhexose group. The proposed structures of flavonoids C and D are illustrated in Figure 15.
From Figure 16 the m/z 433 extracted mass chromatogram is illustrated in order to identify the presence of the 6-C glycoside isovitexin and 8-C glycoside vitexin. The exact mass of the protonated molecular ion species is 433.1135 (C11H21O10). Isolating the m/z 433 extracted mass chromatogram has resulted in at least fourteen clearly definable major and minor components being identified at a nominal mass of m/z 433.
If both vitexin and isovitexin are present in Passiflora caerulea they could be present as either major or minor components. Any of the peaks identified could be one of the target flavonoids. The exact mass spectra were generated for the five major peaks identified as A, B, C, D and E within Figure 16. These are illustrated respectively in Figure 17 to Figure 21.
Peak A could be considered as vitexin or isovitexin, the mass spectrum generated has resulted in a mass of 433.1135 being identified, corresponding to an elemental composition of C21H21O10, which has zero error from the target mass. However from the mass spectrum it can be seen that actual parent ion is m/z 579.1728, for which an elemental composition of C27H31O14 was produced. The evidence of m/z 433.1135 indicates a loss of m/z 146 resulting from a glucose moiety of a disaccharide group. Vitexin-2-O-rhamnoside and Vitexin-4-O-rhamnoside (C27H30O14) are potential candidates. In Figure 18 the exact mass measurement obtained was m/z 433.1134, only 0.2 ppm from the target mass. Shown in Figure 19, the exact mass spectrum has an error of 0.5 ppm. The exact mass spectrum presented for peak D in Figure 20 once again illustrates a potential candidate, through the presence of the ion m/z 433.1152 being found. Also present are ions at m/z 449.1107 and m/z 577.1517, indicating that the base peak of the mass spectrum is a degradation product of another flavonoid through the loss of an attached saccharide group. Peak E also has ions present at m/z 449.1095, m/z 563.1765 and m/z 595.1714 resulting from saccharide group presence and loss, indicating the true identity is not vitexin or isovitexin. Using single ion monitoring or a short mass range, on a quadrupole instrument would have resulted in many potential candidates to be vitexin or isovitexin. Using exact mass measurement with full spectra acquisition has allowed rapid identification of peaks B and C to be the target flavonoids isovitexin and vitexin.
A comparative analysis was performed using negative ion mode electrospray ionization. The negative mode total ion chromatogram obtained for the analysis performed of the Passiflora caerulea extract is presented in Figure 22, along with the m/z 447 extracted mass chromatogram showing the presence of isoorientin (peak A) and orientin (peak B). The respective mass spectra obtained are illustrated in Figure 23, with the elemental compositions generated and the mass measurement errors obtained. For isoorientin a mass measurement of 447.0927 resulted, where the error obtained was 0 mDa (0 ppm). The most probable elemental composition for the criteria set was C21H19O11. For orientin the mass measurement error obtained was 0.1 mDa (0 ppm), where C21H19O11 was generated as the first elemental composition choice.
A further example of the exact mass data acquired in negative ion mode is shown for the Passiflora incarnata extract shown in Figure 24, where the total ion chromatogram and m/z 447 extracted mass chromatogram are presented. The m/z 449 extracted mass chromatogram profiles of Passiflora incarnata and caerulea are different, and can be used as a means of distinguishing the two species. In the case of Passiflora incarnata, isoorientin and orientin mass measurement errors determined for the number one elemental composition choice were 1.3 mDa (2.7 ppm) and 0.4 mDa (0.8 ppm).
Using oa-Tof LC-MS exact mass measurement allowed for highly specific data to be acquired. Full spectra acquisition and exact mass measurement was performed on more than eighty major and minor components found in some extracts of Passiflora in one analysis. The increased selectivity of exact mass measurement allowed for full confidence in flavonoid isomer assignment. Using the elemental composition calculator the most probable elemental formula was derived from the exact mass spectrum, this further confirmed the identity of the flavonoid isomers of interest. The combination of exact mass and full spectra acquisition allowed for unequivocal identification of the target flavonoids isoorientin, orientin, vitexin and isovitexin. Acquiring full mass spectra data fragment ion spectra also allowed isobaric degradation products of other flavonoids to be distinguished from isoorientin, orientin, vitexin and isovitexin.
The authors wish to thank Dr. Ana Maria Soares Pereira (UNAERP), Prof. Cozimo Pizza (Salerno University) and Dr. Laura Meletti (IAC) for providing plant material.
The authors wish to thank FAPESP and CNPq for financial support and fellowships.
720000978, December 2004