
Efficient Method Development for Charged Aerosol Detection of Non-chromophoric Ursodeoxycholic Acid and Related Substances
Margaret Maziarz, Stephanie Harden, Robert Birdsall, Paul Rainville
Waters Corporation, United States
Published on October 28, 2026

Abstract
Reliable impurity profiling is essential for ensuring the quality, safety, and consistency of pharmaceutical products. Ursodeoxycholic acid (UDCA) and its related substances present a challenging analysis because these structurally similar compounds lack strong UV chromophores. An ultra-high-performance liquid chromatography (UHPLC) method was developed for the simultaneous separation and analysis of UDCA and nine related substances, designated impurities A–I. Method development followed a two-stage workflow. First, volatile mobile phases were used with complementary PDA Detector, Waters Charged Aerosol Detector (CAD), and ACQUITY™ QDa™ II Mass Detector data to evaluate the separation: PDA Detector confirmed the absence of useful UV response, CAD provided broad detection of the non-chromophoric analytes, and mass detection supported peak identification. After separation conditions and peak identities were established, the workflow focused on CAD as the primary detector for quantitative method optimization. Key CAD parameters, including evaporator temperature, sampling rate, filter time constant, ion trap voltage, and power function value (PFV), were systematically optimized. The final CAD method, run on an ACQUITY Premier BEH™ C18 Column, separated UDCA and impurities A–I within a 10-minute gradient while improving detector response, performance, and linearity. This workflow provides an efficient approach for developing CAD methods for non-chromophoric pharmaceutical impurities and supports robust and compliance-ready analysis using Empower™ Software.
Benefits
- Streamlined method development workflow using CAD for analysis of non-chromophoric, non-volatile, and semi-volatile pharmaceutical related substances and impurities
- Improved separation, sensitivity, and quantitative performance through systematic optimization of chromatographic conditions and CAD operating parameters
- Integration with Empower Software delivers a compliance-ready solution with secure audit trails to support regulated laboratory workflows for data acquisitions, processing, and reporting
Introduction
UDCA is used for the treatment of cholestatic liver diseases and dissolve cholestatic gallstone.1 Recent studies suggested that UDCA has potential to prevent SARS-CoV-2 infection that causes coronavirus disease (COVID-19).2 As an established active pharmaceutical ingredient (API) in prescription medication, UDCA requires reliable analytical methods to monitor assay, purity, and related substances throughout development, manufacturing, and quality control.
The European Pharmacopoeia lists nine potential related substances for UDCA, designated impurities A–I. These compounds include structural isomers and cholic acid analogues that lack chromophores. The procedure outlined in the European Pharmacopoeia is not designed to quantify all impurities simultaneously. Impurity C is analyzed by thin-layer chromatography (TLC), while impurities A and H are analyzed by LC with refractive index detection. Other approaches reported for UDCA impurity analysis include HPLC with electrochemical, refractive index, evaporative light scattering, fluorescence, or charged aerosol detection, as well as derivatization-based and thin-layer chromatographic methods.1,3 However, many of these methods are limited by inadequate sensitivity, complex sample preparation, lack of broad impurity coverage, or limited mobile phase compatibility.
CAD offers a practical approach for detecting non-volatile and semi-volatile compounds that lack strong chromophores. When paired with volatile mobile phases, CAD can be integrated into methods that are also compatible with mass detection, enabling both quantitative response and additional peak-identification support. In this application note, a UHPLC-CAD method was developed for the simultaneous separation and analysis of UDCA and nine related substances.
Experimental
UDCA and related substances (impurities A-I) were purchased from LGC standards (Vaughan, Ontario). LC/MS grade acetonitrile, formic acid, and ammonium formate were purchased from Sigma-Aldrich (Milwaukee, USA). De-ionized water (>18.2 MΩ) was purified using a Milli-Q™ Purification System.
Standard Solutions
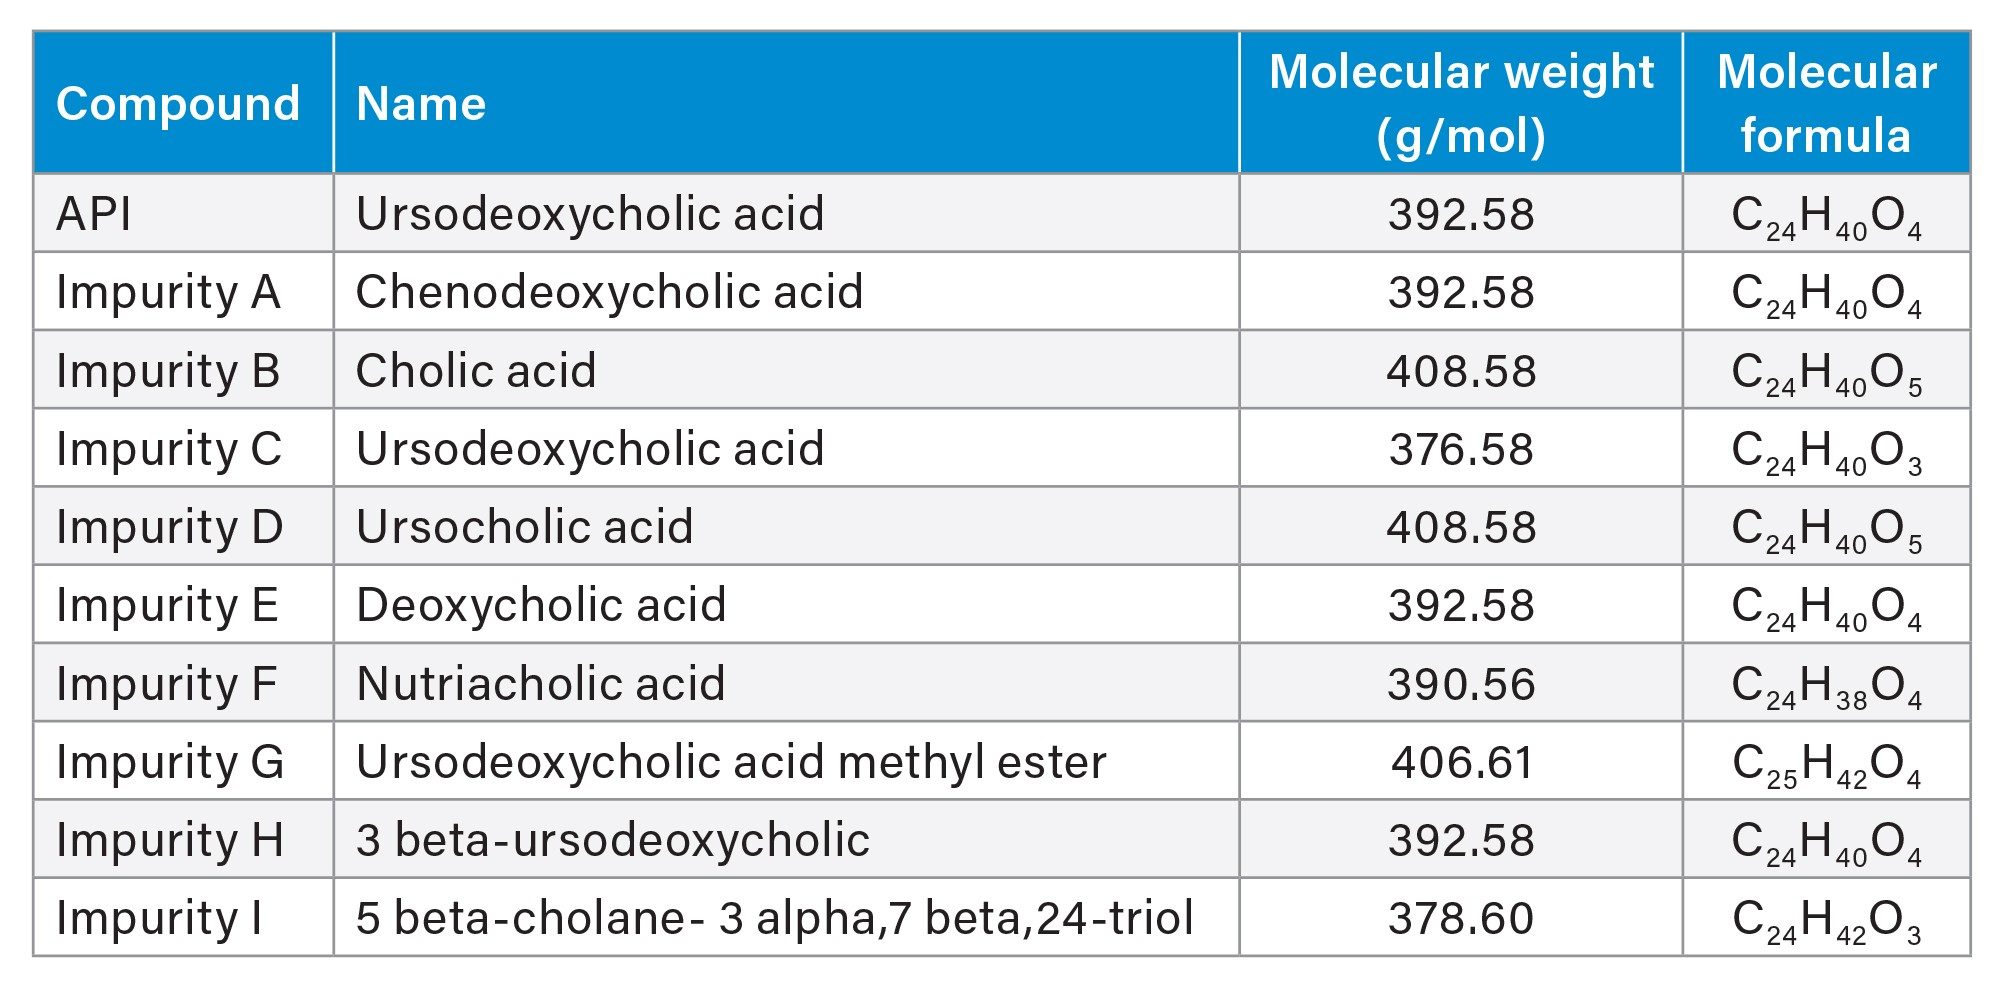
UDCA stock solution was prepared at 2 mg/mL in methanol. Individual stock solutions of related substances (Table 1) were prepared at 1 mg/mL in methanol. The stock solutions were diluted with mixture of water/acetonitrile (75:25, v/v) to prepare solutions for method development (100 µg/mL UDCA and 20 µg/mL impurities) and linearity assessment (0.05–50 µg/mL). All solutions were stored at 4 °C.
Method Conditions
Method development conditions are detailed in the Results and Discussion section.
LC Conditions
|
LC system: |
ACQUITY Premier System with Quaternary Solvent Manager (QSM), Column Manager |
|
Detection: |
PDA Detector, ACQUITY QDa II Mass Detector, and Waters CAD |
|
Vials: |
LCMS Maximum Recovery Vial, 2 mL volume (Waters, p/n: 600000670CV) |
|
Column(s): |
ACQUITY Premier BEH C18 Column, 2.1 x 100 mm, 1.7 µm (p/n: 186009453) |
|
Column temperature: |
25 °C |
|
Sample temperature: |
10 °C |
|
Injection volume: |
5.0 µL |
|
Flow rate: |
0.400 mL/min |
|
Mobile phase: |
Solvent A: 0.05% formic acid in water Solvent B: 0.05% formic acid in acetonitrile |
|
Wash solvents: |
Purge/Sample Wash: 50:50 water/acetonitrile Seal Wash: 90:10 water/acetonitrile |
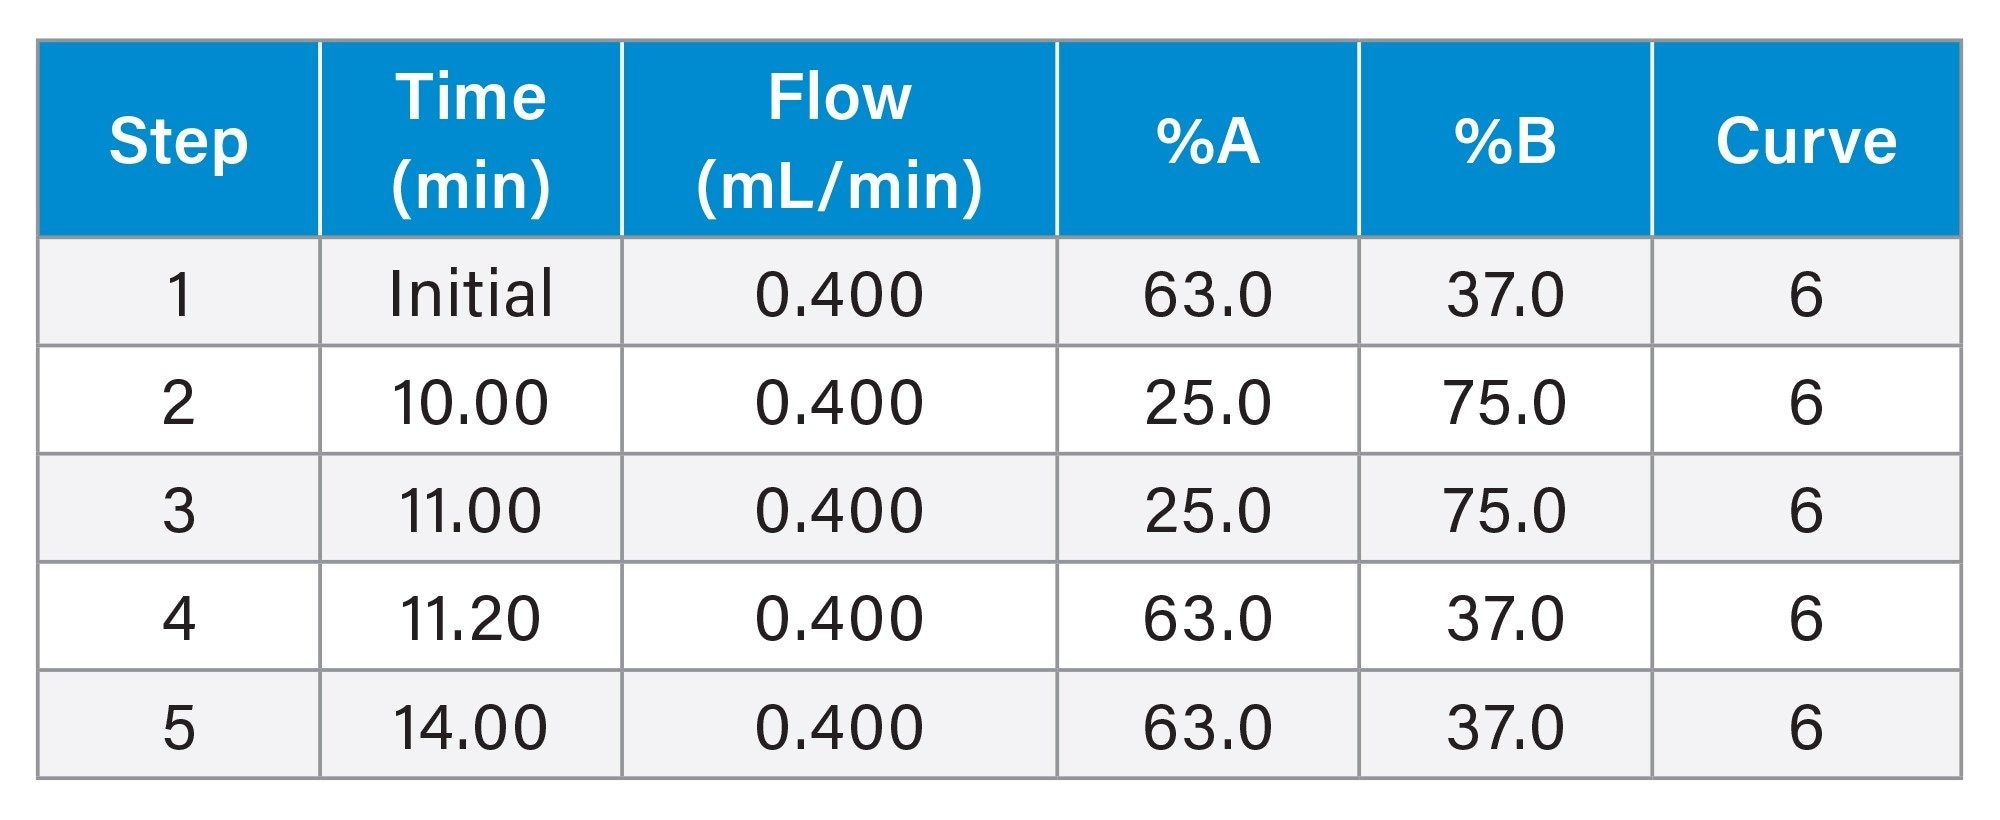
Gradient Table
CAD Detector Settings
|
PFV: |
1.10 |
|
Sampling rate: |
10 pts/sec |
|
Filter time constant: |
1.4 seconds |
|
Evaporator temperature: |
50 °C |
|
Ion trap voltage: |
80 V |
Data analysis: Empower CDS 3.6.0 was used for data acquisition, processing, and reporting.
Results and Discussion
CAD detects analytes by measuring the charge generated from dried aerosol particles after nebulization and mobile phase evaporation. Because detector response and baseline performance are strongly influenced by both chromatographic conditions and CAD settings, method development was performed in two stages. First, separation conditions were developed using volatile, CAD-compatible mobile phases to achieve adequate retention and resolution of UDCA and its related substances. Second, key CAD parameters were optimized to enhance signal response, reduce baseline noise, and improve quantitative performance. This workflow enabled efficient development of a robust LC-CAD method for non-chromophoric UDCA and related substances.
Development of Separation Conditions
CAD performance is highly dependent on mobile phase composition because non-volatile components and solvent impurities can increase background signal, elevate baseline noise, and reduce sensitivity. To minimize these effects, method development was performed using volatile, CAD-compatible additives and high-purity LC-MS grade solvents. Once suitable mobile phase conditions were established, reversed-phase column chemistries and organic solvent composition were screened to identify conditions that provided adequate retention, selectivity, resolution, and peak shape for UDCA and its related substances.
To evaluate selectivity for UDCA and its related impurities, a set of reversed-phase column chemistries was screened using both acetonitrile- and methanol-based mobile phases.
The columns evaluated were selected to provide complementary reversed-phase retention and selectivity:
- ACQUITY Premier CSH™ C18 Column, 2.1 x 50 mm, 1.7 µm (p/n: 186009460)
- ACQUITY Premier CSH Phenyl-Hexyl Column, 2.1 x 50 mm, 1.7 µm (p/n: 186009474)
- ACQUITY Premier BEH C18 Column, 2.1 x 50 mm, 1.7 µm (p/n: 186009452)
- ACQUITY Premier HSS PFP Column, 2.1 x 50 mm, 1.8 µm (p/n: 186010036)
Mobile phase setup:
- Solvent A: 200 mM Ammonium formate
- Solvent B: 2% Formic acid
- Solvent C: Water
- Solvent D: Acetonitrile
- Solvent D1: Methanol
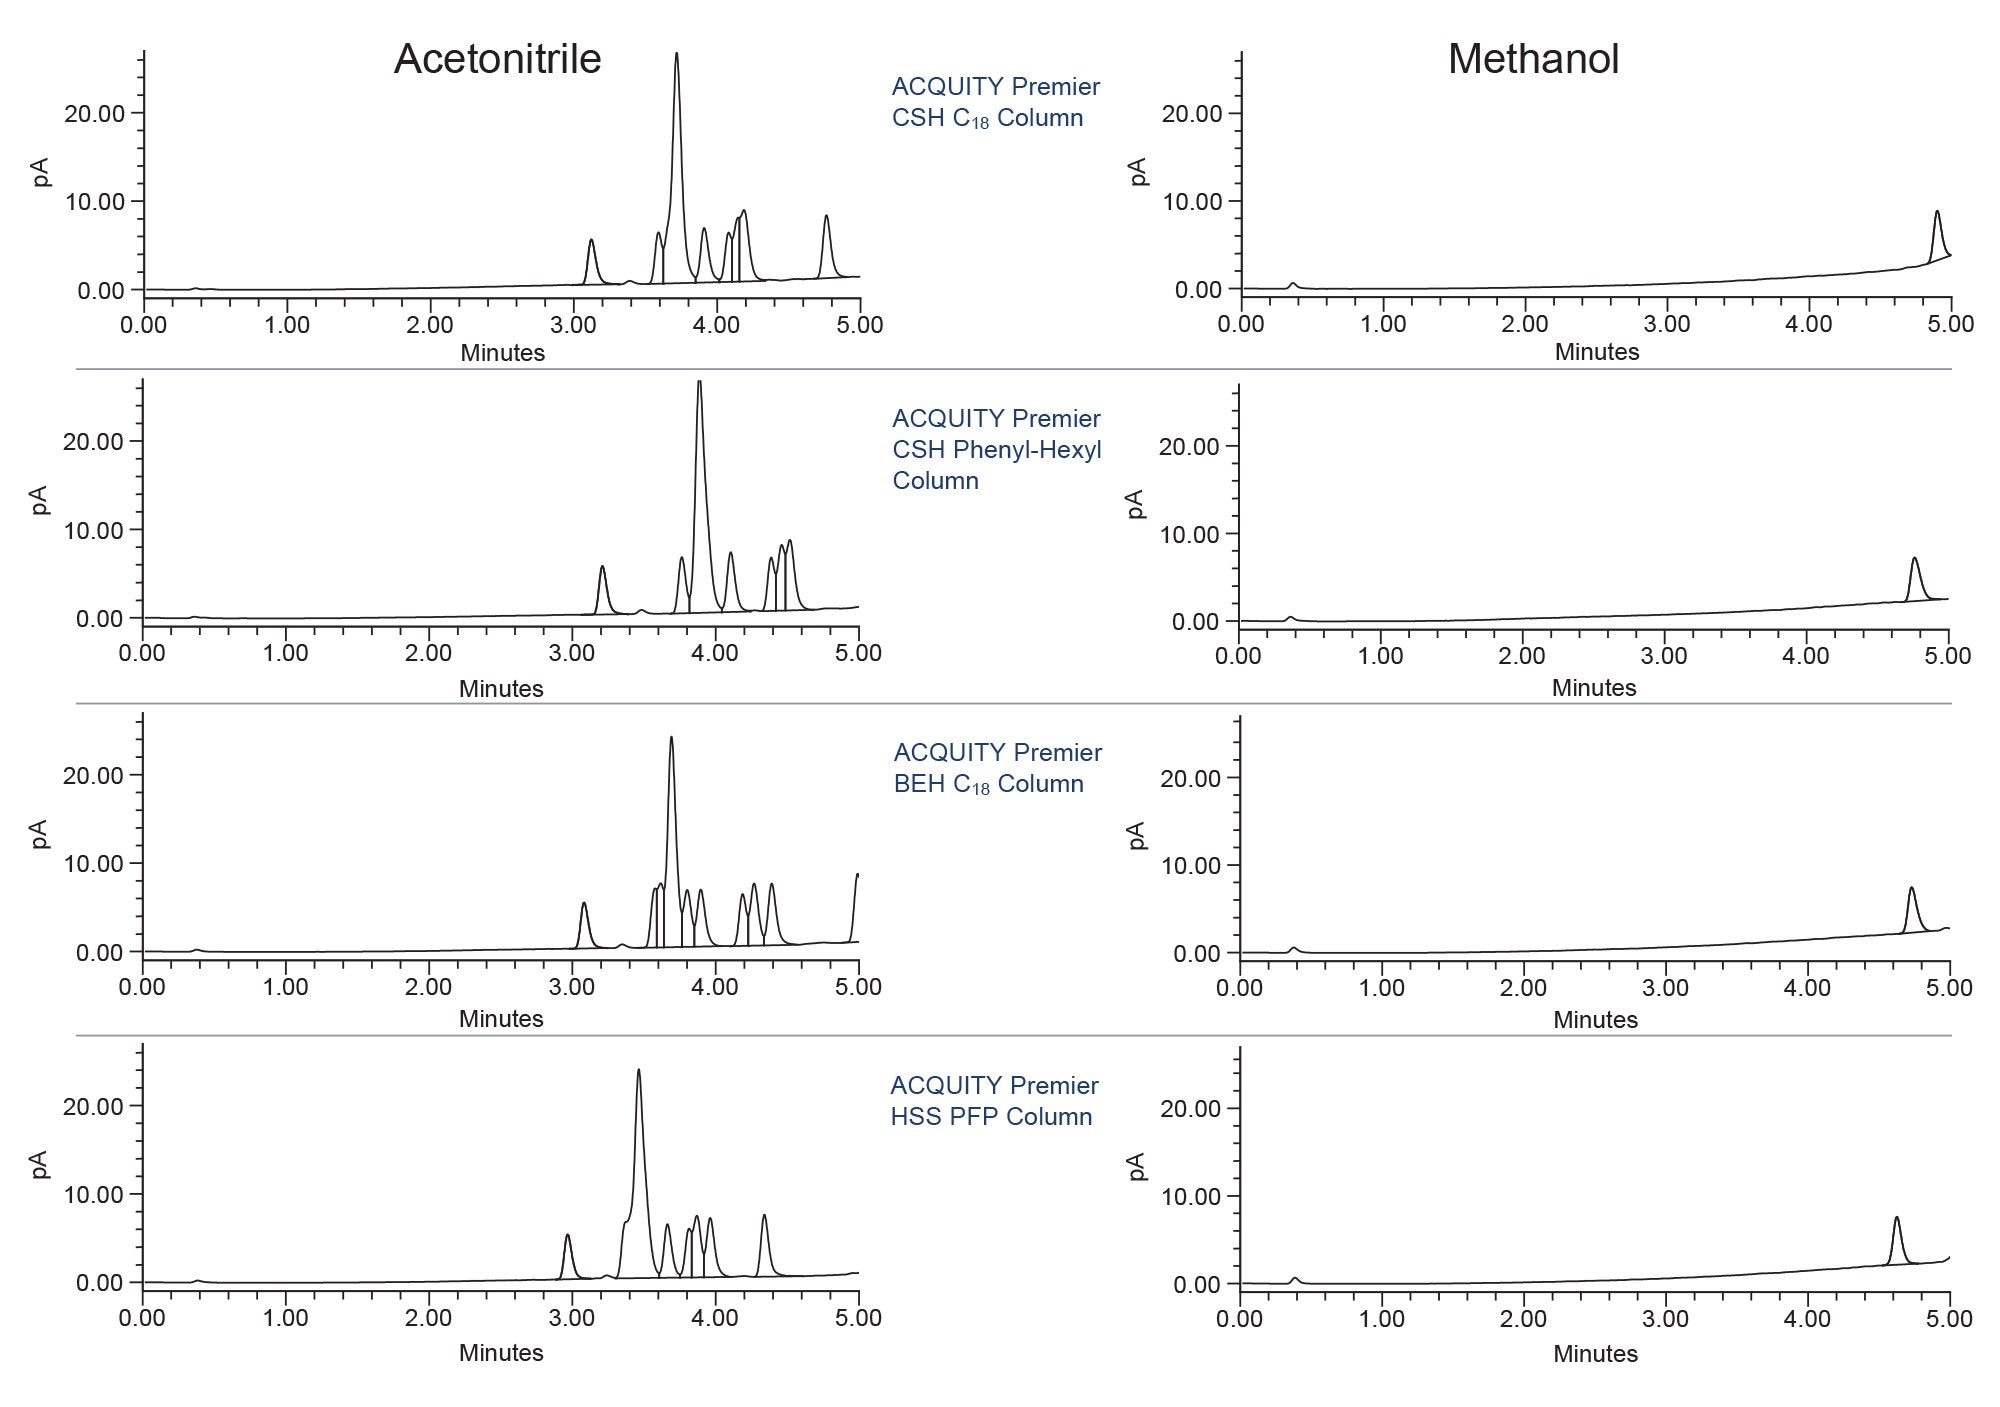
Column and solvent screening experiments were performed using a generic 5-minute gradient from 5% to 90% organic solvent with 10 mM ammonium formate and 0.1% formic acid at 0.50 mL/min. Column temperature was maintained at 30 °C. Based on the screening results (Figure 1), the ACQUITY Premier BEH C18 Column with acetonitrile solvent was selected for further development. Subsequent optimization focused on mobile phase additive concentration, gradient slope and duration, column temperature, and flow rate to improve resolution and peak shape.
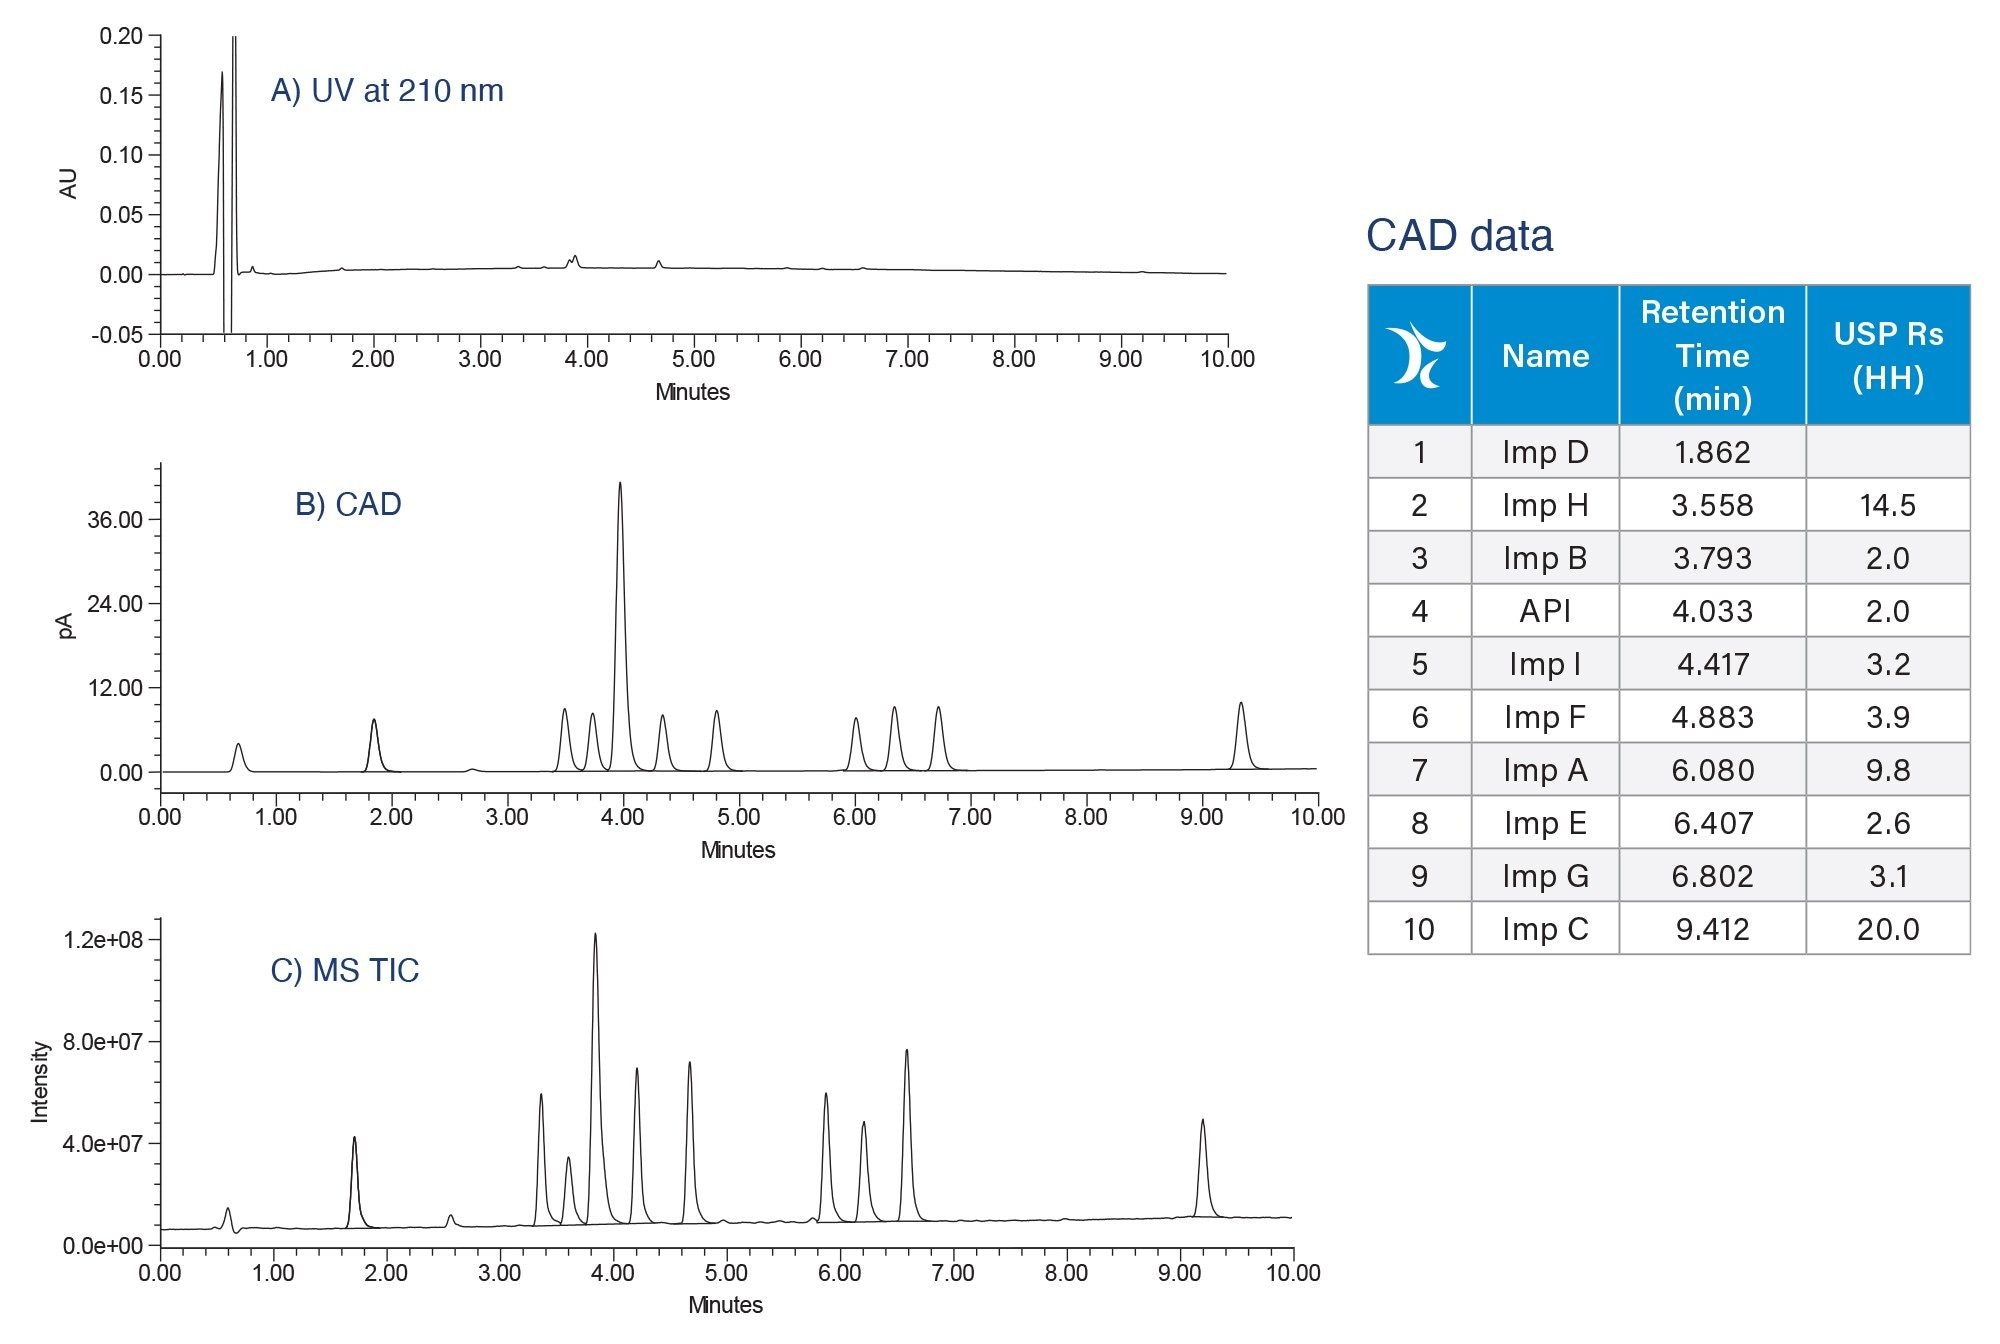
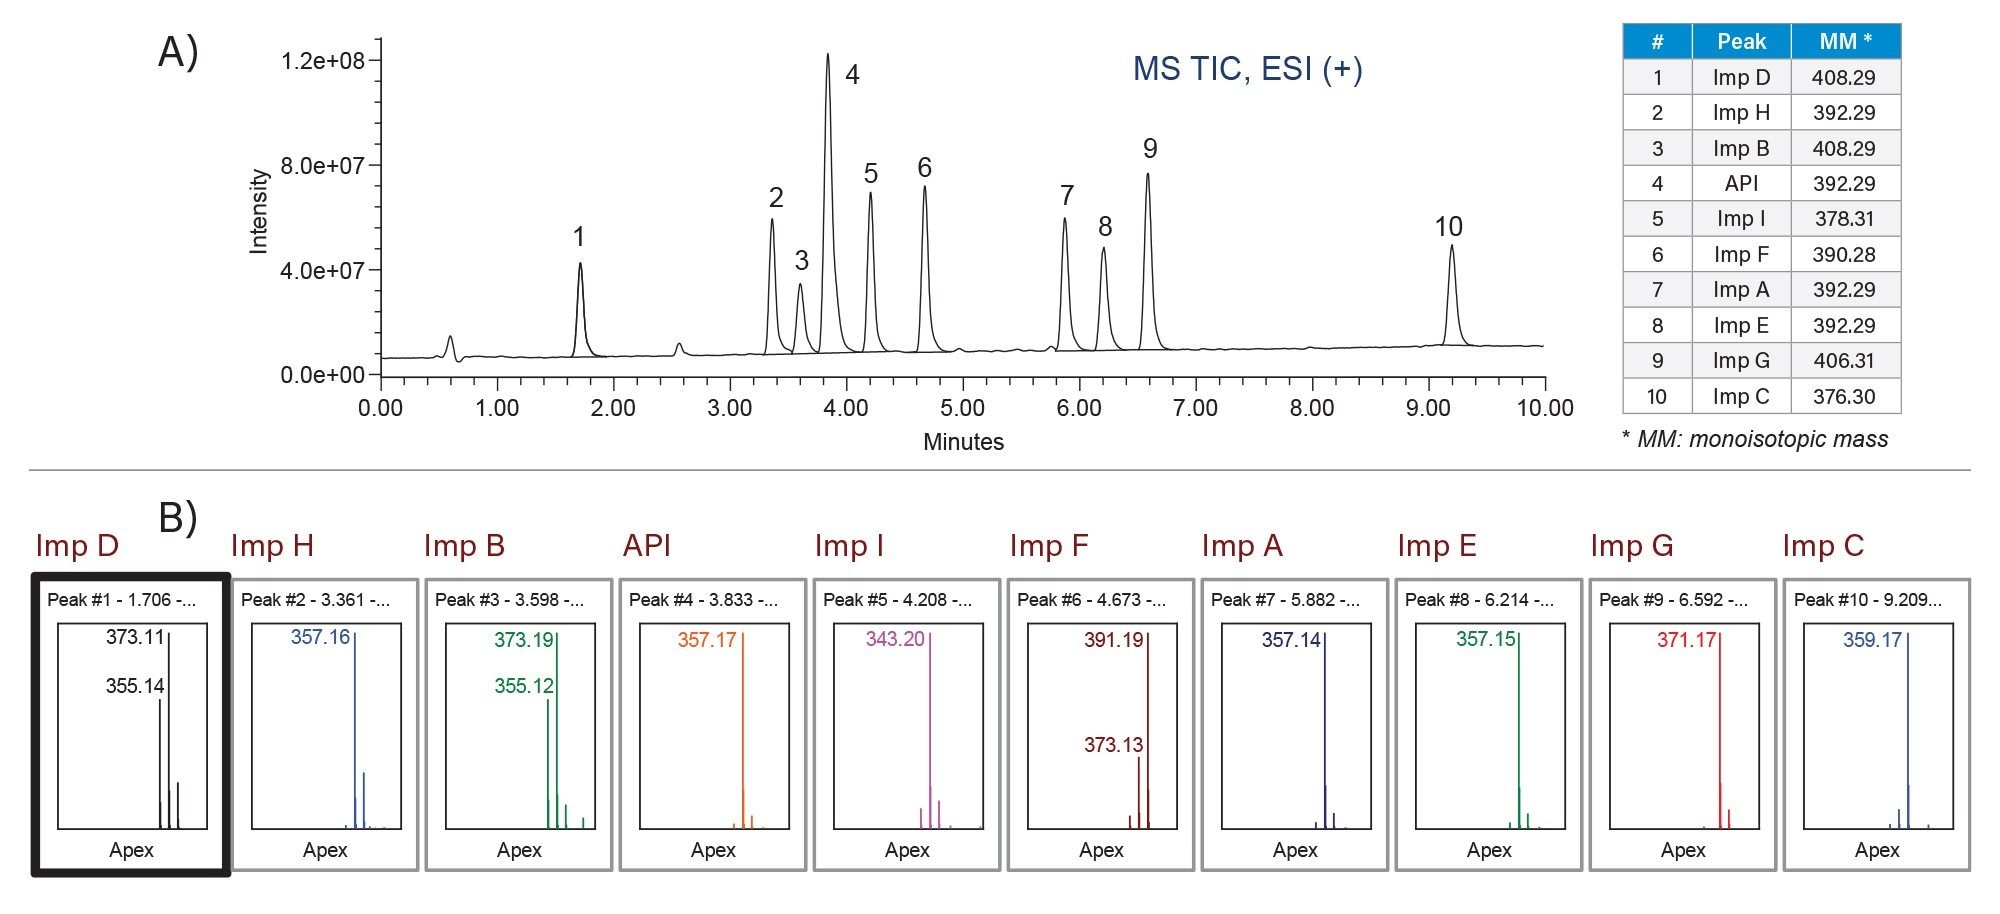
The optimized method used a 100 mm ACQUITY Premier BEH C18 Column, 2.1 mm internal diameter, 1.7 µm, operated at 25 °C. The mobile phases were optimized to contain 0.05% formic acid in water and in acetonitrile. The multi-detector configuration provided complementary information during method evaluation: PDA Detector confirmed no UV response for UDCA and its related substances, CAD provided the primary detection response, and the ACQUITY QDa II Mass Detector supported peak identification, (Figure 2). The optimized gradient separated UDCA and impurities A–I within 10 minutes, with a minimum USP resolution of 2.0 (Figure 2B). The mass spectral data showed adduct ion formation through the loss of one water molecule ([M - H2O + H]+) and two water molecules ([M - 2H2O + H] ), under positive electrospray ionization (ESI+), as illustrated in Figure 3. Because several related substances are structural isomers, mass information alone was not sufficient to identify each peak. Individual standards were injected to confirm peak identity and establish the elution order.
CAD Optimization
After the chromatographic separation was established, CAD parameters were optimized to maximize detector response and improve performance. The evaluation focused on settings that directly influence aerosol evaporation, data acquisition, signal smoothing, ion removal, and response linearity:
- Evaporator temperature
- Sampling rate
- Filter time constant
- Ion trap voltage
- PFV
Because CAD was being used as the primary technique for quantification, the detector was directly connected to the ACQUITY Premier System. This configuration enabled targeted optimization of CAD parameters for detection and quantification of UDCA and related substances.
CAD Evaporator Temperature
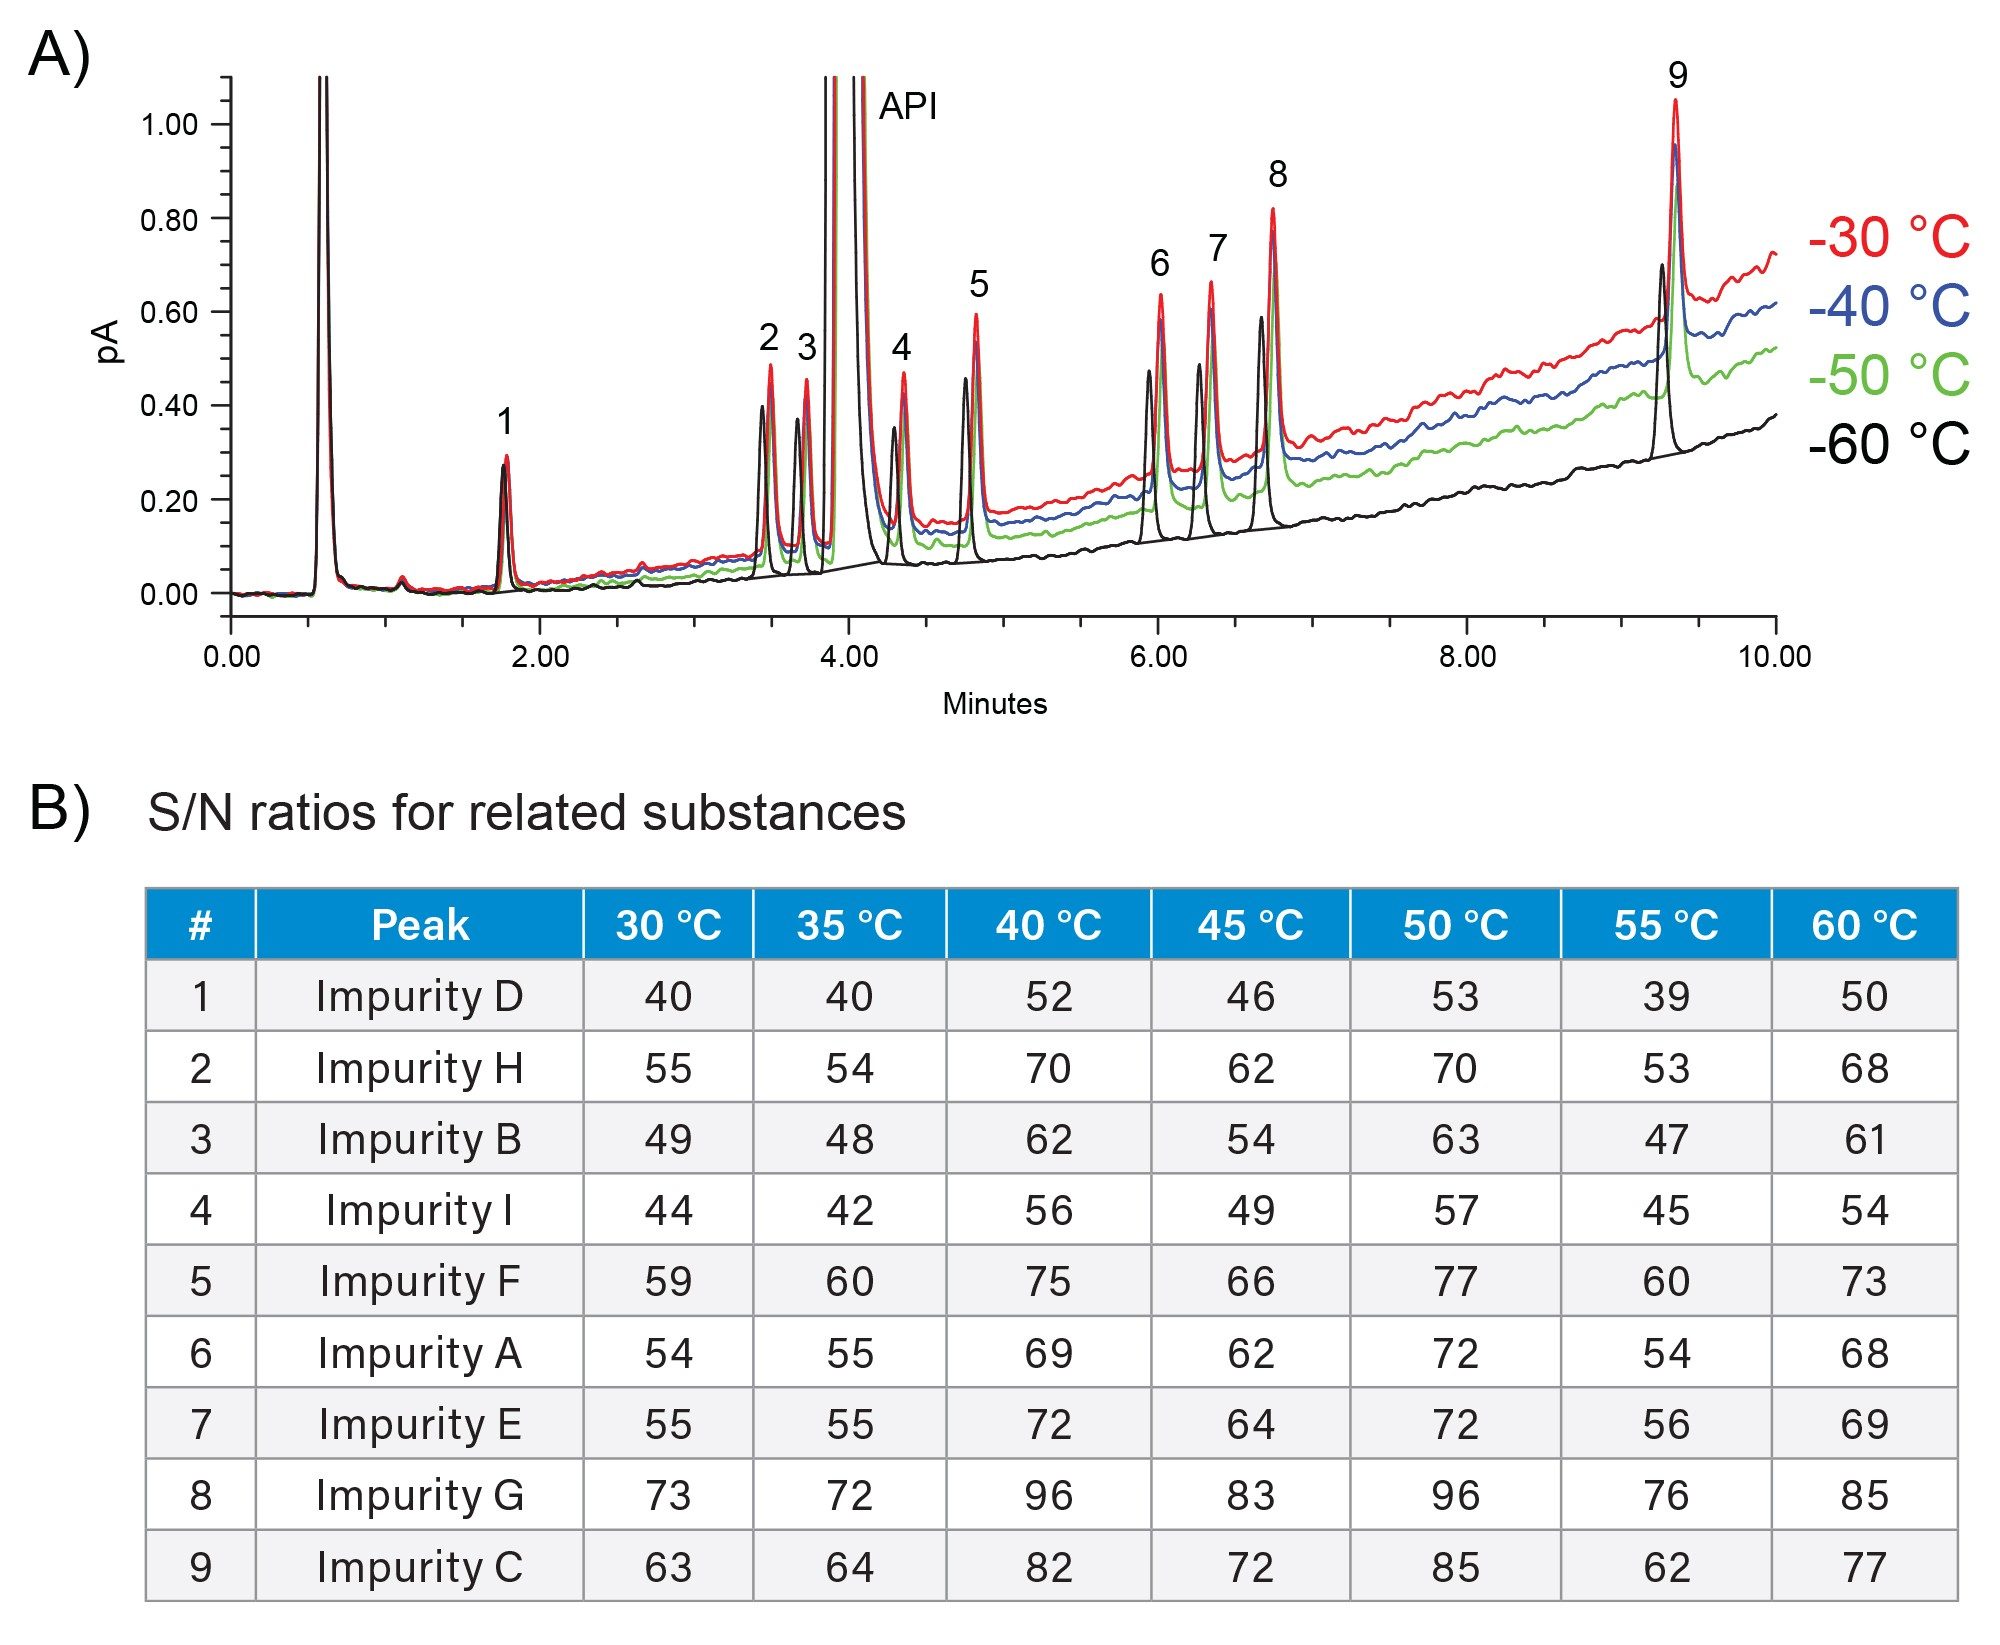
Evaporator temperature affects mobile phase removal before analyte particles are charged and detected. Higher temperatures can improve solvent evaporation and reduce baseline noise, but excessive temperature may lower response for semi-volatile analytes. In this study, the evaporator temperature was optimized by comparing signal-to-noise (S/N) ratio and baseline noise across the evaluated conditions. The temperature of 50 °C provided the best balance between analyte response and reduced baseline noise (Figure 4).
Sampling Rate
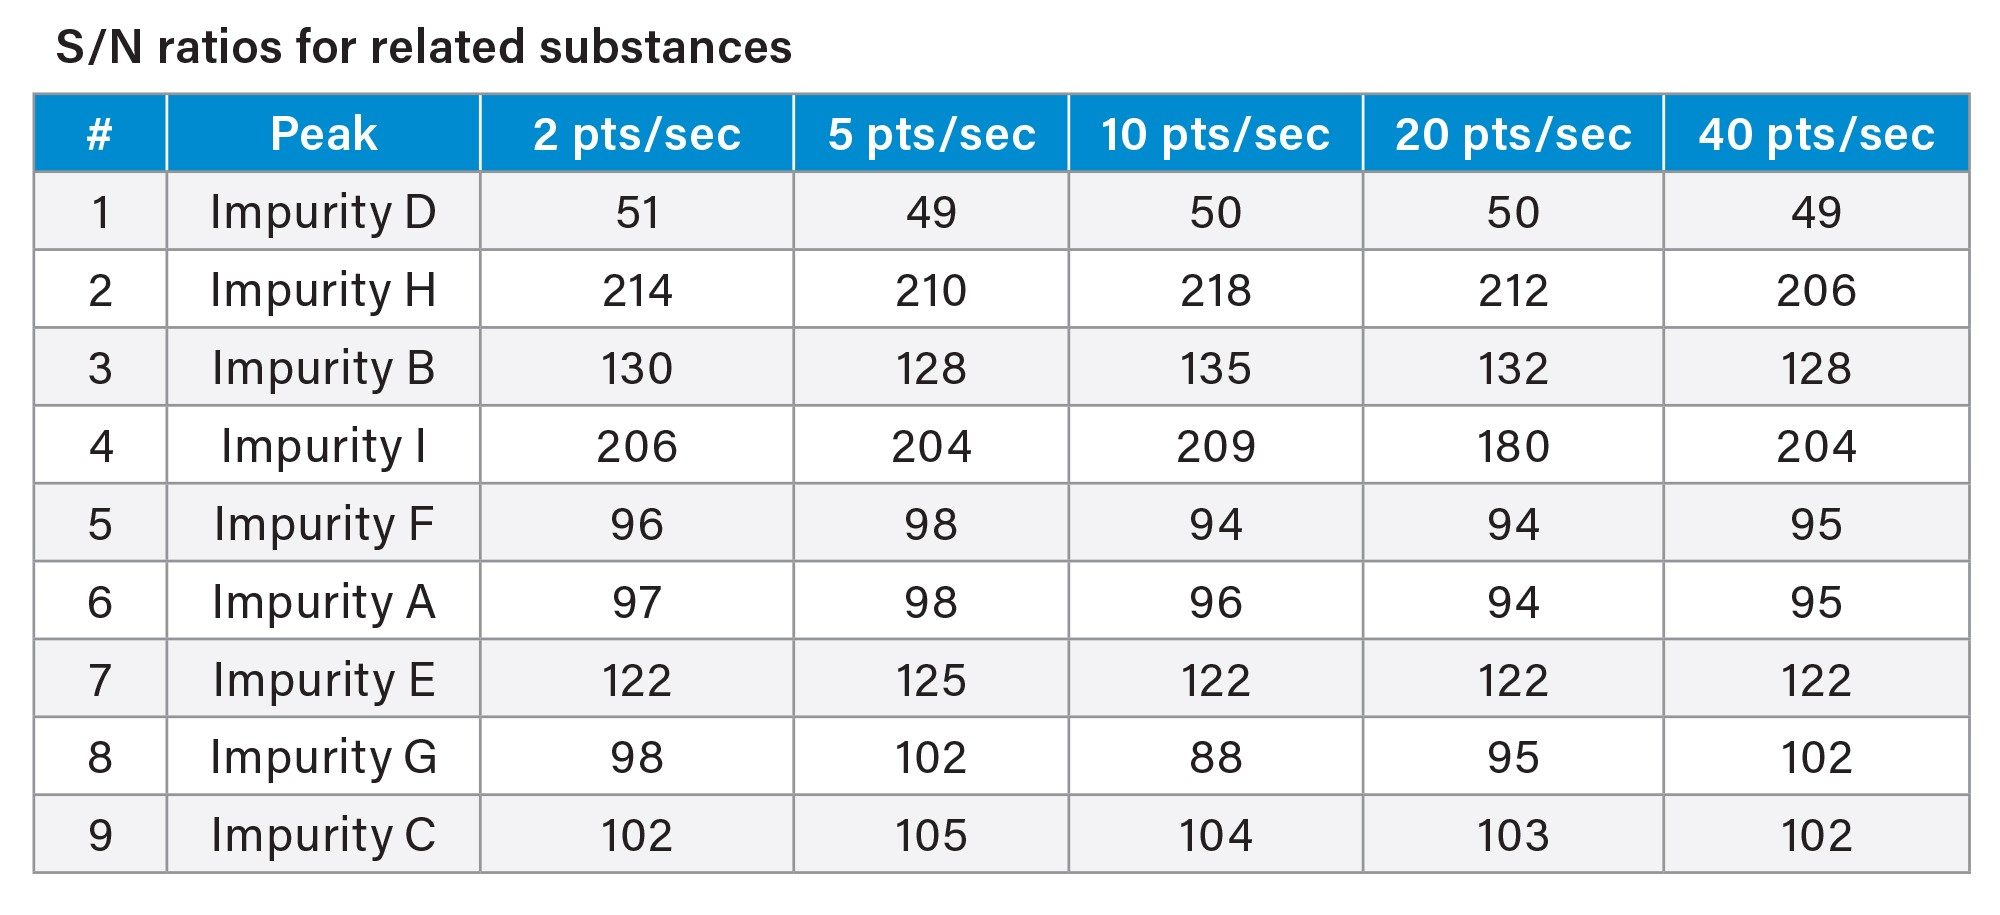
Sampling rate controls the number of CAD data points collected across each chromatographic peak and can affect both peak integration and data quality. For related substances of UDCA, sampling rates were evaluated by comparing peak S/N values (Table 2). Because S/N values were comparable across the tested settings, a default sampling rate of 10 pts/sec was selected for the final method.
Filter Time Constant
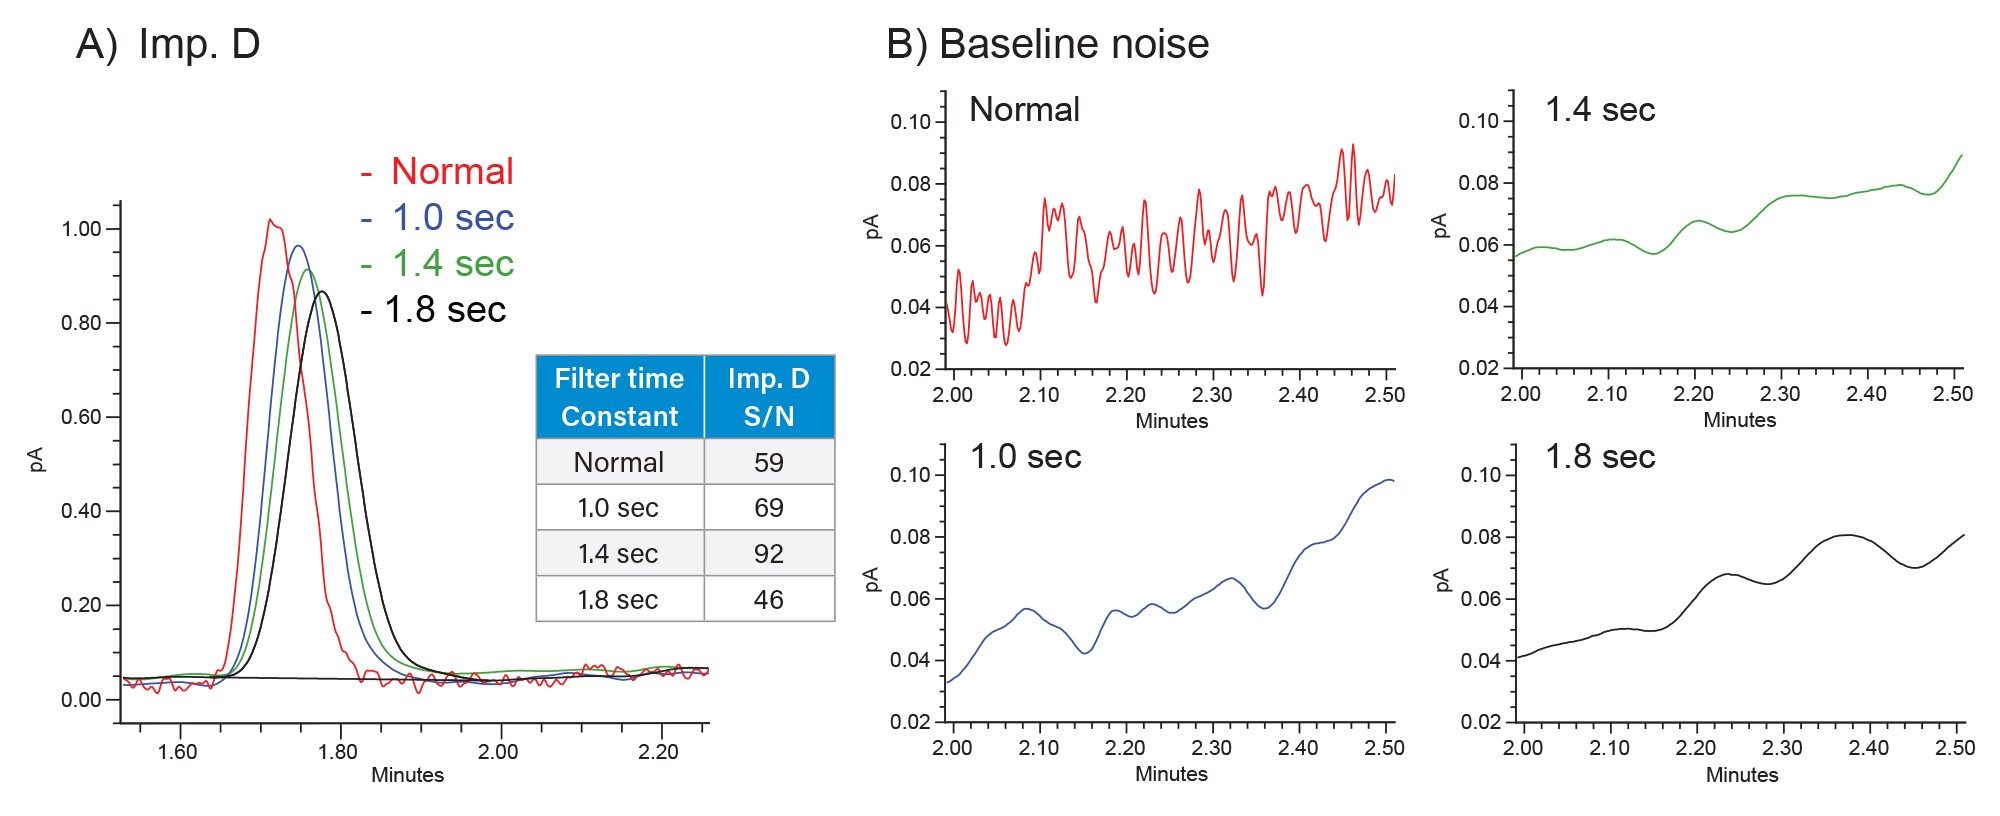
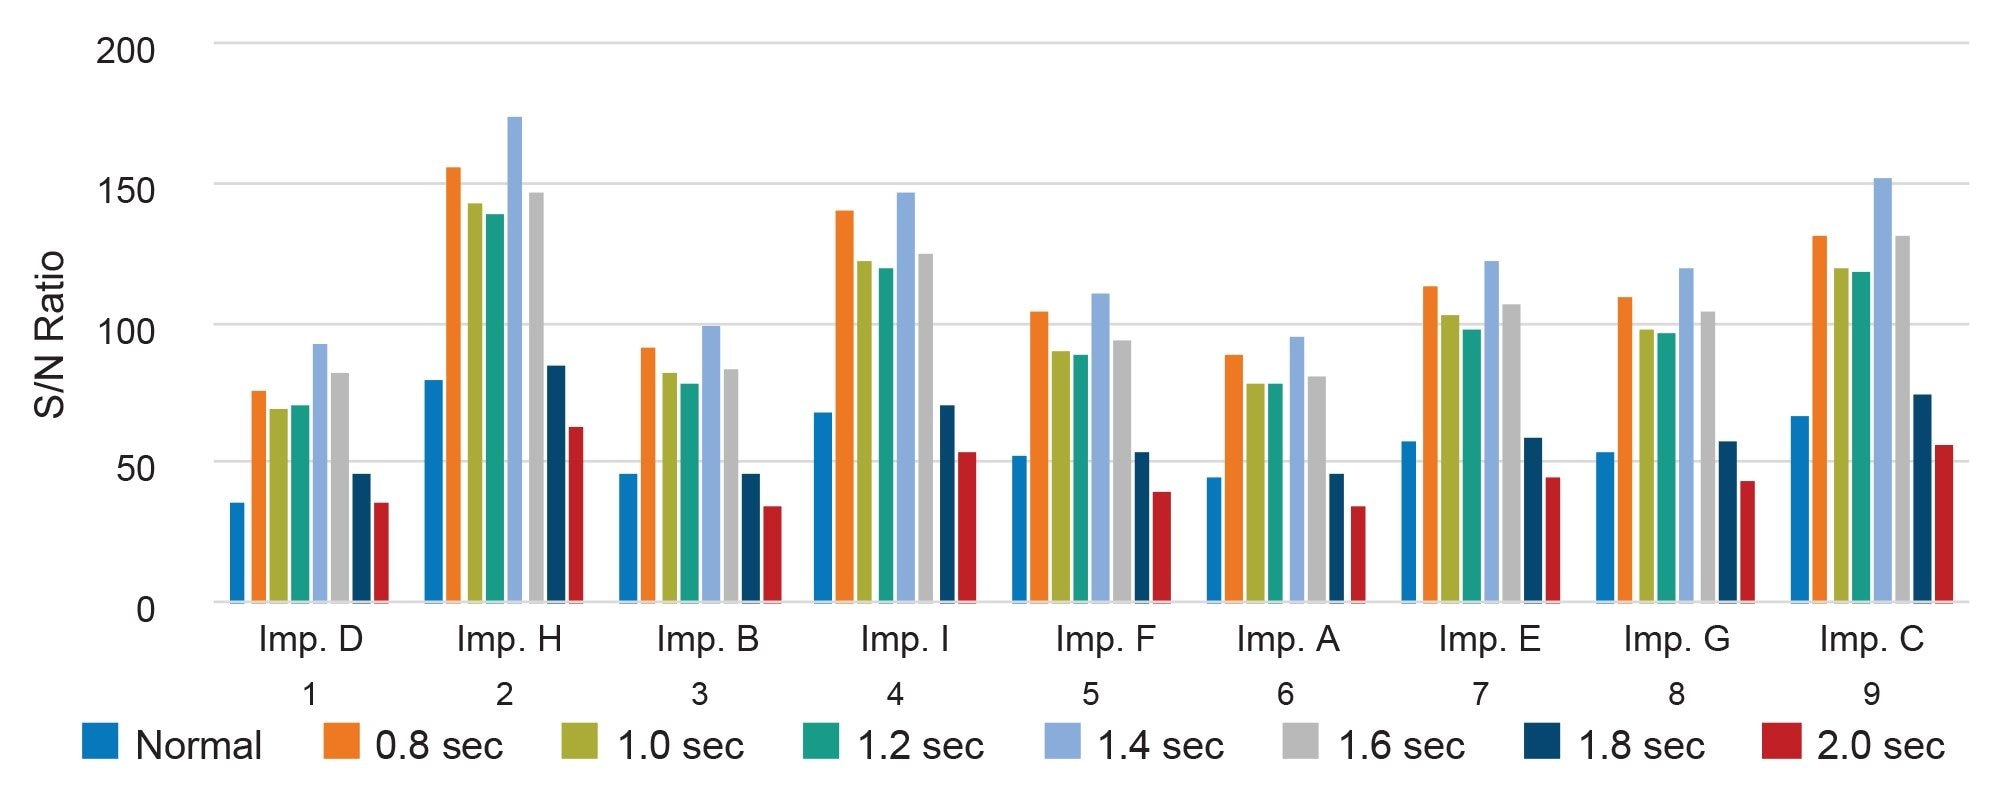
The filter time constant controls signal smoothing in the CAD response. Increasing this value can reduce baseline noise and improve signal stability. The filter time constant was evaluated by comparing CAD response and baseline noise across the tested settings. A value of 1.4 seconds provided the highest response for impurity D while effectively reducing baseline noise (Figure 5). This setting also produced the highest S/N values for all related substances (Figure 6) and was selected for the final method.
Ion Trap Voltage
The CAD ion trap applies electrical voltage to selectively remove smaller, high mobility gas ions, ideally allowing only the charged analyte particles to reach the detector. However, increasing the ion trap voltage can lead to the removal of larger ions and charged particles, which may also include analytes of interest.
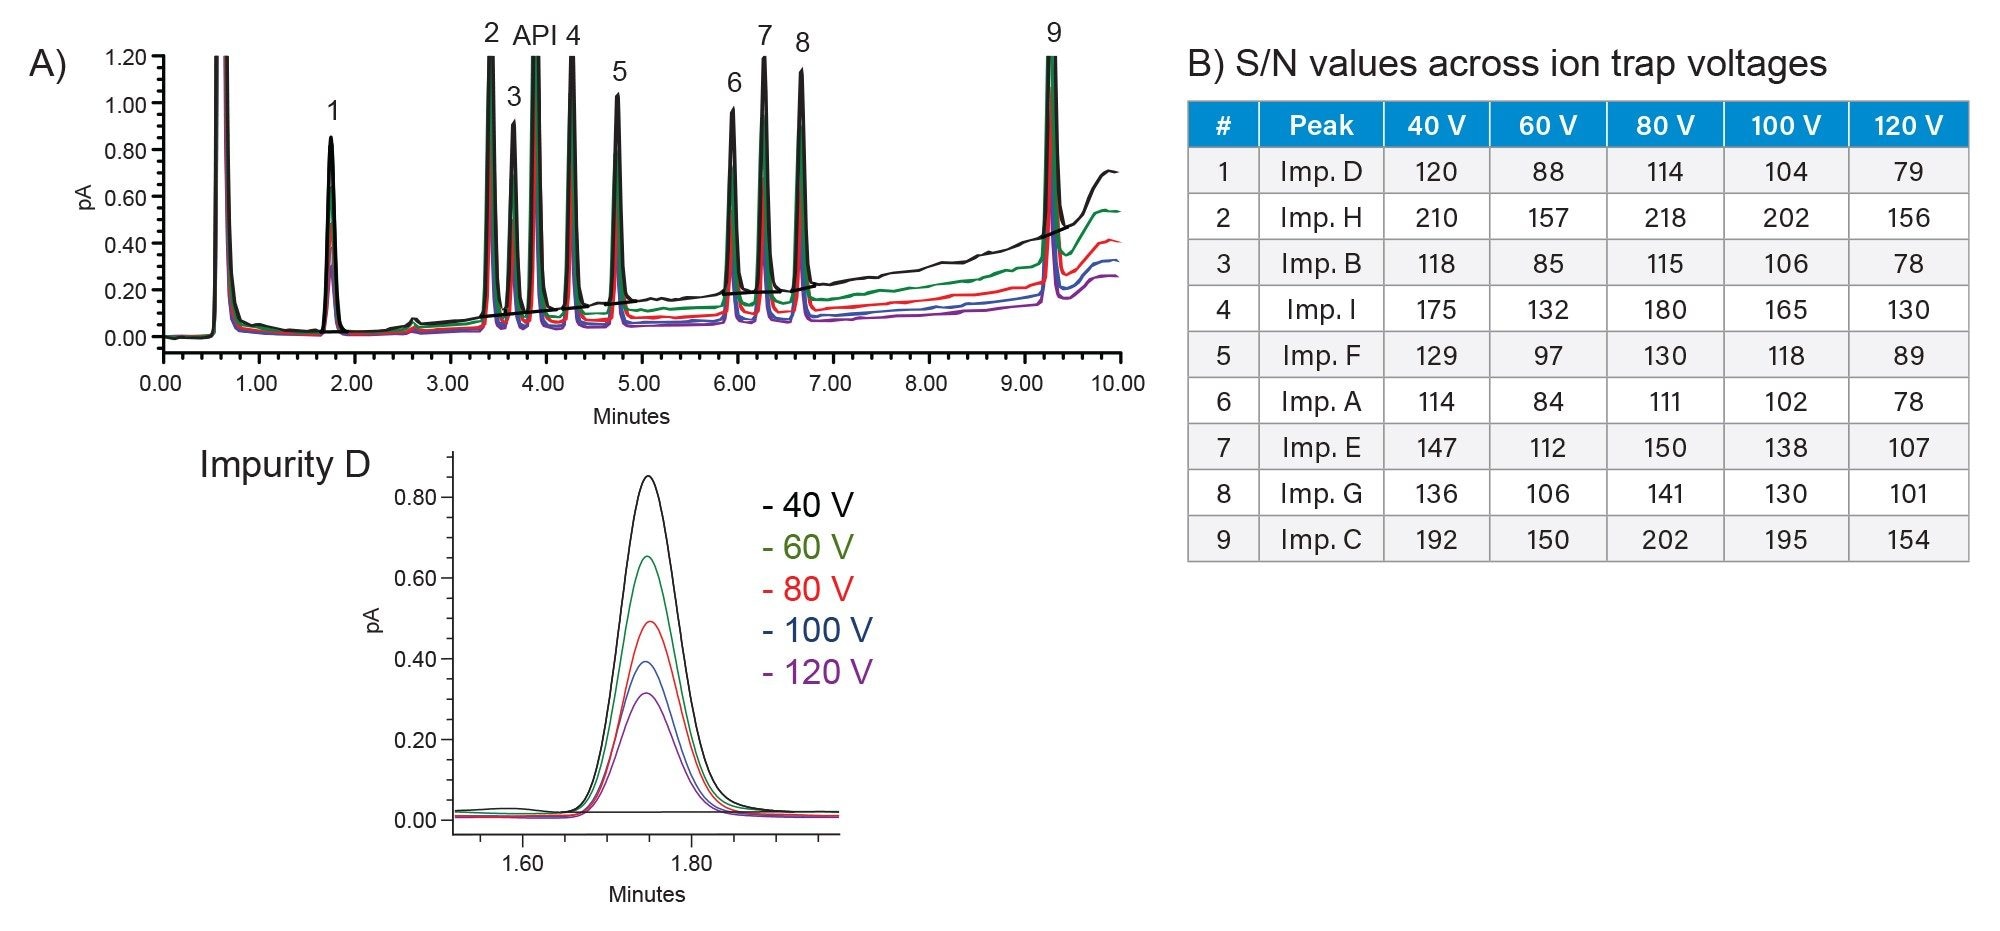
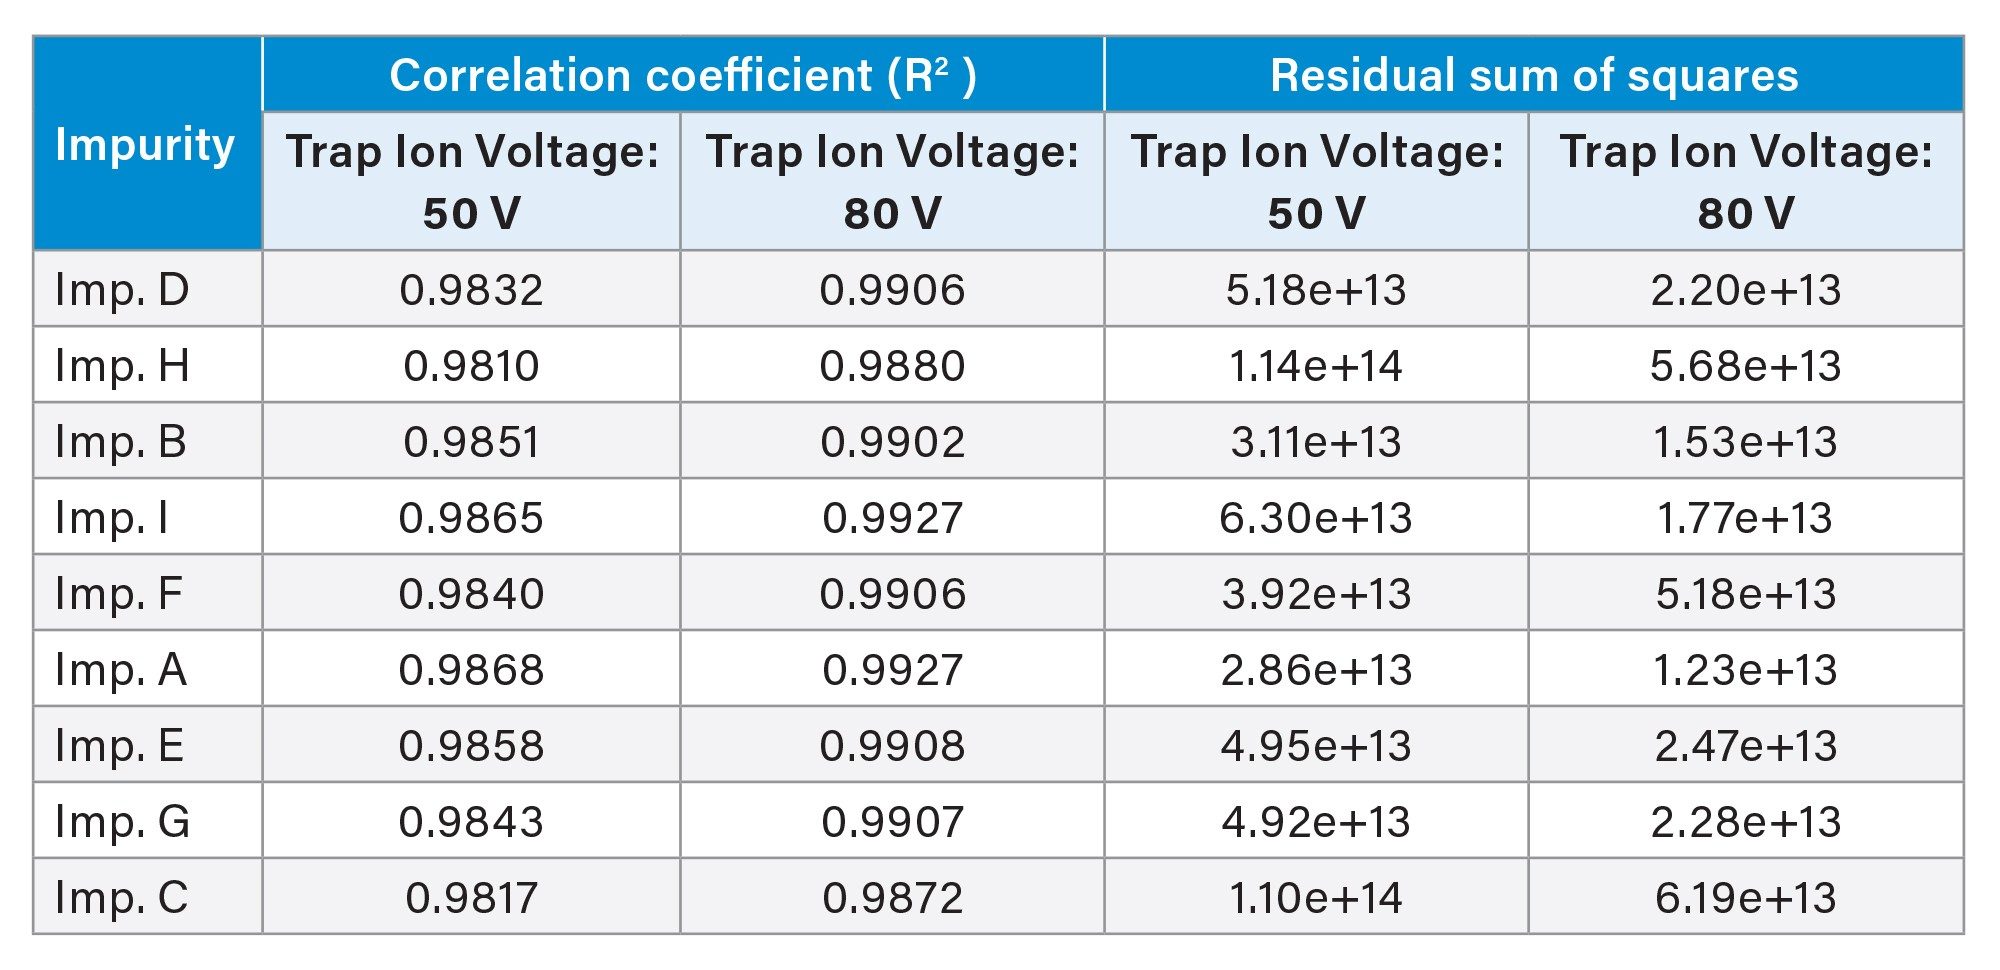
In this study, the ion trap voltage was evaluated from 20 to 120 V. While higher voltages reduced baseline noise, the 80 V maintained sufficient analyte signal and provided the best overall detector performance (Figure 7). This setting was selected for the final method and was further supported by calibration results, which showed improved linearity at 80 V compared to 50 V (Table 3).
Power Function Value
CAD response is typically non-linear across broad concentration ranges because aerosol formation, particle size distribution, and charging efficiency all contribute to the detector output. The PFV is used to transform the detector response and improve calibration linearity.
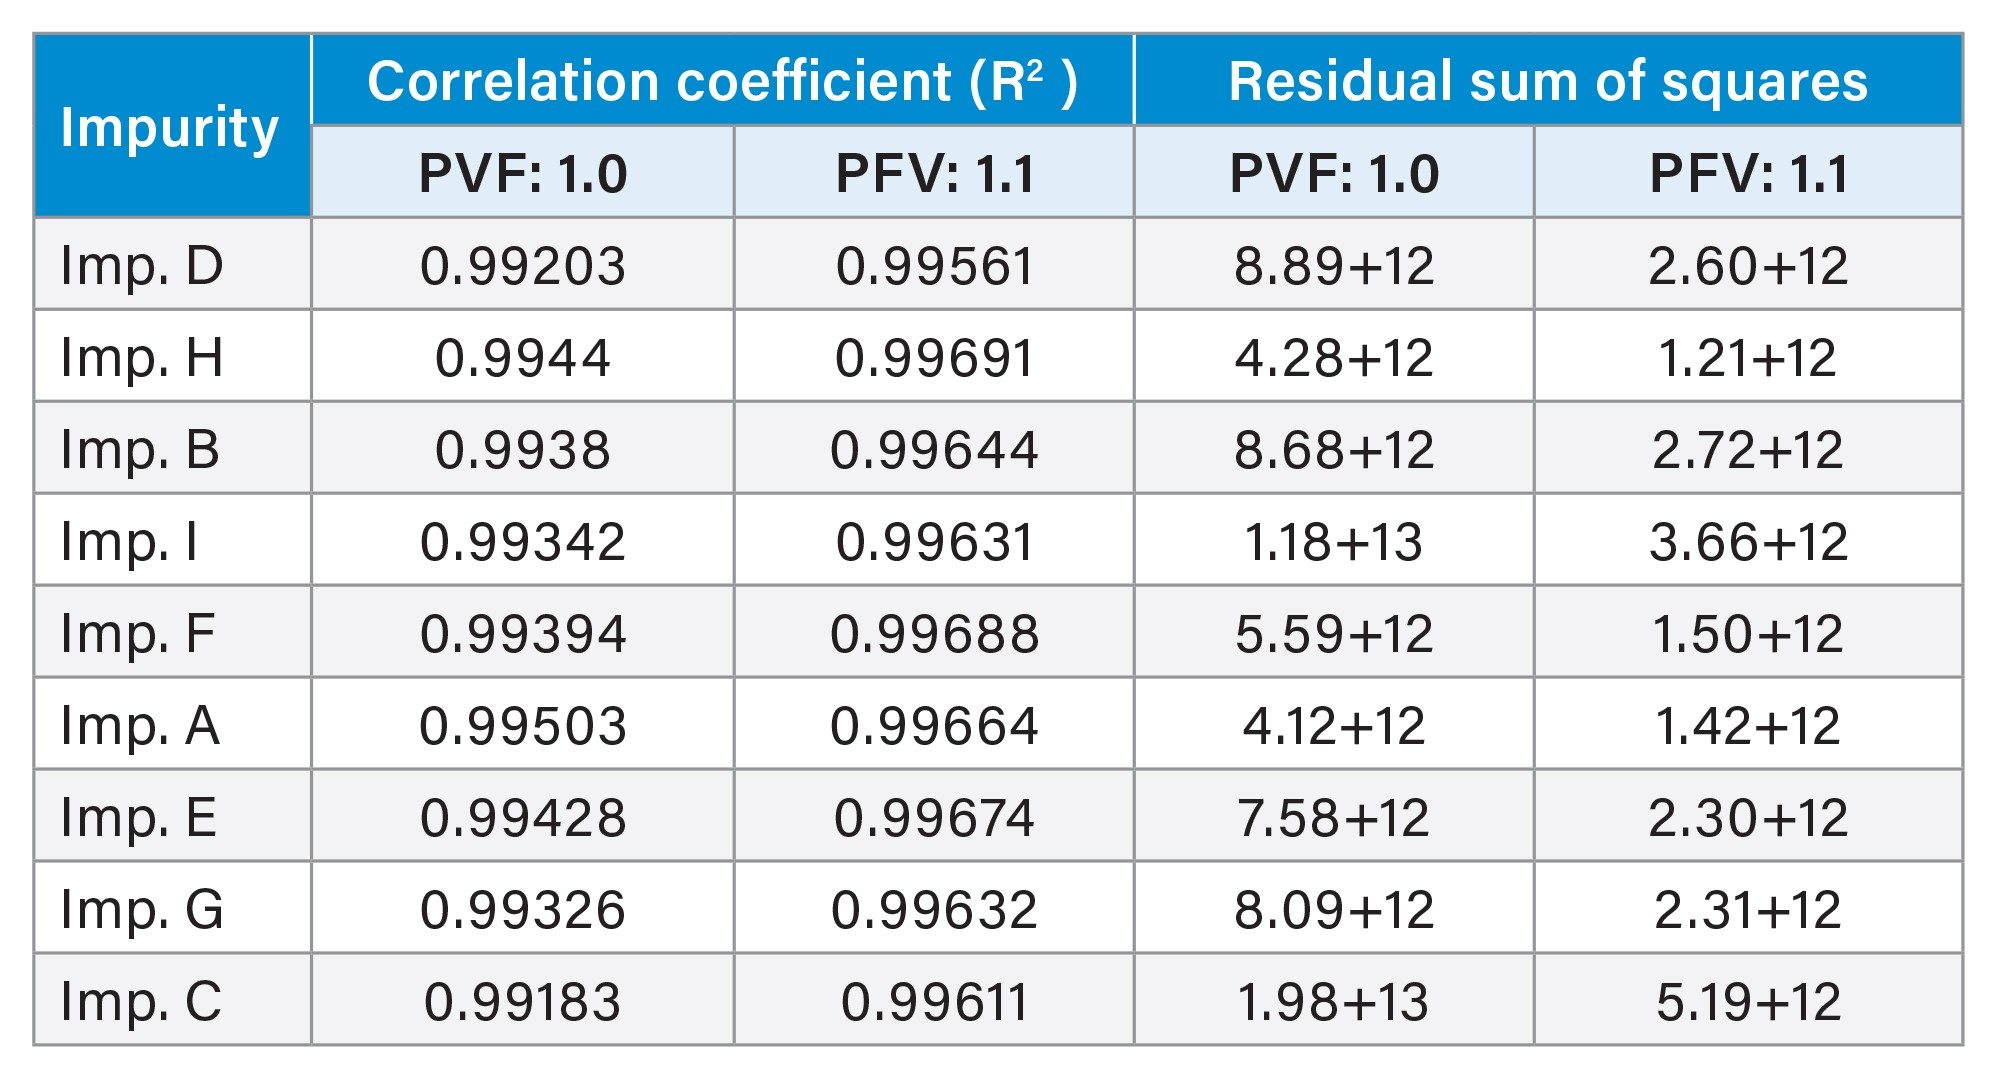
To optimize PFV value for linear response of the related substances, calibration curves were constructed across nine concentrations: 0.05, 0.1, 0.5, 1.0, 5.0, 10, 20, 35, and 50 µg/mL. Four different settings were configured in the instrument method editor for a single injection. Linearity was assessed using correlation coefficients (R2) and residual sum of squares obtained from plots of peak areas versus concentrations, using a linear fit and 1/X weighting. In this case, a PFV of 1.10 provided best linear performance compared to the default PFV value of 1.00, with higher R2 values and lower residuals (Table 4).
Simulation Modeling Tool for Linearity
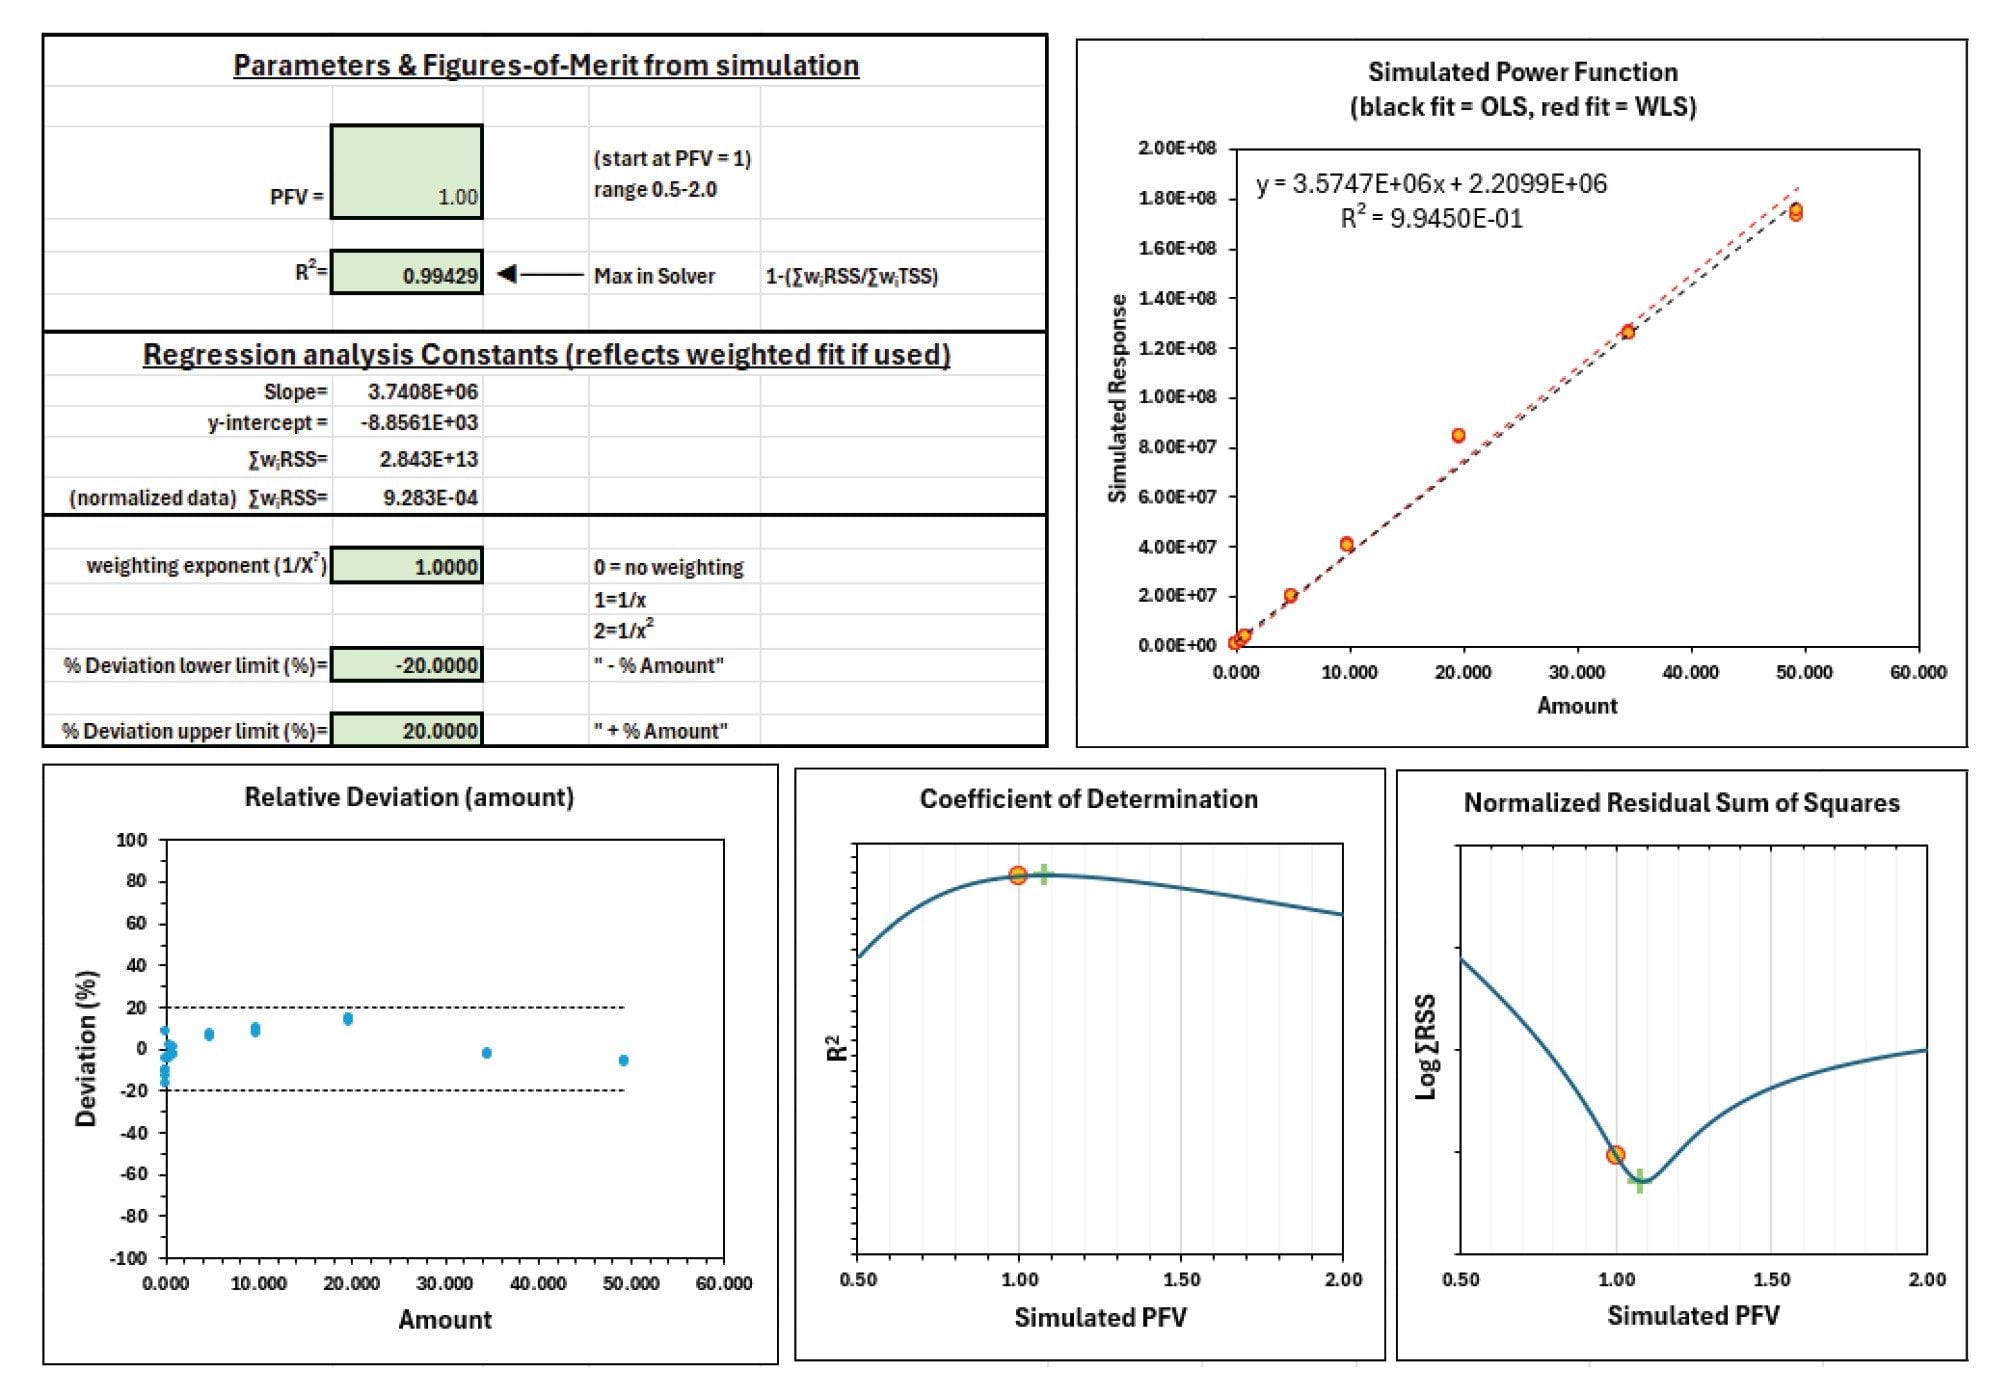
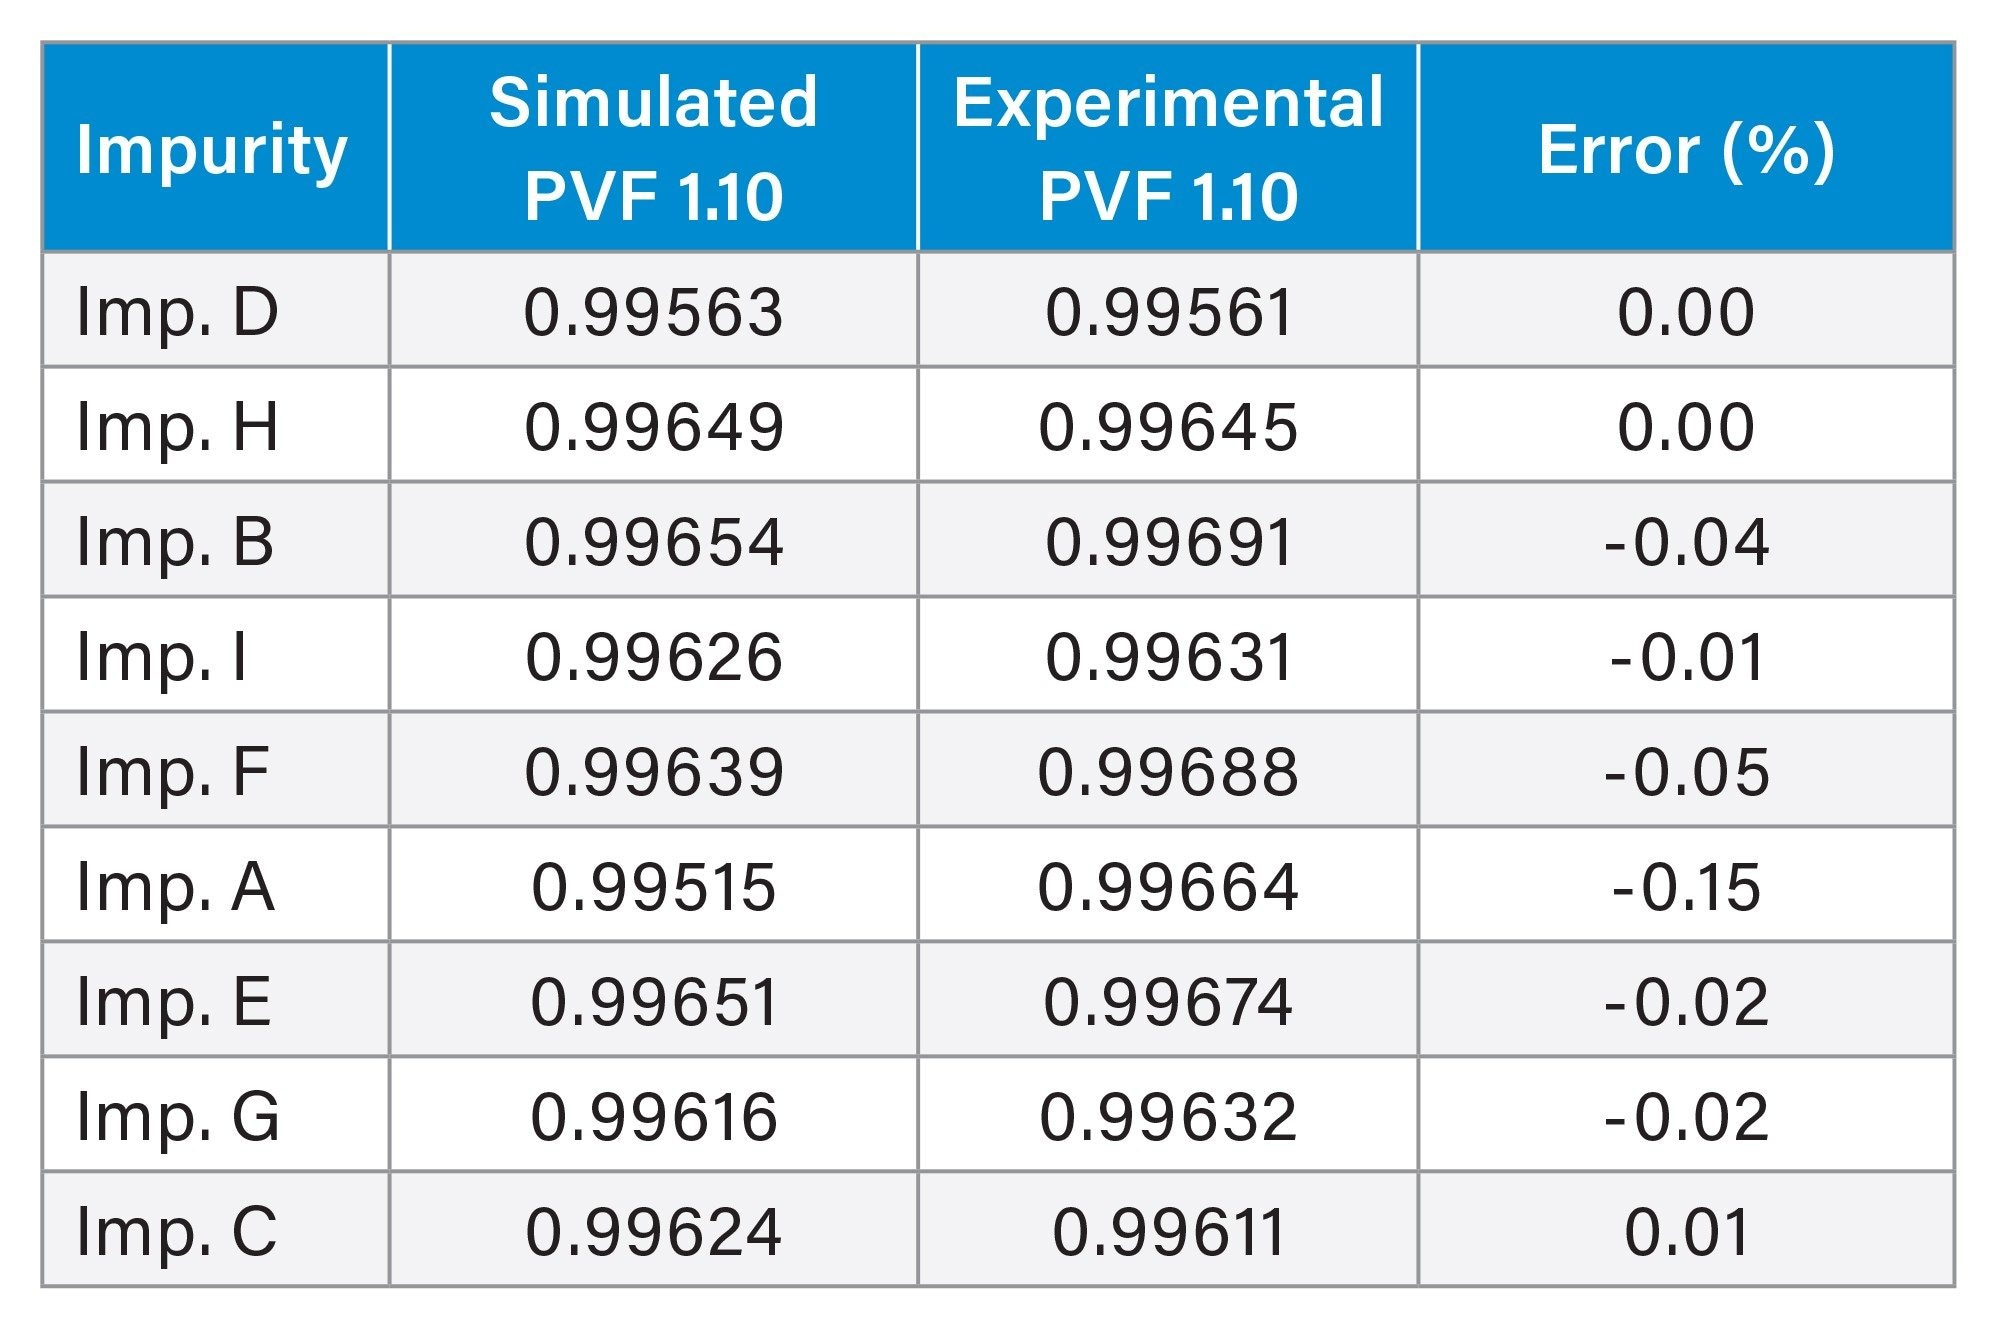
A PFV simulation modeling tool streamlines linearity optimization by predicting the PFV setting that provides a linear CAD response over the calibration range. The model uses data acquired at PFV 1.00 and applies an inverse power function framework to predict PFV settings for linear response.4 For the related substances of UDCA, the predicted PFV setting was 1.10 (Figure 8). This setting was verified experimentally by injecting calibration standards at PVF = 1.10. The simulated and experimental R2 results showed excellent agreement, with low percent error (Table 5).
Conclusion
A systematic workflow was employed to develop a method for the separation and analysis of non-chromophoric UDCA and nine related substances (impurities A–I). Using an ACQUITY Premier System with Waters CAD under Empower Software control, chromatographic conditions were first optimized to resolve UDCA and related substances, followed by targeted optimization of key CAD parameters to improve detector response, S/N performance, and calibration linearity.
The multi-detector configuration, including PDA Detector, Waters CAD, and the ACQUITY QDa II Mass Detector, provided complementary information for chromatographic evaluation and supported component identification during method development.
This workflow demonstrates a practical approach for developing robust LC-CAD methods for non-chromophoric pharmaceutical impurities and other non-volatile or semi-volatile analytes that are difficult to monitor by UV detection. Integrated with Empower Software, the workflow supports streamlined data acquisition, processing, reporting, and traceable review for regulated laboratory environments.
References
- Peepliwal, A.; Bonde, C.G.; Bothara, K.G. A validated RP-HPLC Method for Quantitative Determination of Related Impurities of UDCA (API) by Refractive Index Detection. Journal of Pharmaceutical and Biomedical Analysis, 54 (2011) 845-849.
- Pan, S.; Zhang, Y.; Meng, F.; Wang, F.S. Can UDCA Prevent SARS-CoV-2 Infection or Reduce the COVID-19 Severity? Current Knowledge and Unresolved Issues. Infectious Diseases and Immunity (2023) 3:3
- Roda, A.; Gatti, R.; Cavrini, V.; Cerre, C.; Simoni, P. HPLC Study of the Impurities Present in Different UDCA Preparations: Comparative Evaluation of Four Detectors. Journal of Pharmaceutical and Biomedical Analysis. 11 (1993) 751-760.
- Birdsall, R.; et al. Predicting Linear Operating Range for Charged Aerosol Detection Using an Inverse Power Function Framework. Waters Application Note, 720009440, 2026.
Waters, ACQUITY, QDa, BEH, Empower, and CSH are trademarks of Waters Corporation or its affiliates. Milli-Q is a trademark of Merck KGaA.
Featured Products
720009623, October 2026


