• Application Note

RapiFluor-MS Facilitates Versatile Detection of Released N-Glycans

RapiFluor-MS Facilitates Versatile Detection of Released N-Glycans

  • Matthew A. Lauber
  • Stephan M. Koza
  • Erin E. Chambers
  • Waters Corporation

This is an Application Brief and does not contain a detailed Experimental section.

Abstract

This application brief demonstrates that RapiFluor-MS labeled N-glycans can be readily detected by fluorescence, mass spectrometry as well as UV absorbance.

Benefits

The unique properties of the RapiFluor-MS label can be exploited to detect N-glycans by fluorescence, mass spectrometry, and UV absorbance.

Introduction

Elucidating information about protein N-glycosylation can give insights into disease1-3 and the structure-function properties of biopharmaceuticals.4-5 In previous approaches to N-glycan analysis, analysts relied on laborious preparation techniques, which established a barrier between samples of interest and analytical results.6-7 The recent development of the GlycoWorks RapiFluor-MS N-Glycan Kit has alleviated numerous shortcomings of conventional sample preparations by streamlining and accelerating both the enzymatic release and labeling of N-glycans. In addition, the properties of the novel RapiFluor-MS labeling reagent now make it possible to obtain released glycan profiles by hydrophilic interaction chromatography (HILIC) with inordinately high sensitivity. The RapiFluor-MS labeling reagent was designed with an efficient quinoline fluorophore and a highly basic tertiary amine to enable fluorescence and mass spectrometric (MS) detection (Figure 1). By virtue of being an extensively conjugated fluorophore, the RapiFluor-MS label is also highly chromogenic such that it exhibits reasonably high UV absorptivity. In this work, it is demonstrated that this attribute of the RapiFluor-MS label facilitates the detection of released N-glycans by not only fluorescence and MS detection but also UV absorbance.

Figure 1. Chemical structure of RapiFluor-MS.

Results and Discussion

RapiFluor-MS labeled glycans prepared from pooled human IgG were analyzed by HILIC and three different modes of detection: UV, fluorescence, and MS. To approximate method sensitivity, these N-glycans were separated at total mass loads ranging from 0.02 to 20 pmols, and to have direct correspondence between data sets, detection was performed serially from UV to fluorescence to MS.

Figure 2 displays the chromatograms from each detection mode. Results from increasingly higher mass loads are shown across the figure from left to right. As can be seen through observation of the middle chromatograms, as little as 20 fmols of a RapiFluor-MS N-glycan pool can be readily visualized by fluorescence detection. This corresponds to a limit of detection (LOD) that is remarkably low for an individual RapiFluor-MS N-glycan species, a value corresponding to ≤1 fmol. As evidenced by the top chromatograms, MS sensitivity is likewise noteworthy. Using a Xevo G2-XS QTof mass spectrometer, RapiFluor-MS N-glycans were detected on base peak intensity (BPI) chromatograms down to individual glycan quantities of approximately 10 fmols. That informative mass information can be produced at such low levels alongside the limits of fluorescence detection is a testament to the design of the RapiFluor-MS label.

Figure 2. RapiFluor-MS N-glycans at varying mass loads as profiled by HILIC using MS, fluorescence, and UV detection. Analyses were performed with an ACQUITY UPLC H-Class Bio System and a Xevo G2-XS QTof using the RapiFluor-MS N-Glycan Kit , the ACQUITY UPLC Glycan BEH Amide Column, 130Å, 1.7 μm, 2.1 x 150 mm  and the method described in the RapiFluor-MS N-Glycan Kit Care and Use Manual (715004793EN). Samples were injected at varying quantities, corresponding to the N-glycans derived from 0.02, 0.2, 2, and 20 pmols of pooled human IgG (RapiFluor-MS Glycan Performance Test Standard).

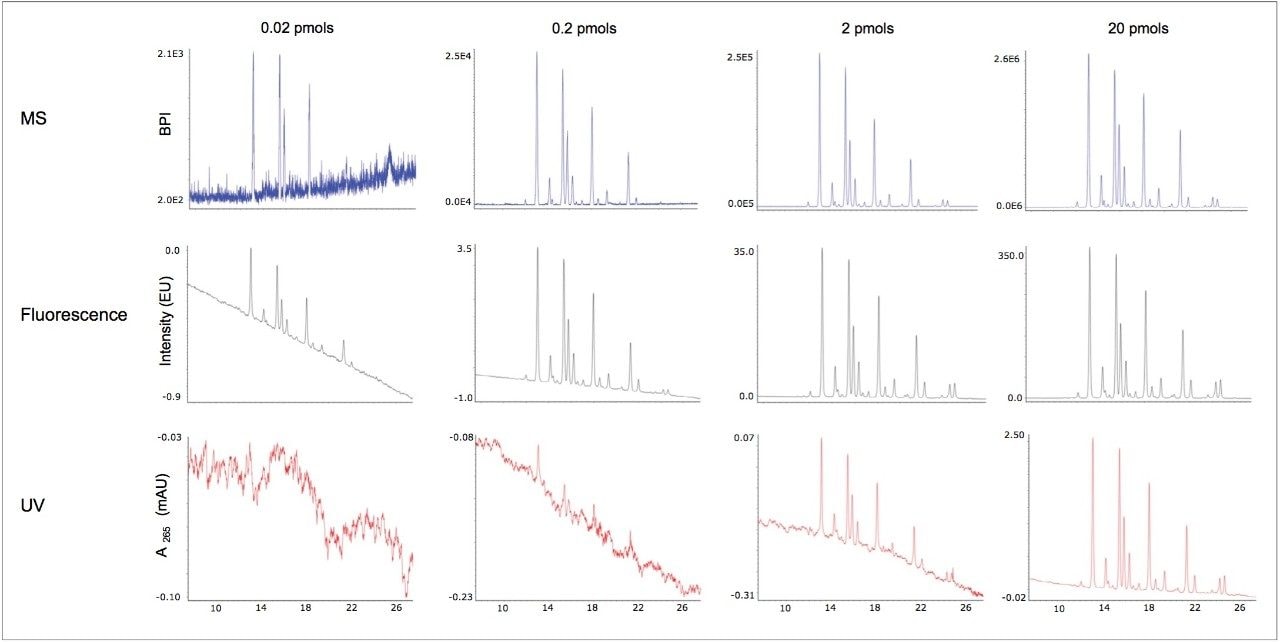
Yet, what is of interest here is UV-based detection, for which representative data are shown with the bottom chromatograms. These data clearly demonstrate that RapiFluor-MS labeled glycans can be detected via their UV absorbance, albeit with reduced sensitivity. N-glycans were detectable by UV at a 2 pmol load of an IgG glycan pool with a limit of detection for single species of about 100 fmols. Interestingly, this could be sufficient sensitivity for some applications of released glycan analysis. The GlycoWorks RapiFluor-MS N-Glycan Kit allows for the analysis of 5 pmols up to about 20 pmols of IgG glycans without the need for evaporation and concentration, which helps to make it practical to implement UV detection.

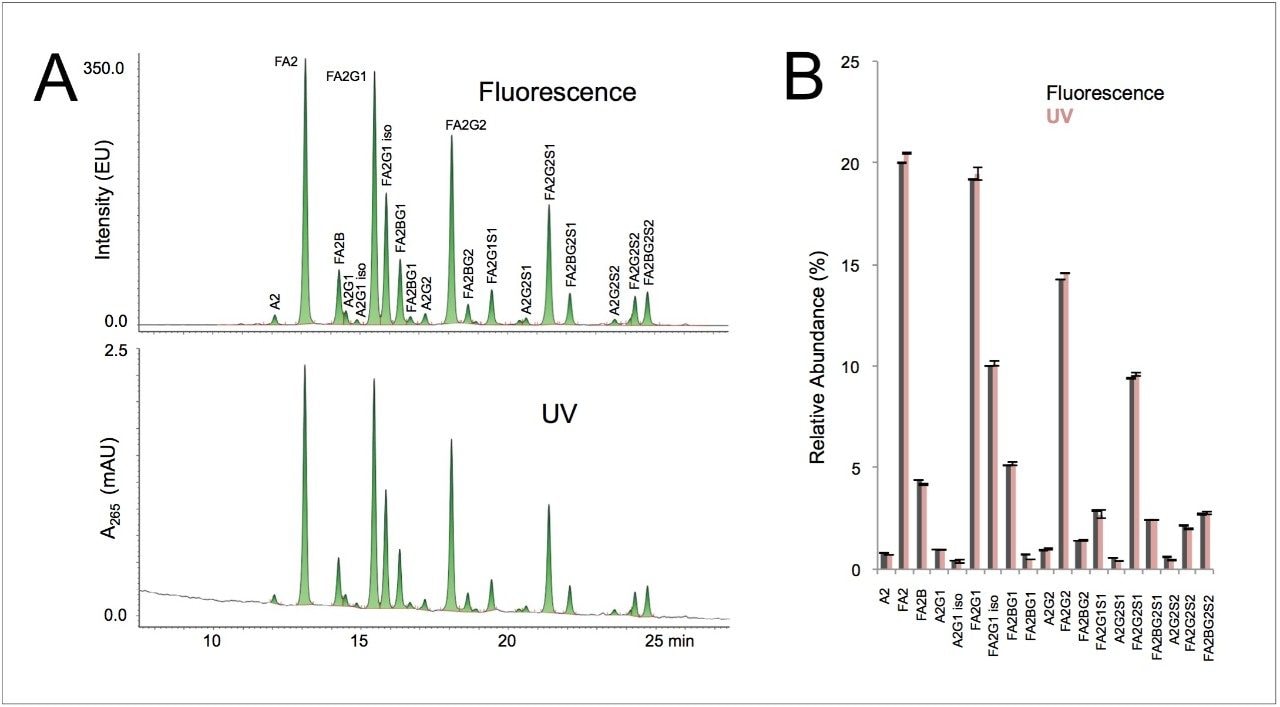
Here, a 20 pmol load of IgG glycans was indeed able to produce an adequately sensitive UV profile for relative quantitation. Figure 3A shows a comparison of the 20 pmol IgG N-glycan profile as obtained by UV versus fluorescence detection. Undoubtedly, fluorescence yields a higher quality profile that could more easily support investigations into very low abundance glycans, such as those below 0.1% relative abundance. Nevertheless, as shown in Figure 3B, the UV profile proved to give comparable determinations for species above 0.2% relative abundance.

Figure 3. Relative quantitation as performed with UV versus fluorescence detection. (A) UV and fluorescence chromatograms obtained for 20 pmols of RapiFluor-MS Glycan Performance Test Standard . (B) Relative abundances of the 19 most abundant glycan species.

Conclusion

The unique properties of the RapiFluor-MS label can be exploited to detect N-glycans by both fluorescence and mass spectrometry, and, as we now show, by UV absorbance. Fluorescence, with its LOD of ≤1 fmol, offers the most robust sensitivity for chromatographic detection. Modern QTof mass spectrometry is sensitive down to quantities of about 10 fmols using analytical scale chromatography. UV detection, meanwhile, produces interpretable signal for a 100 fmol quantity of an individual RapiFluor-MS glycan. While there is an order of magnitude difference among their limits of detection, each detection mode could potentially be implemented to interrogate an N-glycan sample. One advantage that UV absorbance has over fluorescence and MS is that the measured peak heights and areas are comparable between LC systems for a defined separation when corrected for flow cell path length. Such versatile detection can be taken advantage of to troubleshoot instrumentation or to implement released glycan analysis where there may be limited options available for instrumentation.

References

  1. Ohtsubo, K.; Marth, J. D., Glycosylation in cellular mechanisms of health and disease. Cell 2006, 126 (5), 855–67.
  2. Mechref, Y.; Hu, Y.; Garcia, A.; Zhou, S.; Desantos-Garcia, J. L.; Hussein, A., Defining putative glycan cancer biomarkers by MS. Bioanalysis 2012, 4 (20), 2457–69. 
  3. Ruhaak, L. R.; Miyamoto, S.; Lebrilla, C. B., Developments in the identification of glycan biomarkers for the detection of cancer. Mol Cell Proteomics 2013, 12 (4), 846–55.
  4. Dalziel, M.; Crispin, M.; Scanlan, C. N.; Zitzmann, N.; Dwek, R. A., Emerging principles for the therapeutic exploitation of glycosylation. Science 2014, 343 (6166), 1235681.
  5. Beck, A.; Wagner-Rousset, E.; Ayoub, D.; Van Dorsselaer, A.; Sanglier-Cianferani, S., Characterization of therapeutic antibodies and related products. Anal Chem 2013, 85 (2), 715–36.
  6. Mechref, Y.; Hu, Y.; Desantos-Garcia, J. L.; Hussein, A.; Tang, H., Quantitative glycomics strategies. Mol Cell Proteomics 2013, 12 (4), 874–84.
  7. Ruhaak, L. R.; Zauner, G.; Huhn, C.; Bruggink, C.; Deelder, A. M.; Wuhrer, M., Glycan labeling strategies and their use in identification and quantification. Anal Bioanal Chem 2010, 397 (8), 3457–81.

720005646, March 2016

Back To Top Back To Top