• Application Note

Rapid Quantitative Analysis of Cannabidiol from Consumer Products

Rapid Quantitative Analysis of Cannabidiol from Consumer Products

  • Andrew J. Aubin
  • Waters Corporation

Abstract

This application note describes the rapid analysis of CBD from a several consumer products using UltraPerformance Convergence Chromatography (UPC2).

Benefits

  • Direct injection of non-polar extraction solvent
  • Short chromatography run time (3 min)
  • High throughput analysis

Introduction

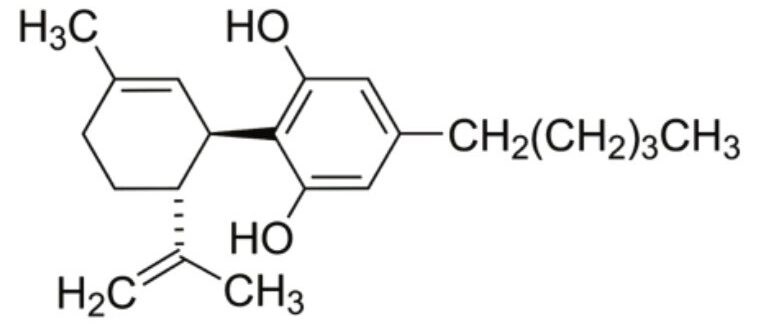
Cannabidiolic acid (CBDA) is produced in large abundance in some therapeutic hemp cultivars.1 Cannabidiol (CBD, Figure 1), the heat-induced decarboxylation product of CBDA, is non-psychoactive and thought to have a wide scope of potential medicinal benefits including anti-inflammatory, anti-convulsant, anti-psychotic, anti-oxidant, neuroprotective, and immunomodulatory effects.2 CBD has traditionally been administered by smoking or vaporizing (thereby converting CBDA to CBD). Although effective drug delivery systems, smoking and vaporizing are unappealing to many potential users. The therapeutic hemp industry has responded to consumer demands, and a large variety of products containing CBD are now freely available for purchase and consumption. These products are processed in way that ensures that any CBDA present is converted to CBD. This application note will describe the rapid analysis of CBD from a several consumer products using UltraPerformance Convergence Chromatography (UPC2). 

UPC2 is a separation technique that uses compressed carbon dioxide as the primary mobile phase. It takes advantage of sub-2-µm particle chromatography columns and advanced chromatography systems designed to achieve fast and reproducible separations with high efficiencies and unique selectivity along with generating low solvent waste as compared to traditional liquid chromatography. The technique is applicable to a wide variety of compounds and is particularly suited for the analysis of non-polar molecules. 

Chemical structure of Cannabidiol
Figure 1. Chemical structure of Cannabidiol.

Experimental

UPC2 conditions

System:

ACQUITY UPC2 with ACQUITY UPC2 PDA Detector

Column:

ACQUITY UPC2 Torus 2-PIC, 1.7 μm, 3.0 x 100 mm

Mobile phase A:

CO2

Mobile phase B:

Methanol

Flow rate:

2.0 mL/min

Gradient:

3–15% B over 3 minutes

Column temp.:

50 °C

ABPR:

1800 psi

UV detection:

228 nm (compensated 500–600 nm)

Injection volume:

1.0 μL

Strong needle wash:

Methanol

Weak needle wash:

Methanol

Seal wash:

Methanol

Sample preparation

Products containing CBD were purchased from internet suppliers and included a chewing gum tablet, a topical cream, a tincture, an edible capsule, and a concentrated paste. As with any consumable product, excipient materials from the formulation must be removed during sample preparation and/or resolved from compounds of interest during analysis. Complex formulations such as those presented here (particularly chewing gum and the topical cream) contain a significant number of known and unknown excipients and can be challenging to analyze. Label claim amounts of CBD ranged from 1.25 to 225 mg/g and are listed in Table 1. A portion of each sample was weighed into a separate vial to which 5 mL of water was added along with 10 mL of hexane. Samples were sonicated for 60 minutes and then thoroughly mixed on a vortex mixer for 2 minutes. Samples were then placed in a -20 °C freezer overnight. A portion of the hexane layer was then filtered through a 0.45-µm PTFE syringe tip filter directly into a 1.5-mL sample vial, capped and used directly with the exception of the capsule extraction which was diluted with hexane 5X prior to injection. Standards were prepared from a 1-mg/mL stock solution to concentrations of 0.10, 0.25, 0.50, and 0.75 mg/mL.

Separations

Analytical separations were performed on a Waters ACQUITY UPC2 System controlled by Empower 3 Software at the conditions listed under “Experimental.”

Results and Discussion

A calibration curve was generated by injecting 1 µL of each of the 5 standard concentrations (0.10, 0.25, 0.50, 0.75, and 1.00 mg/mL, Figure 2). Retention times over the curve were very reproducible (1.68 min +/- 0.07% RSD) and produced a linear response based on area counts (r2 >0.9994, Figure 3). Following generation of the calibration curve, 1 µL of each of the previously prepared samples were subsequently injected. Amounts of CBD were automatically calculated using Empower 3. Representative chromatography of the analyzed samples is presented in Figure 4 A–E. Separations were completed quickly (3 minutes per analysis) and were successful in isolating CBD from the bulk of excipient materials in the 5 samples examined due to the unique selectivity of Torus 2-PIC Column. Calculated amount of CBD in each of the samples met or exceeded the CBD amount label claims (Table 1).

Overlay of the 5 CBD Standards
Figure 2. Overlay of the 5 CBD Standards (0.10, 0.25, 0.50, 0.75, and 1.00 mg/mL). Retention time 1.68 min +/- 0.07% RSD.
CBD calibration curve showing linear response
Figure 3. CBD calibration curve showing linear response (r2 >0.9994).
Separation of CBD from a variety of consumer products
Figure 4 A–E. Separation of CBD from a variety of consumer products (A–Chewing gum, B–Tincture, C–Cream, D–Paste, E–Capsule).
Results of CBD analysis
Table 1. Results of CBD analysis.

Conclusion

UPC2, in combination with a sub-2-µm ACQUITY UPC2 Torus 2-PIC Column, proved to be a viable technique for the determination of Cannabidiol in multiple consumer products. Separation of CBD from excipient materials was achieved in 3 minutes per sample and proved suitable for quantitation. Response of standards was linear and retention times reproducible. Analyzed samples met or exceeded CBD label amounts. This methodology is suitable for laboratories performing quality control or product quality monitoring of CBD content a wide range of consumable product formulations.

References

  1. American Herbal Pharmacopoeia, Cannabis Inflorescence, 2013, Roy Upton editor. 
  2. Abir T. El-Alfy et al. Antidepressant-like effect of Δ9-tetrahydrocannabinol and other cannabinoids isolated from Cannabis sativa L. Pharmacol Biochem Behav. Jun 2010; 95(4): 434–442.


720005201, October 2014

Back To Top Back To Top