• Application Note

Enhanced Identification of 2D-Gel Isolated Proteins from Escherichia Coli Using PSD MX 

Enhanced Identification of 2D-Gel Isolated Proteins from Escherichia Coli Using PSD MX 


  • Emmanuelle Claude
  • Marten F. Snel
  • Thomas Franz
  • Anja Bathke
  • Therese McKenna
  • James I. Langridge
  • Waters Corporation
  • European Molecular Biology Laboratory

Abstract

In this application note we describe use of the new PSD MX technique for the identification of 2D-gel isolated proteins. The incorporation of PSD MX information is clearly shown to improve the success rate for protein identification. In this study PSD MX increased the number of sample spots from which protein identifications were obtained by 57%, compared to peptide mass fingerprinting alone. The overall success rate for protein identification across the 96 in-gel digested samples was 83%, using both the MS and PSD MX information.

Benefits

  • Peptide mass fingerprinting resulted in identification of 54% of the wells from 96 2D-gel separated E. coli samples
  • PSD MX analysis of the same samples increased the hit rate from 54% to 83%, resulting in the identification of 83 proteins in total

Introduction

Peptide mass fingerprinting (PMF) is a wellestablished technique for the identification of proteins from MALDI-TOF-MS data.1

Despite the wide acceptance and success of this technique, PMF under certain circumstances will fail. In cases where the protein sequence is poorly characterized, if a mixture of proteins with a wide dynamic range is present in the sample or if the number of tryptic peptides produced by the proteolytic digestion is low then PMF may be frustrated.

In this study, we evaluate a new approach, parallel Post Source Decay (PSD MX), that provides complementary structural information to MALDI-TOF/MS information.

In traditional PSD the selection of precursor ions with a timed electrostatic ion-gate is required. In the parallel PSD approach, the ion gate is not required as fragment ions from all of the precursor ions are acquired simultaneously. A deconvolution algorithm has been developed to match precursor ions with fragment ions. This novel approach simplifies the PSD experiment, as no decision has to be made on which precursor ions to select, reduces sample consumption and increases the number of peptides analyzed. The PSD MX experiments are performed fully automatically.2

In this application note we have compared the success rate for the identification of proteins using PSD MX data with that obtained when using PMF alone. The proteins analyzed were obtained from an E. coli cell lysate that was separated by 2D-gel electrophoresis and subsequently subjected to in-gel tryptic digestion.

The Waters Protein Identification System featuring the MassPREP Station, MALDI micro MX Mass Spectrometer and ProteinLynx Global SERVER Informatics. 

Experimental

Sample Preparation

A 250 μg sample of a lyophilized E. coli protein sample (Bio-Rad, Hercules, CA) was separated by 2D-gel electrophoresis. The proteins were visualized by Coomasie staining. The staining solution consisted of 0.08% Coomasie G250 (Merck, Darmstadt, Germany), 1.6% ortho-phosphoric acid 85%, 8% ammonium sulfate (Merck, Darmstadt, Germany) and 20% methanol (Merck, Darmstadt, Germany). Gel spots were excised from the gel using a Proteome Works Plus spotcutting robot (Bio-Rad, Hercules, CA). The gel pieces were deposited in one 96-well microtiter plate with 1–5 gel pieces per well.

The gel samples were processed using the Waters MassPREP Station liquid handling robot. The control software of the MassPREP Station (Digestion 5.7) allows de-staining, reduction, alkylation, digestion, and extraction. The extracted peptide solutions (1 μL) were spotted with 1 μL of alpha-cyano-4-hydroxycinnamic acid matrix, 3 mg/mL (1/1 v/v MeCN/0.1 % aqueous TFA).

Mass Spectrometry

PMF Data Acquisition and Processing
  • All MS spectra were acquired on a Waters Micromass MALDI micro MX mass spectrometer. Data were acquired in positive ion mode over the m/z range of 1000–3000 in reflectron mode
  • The instrument was operated in a fully automated manner, using the data to direct the settings. One hundred (100) laser shots were summed for each MS spectrum
  • A digest of alcohol dehydrogenase spotted at a concentration of 500 fmol on target was used to generate a multi-point external calibration
  • An external lock mass correction was applied to every acquisition using a synthetic polyproline peptide, P14R (Sigma, St Louis, MO); [MH]+ = 1533.8582 Da, at a concentration of 250 fmol on target
  • Waters ProteinLynx Global SERVER 2.2 was used for data processing and database searching 
  • MS (PMF) data were smoothed, background subtracted and de-isotoped using MaxEntLite
  • Processed data generated were automatically submitted to a databank search against a Swiss-Prot database (v40). Database searching was performed using the Mascot search engine (Matrix Science Ltd, London, UK), with results collated and displayed using the ProteinLynx Global SERVER v2.2 interface
PSD MX Data Acquisition and Processing
  • PSD MX spectra were acquired on a MALDI micro MX mass spectrometer
  • Data were acquired in positive ion mode over the m/z range100-3000 in PSD MX mode. The instrument was operated in a fully automated manner with laser settings and target plate positions determined automatically, using the data to direct the settings. PSD MX data were calibrated using PSD fragments generated from P14R (Sigma, St Louis, MO); [MH]+ = 1533.8582 Da, at an amount of 2 pmol on target. Six PSD segments, at two reflectron voltages each were acquired per sample
  • For each segment, 400 laser shots were summed, giving a total of 2400 laser shots per PSD MX experiment. An external lock mass correction was applied to every acquisition using P14R at a level of 250 fmol on target
  • ProteinLynx Global SERVER 2.2 was used for data processing and database searching
  • PSD data were smoothed, background subtracted and centroided
  • Fragment ions were matched to their precursor ions using a deconvolution algorithm, implemented in MassLynx and ProteinLynx Global SERVER 2.2. A peaklist (pkl) was generated for each spot and automatically submitted to a databank search, against a Swiss-Prot database (v40)

Results and Discussion

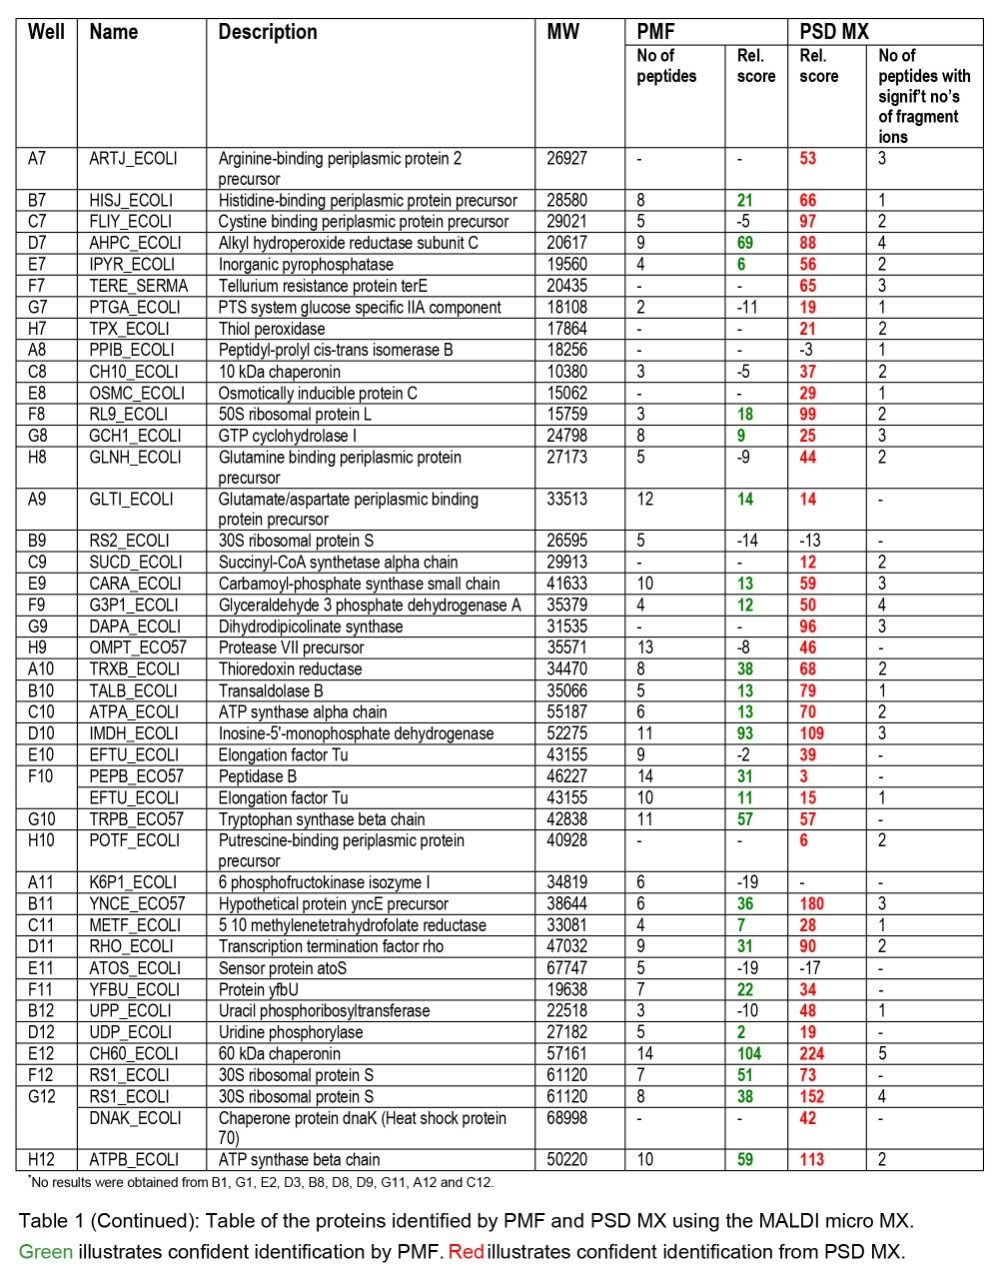
Databank Search Results

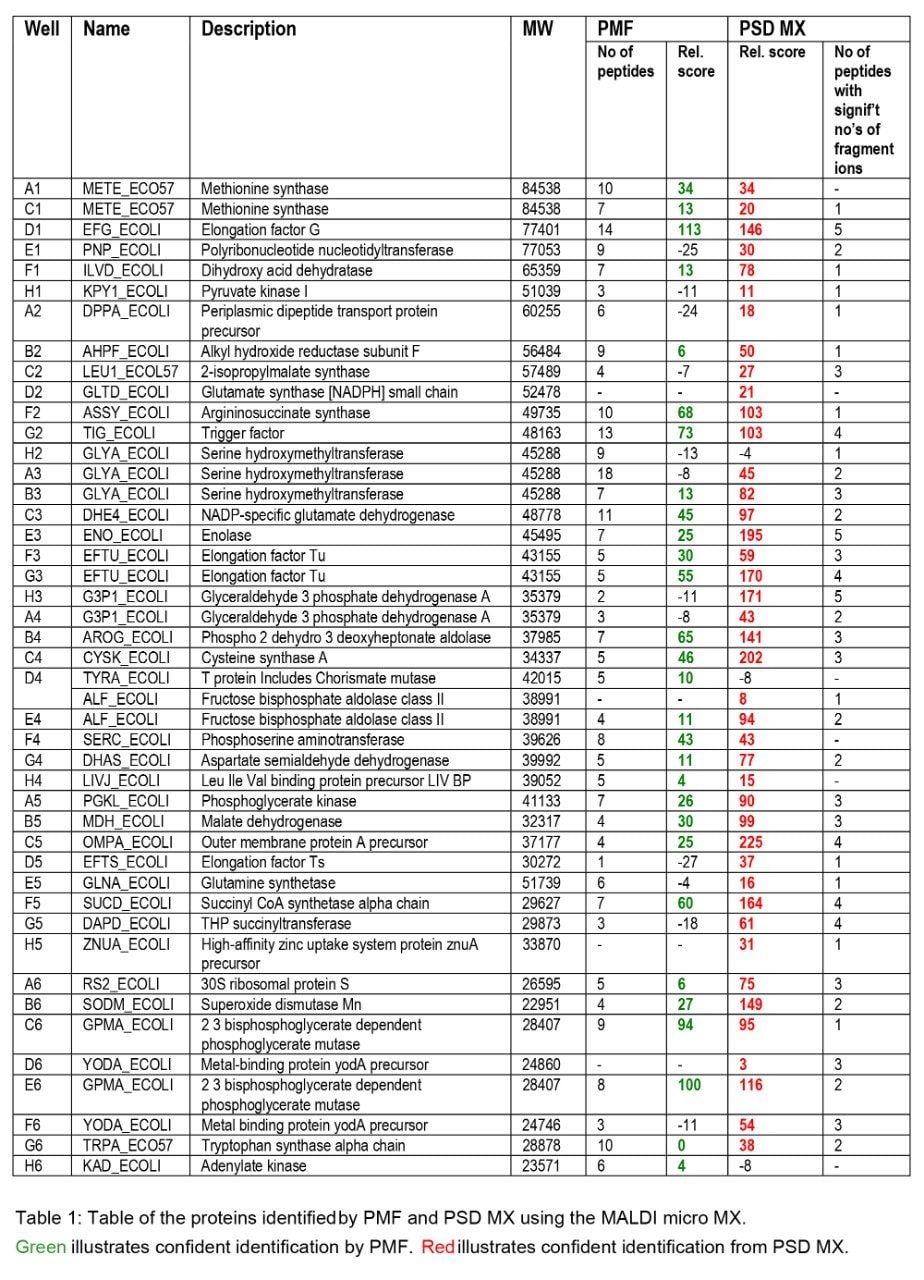
Databank search results obtained from the E. coli 2D gel samples are summarized in Table 1. Two different types of databank search were performed on the MS or PSD data obtained from each sample well. MS data were submitted for a peptide mass fingerprint search while PSD data were submitted using the fragment ion information. The search results from the fragment ion search were formatted as a “protein report”, described here as PSD MX. The two different types of score have a 95% confidence limit, which is governed by the search parameters used, the limit for PMF and PSD MX scores is a score of 64. To facilitate comparing different types of databank search/score a relative score was devised. The relative score was obtained by using the following equation:

Score relative= Score(indiv. Protein)- Score(95% confidence)

Therefore, the relative score can be calculated by subtracting the 95% confident protein identification level, (64 for both PMF and PSD MX) from the returned databank score for each individual protein.

In the case of tenuous or ambiguous protein identification a negative relative score will be produced, while positive relative scores suggest statistically significant, or unambiguous protein identification.

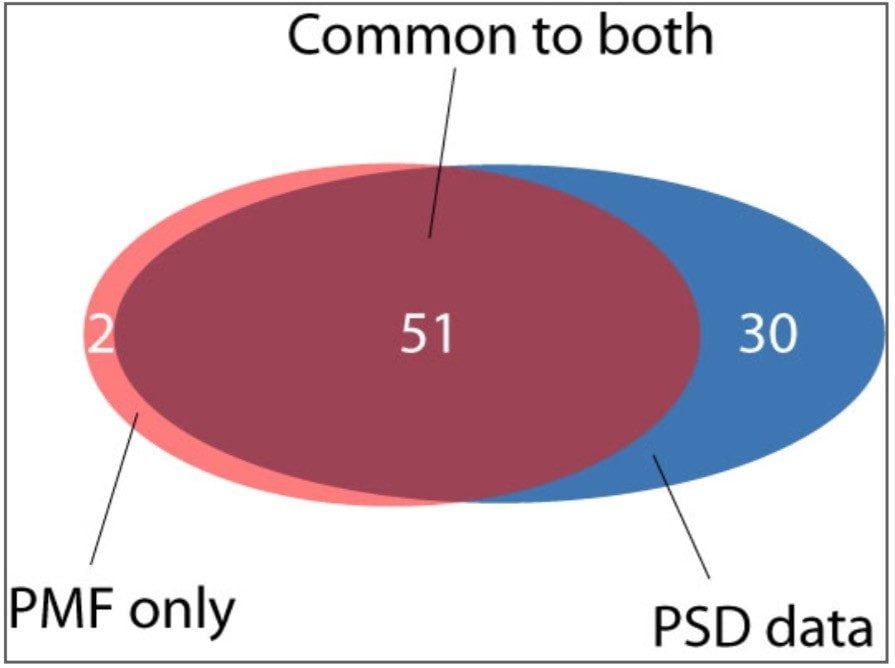
A closer examination of the resulting data indicates that using the traditional PMF approach 53 proteins were confidently identified from 96 sample wells (c.f. Table 1). It was possible to match two proteins to the MS data from well F10 using PMF. These search results represent successful protein identification from 54% of the samples. In our experience, this is a typical success rate for PMF protein identification. In contrast, databank searching of the PSD MX data, in combination with the PMF information, resulted in confident identification of 81 proteins, equivalent to a protein identification success rate of 82% from the samples analyzed. Of the 81 proteins identified, 30 proteins were only unambiguously identified when PSD MX data were considered. In addition, two proteins were found exclusively by using the PMF approach. A summary of the proteins identified by the different techniques used is illustrated graphically in Figure 1.

Figure 1. Diagram illustrating the number of proteins identified from the E. coli 2-D gel samples by PMF and PSD MX data. The total number of samples analyzed was 96. 

A typical example of PSD MX analysis resulting in successful protein identification PMF analyses may fail due to an insufficient number of tryptic peptides produced by the enzymatic process or due to the poor ionization of peptides in the mass spectrometer or a combination of these two factors. An example of this phenomenon is the mass spectrum shown in Figure 2, where only four intense peaks can be observed. Subsequent database searching of this information did not result in the unambiguous identification of a protein. However, a PSD MX experiment provided additional fragment ion information and, using this information in a databank search, it was possible to unambiguously identify the protein as Metal-binding protein YodA from E. coli. This identification was based on PSD fragment ion data from three peptides. The search result is shown in Figure 3.

Figure 2. The MALDI MS data obtained from MALDI target position F6. Databank searching of this information, via PMF, did not result in identification of a protein sequence. 
Figure 3. Result from the databank search of PSD MX data from MALDI target position F6. Shown inset are two matching PSD MX spectra annotated with the amino acid sequence from the databank. 

Conclusion

  • Peptide mass fingerprinting resulted in identification of 54% of the wells from 96 2D-gel separated E. coli samples
  • PSD MX analysis of the same samples increased the hit rate from 54% to 83%, resulting in the identification of 83 proteins in total
  • Three of the 2D gel spots analyzed were found to contain a mixture of two proteins; PSD MX was required to identify two of these mixtures
  • PMF and PSD MX were shown to be complementary techniques, which can be performed on the same mass spectrometer, MALDI micro MX

References

  1. Henzel, W. J.; Billeci, T. M.; Stults, J. T.; Wong, S. C.; Gimley, C.; Watanabe, C. Proceedings of the National Academy of Sciences; 1993, 90, 5011–5015.
  2. D. Kenny, J. Brown, M. Snel, Technical note: Multiplexed Post Source Decay (PSD MX) A Novel Technique Explained.

720001155, April 2005

Back To Top Back To Top