For research use only. Not for use in diagnostic procedures.
- Main
-
For research use only. Not for use in diagnostic procedures.
Courtney L. Walton, Yun Wang Alelyunas, Caityln Da Costa, Mark D. Wrona
Waters Corporation, United States
Published on September 17, 2026
For research use only. Not for use in diagnostic procedures.
A nine minute rapid liquid chromatography and mass spectrometry (LC-MS) analysis method for cell culture media (CCM)1 was transferred to the Xevo G3 QTof Mass Spectrometer. Amino acids were used to evaluate the method on the Xevo G3 QTof Mass Spectrometer. One of the differences in utilizing the Xevo G3 QTof Mass Spectrometer compared to the BioAccord™ LC-MS System for the cell culture media analysis is the change in the electrospray ionization (ESI) source, ion optic parameters, and transmission through the XS collision cell. Optimization of these parameters is necessitated to achieve the best intact analyte signal for small, labile molecules. Therefore, the ESI source, StepWave™ XS Ion Guide and XS collision cell parameters, were optimized to enhance the response for all amino acid molecular ions and provide the best transmission of labile amino acids and in turn reduce in-source fragmentation on the Xevo G3 QTof Mass Spectrometer.
An LC-MS method for monitoring cell culture media and metabolites was developed on a BioAccord high-resolution mass spectrometry (HRMS) Platform. The method monitors 220 compounds including amino acids, vitamins, and other small metabolites with an LC run time of nine minutes. This application note describes the detailed MS optimization for the adoption of the method on Xevo G3 QTof HRMS. The assay was first developed on the BioAccord HRMS System as a standard workflow given the BioAccord System is designed to be an easy-to-use HRMS that requires minimal tuning and optimization. In comparison, the Xevo G3 QTof Mass Spectrometer is an instrument that provides more flexibility in acquisition type, use of quadrupole for CID MS/MS, and better mass resolution. The addition of the quadrupole in the system provides better controlled and reproducible fragmentation via CID, especially for analytes of lower m/z. The higher resolution provided by the Xevo G3 QTof Mass Spectrometer may also help in elucidation of unknowns in media samples. The Xevo G3 QTof Mass Spectrometer also has a larger linear dynamic range for quantitation compared to the BioAccord System, which could reduce the number of dilutions needed to quantitate compounds at varying concentrations within cell culture media samples. These aspects are reasons some may choose to utilize the Xevo G3 QTof Mass Spectrometer for cell culture media analysis and the motivation to refine the method for the instrument.
Amino acids were chosen for the optimization studies as they are important for media analysis to ensure sufficient quantity for cell growth and protein production.2,3 The amino acids also cover a range of molecular weights, with some of the lower molecular weight compounds being prone to in-source fragmentation and reduced analyte transmission. Previous work on Xevo G3 QTof Mass Spectrometer has shown that small molecular weight and labile compounds necessitate optimization to provide the best retention of the intact molecular ion at the best sensitivity.4,5 Refinement of the instrument parameters is needed due to Xevo G3 QTof Mass Spectrometer having more ion optics and transmission regions within the instrument compared to the BioAccord System. These additional regions provide more opportunities for small molecules, especially glycine and alanine, to undergo fragmentation during the ionization process or during transmission. The focus of these experiments is to optimize the ESI source parameters, the ion optic transmission parameters, and the XS collision cell parameters to increase the response of the molecular ions and reduce in-source fragmentation of the labile amino acids. The optimizations are to provide the ability to utilize the cell culture media rapid nine-minute LC-MS method1 on the Xevo G3 QTof Mass Spectrometer for qualitative and quantitative results.
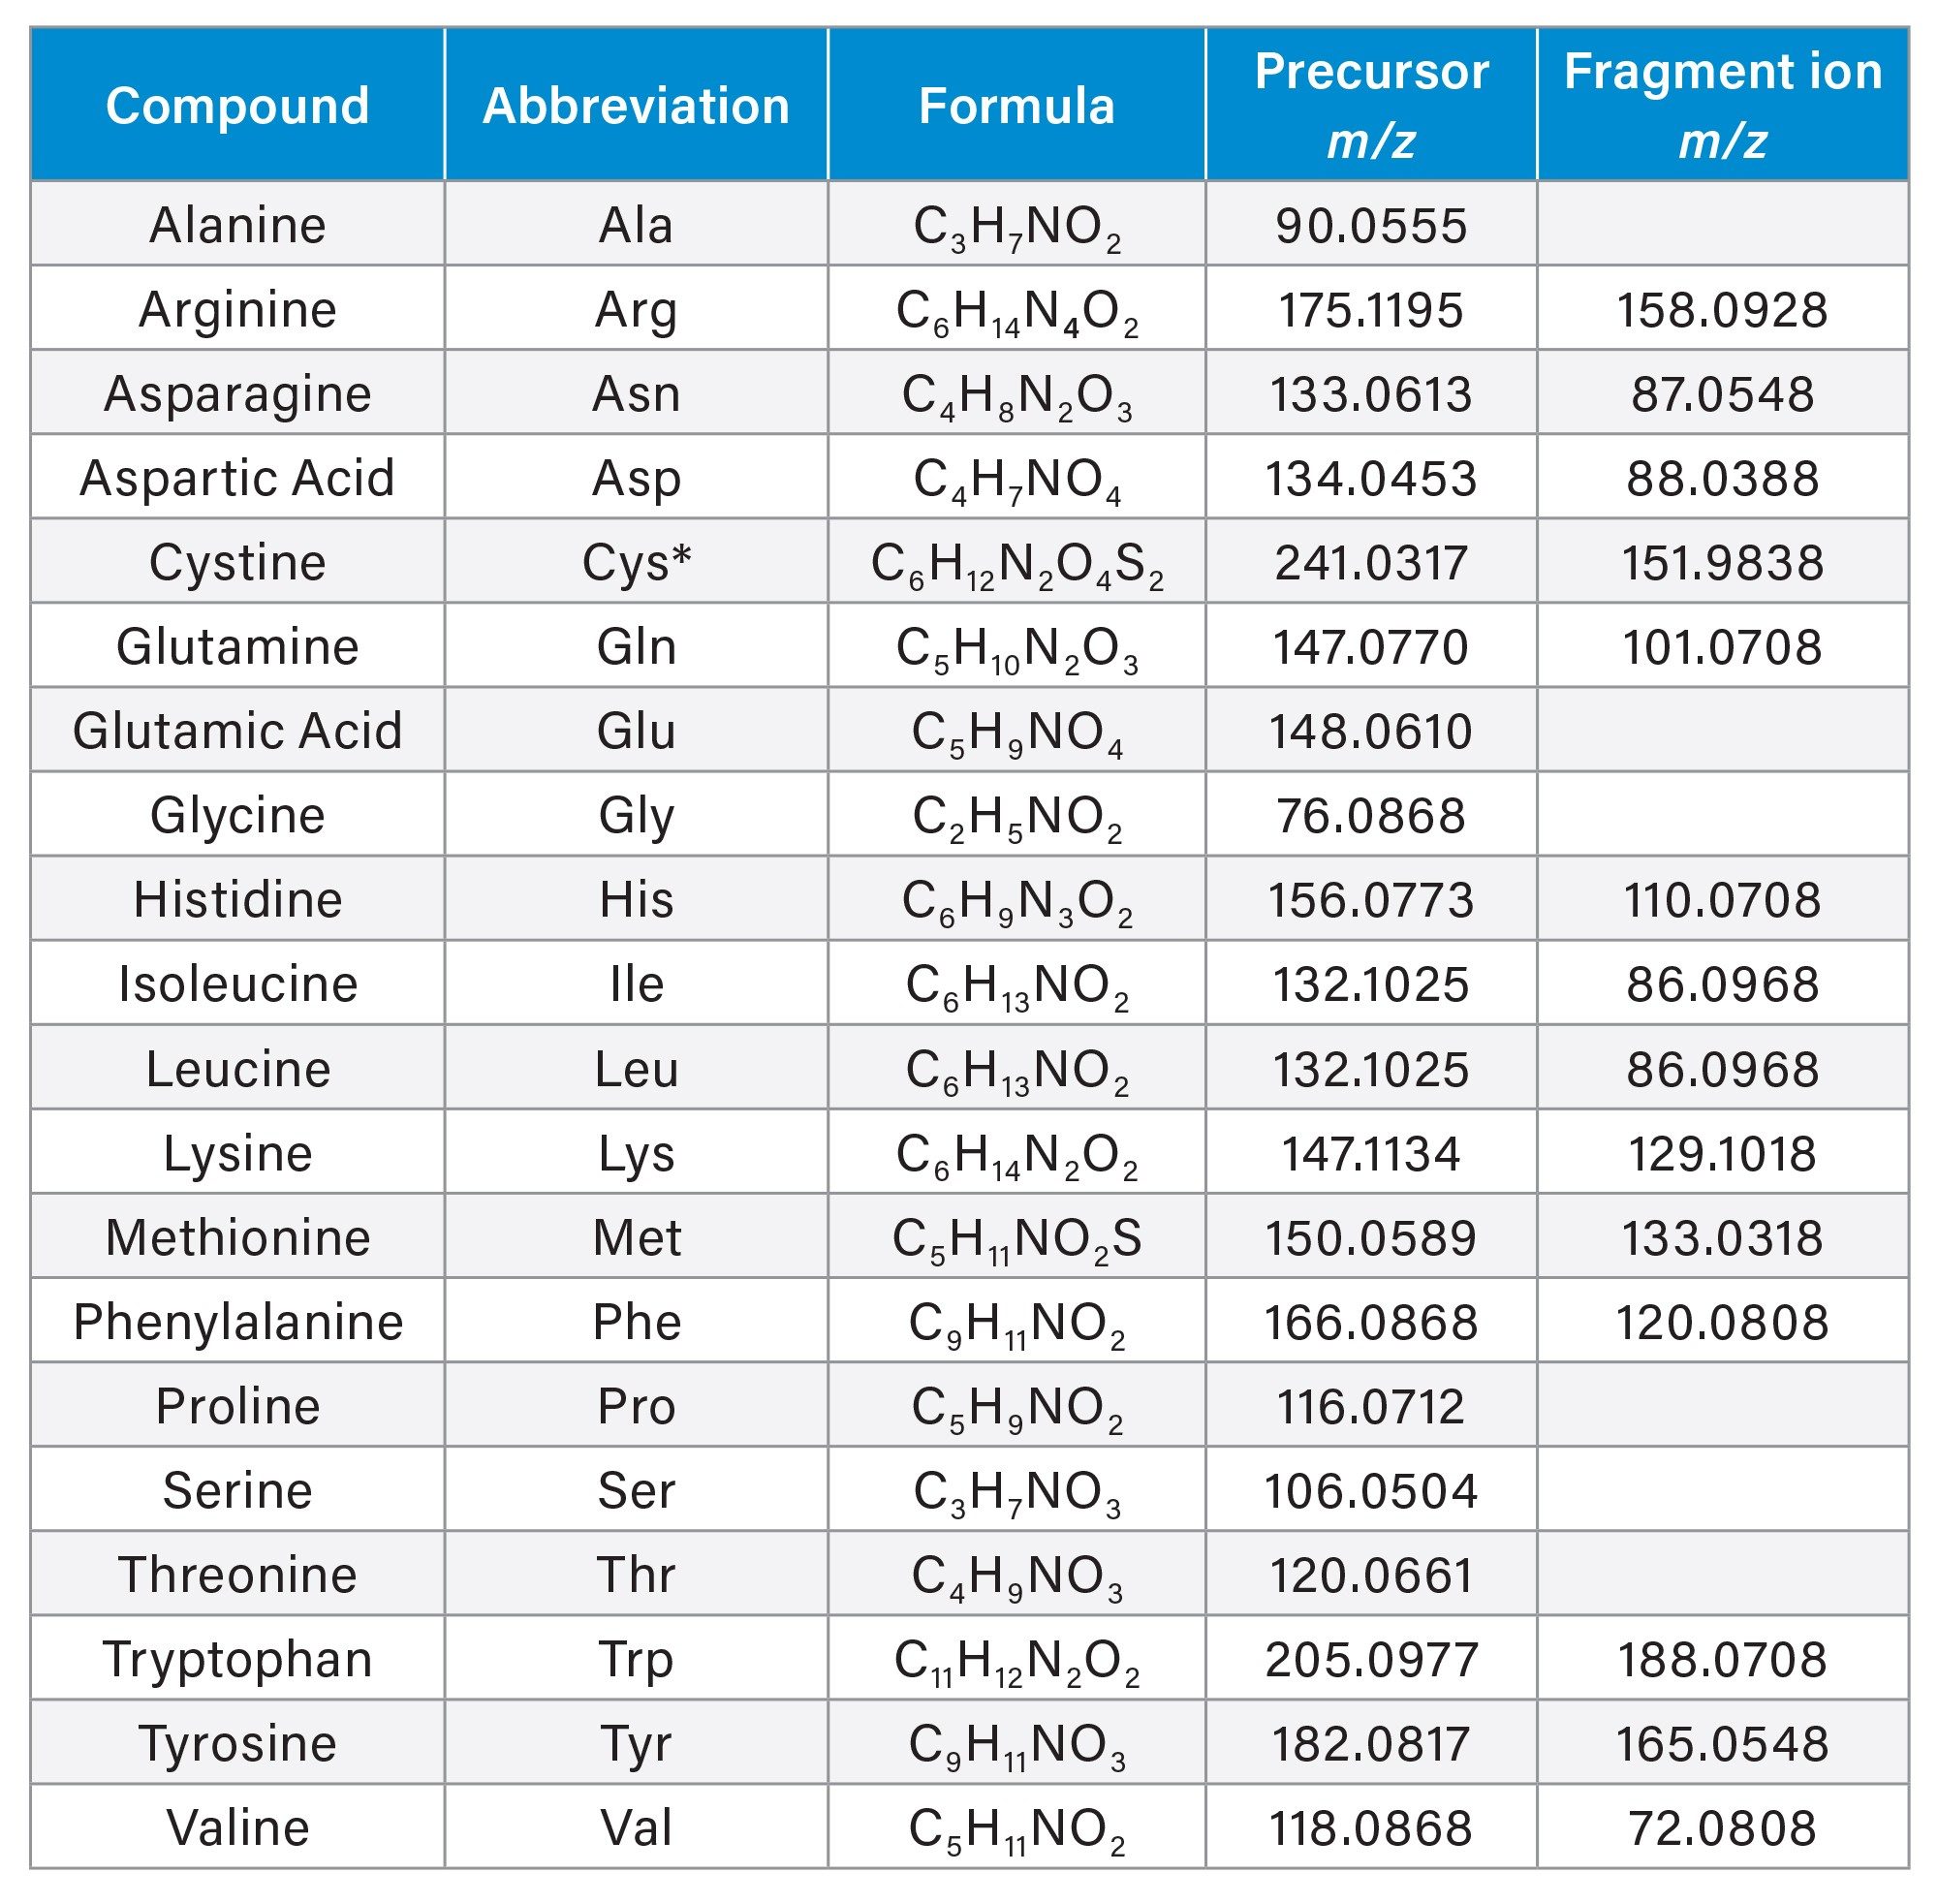
The Waters Cell Culture Standard Kit (p/n: 186009300), which contains the standard 20 amino acids (Table 1) plus six amino acid derivatives, was the sample used for all experiments. The stock solution was prepared at 500 μM using water containing 0.1% formic acid as the diluent. The stock was further diluted to 2.5 μM for optimization studies. Table 1 lists the 20 amino acids evaluated in these optimization studies including both the precursor and fragment ions. Only those amino acids with unique fragment ions at high abundance were used for fragment-to-precursor ion ratios and only one fragment per amino acid for simplification.
|
System: |
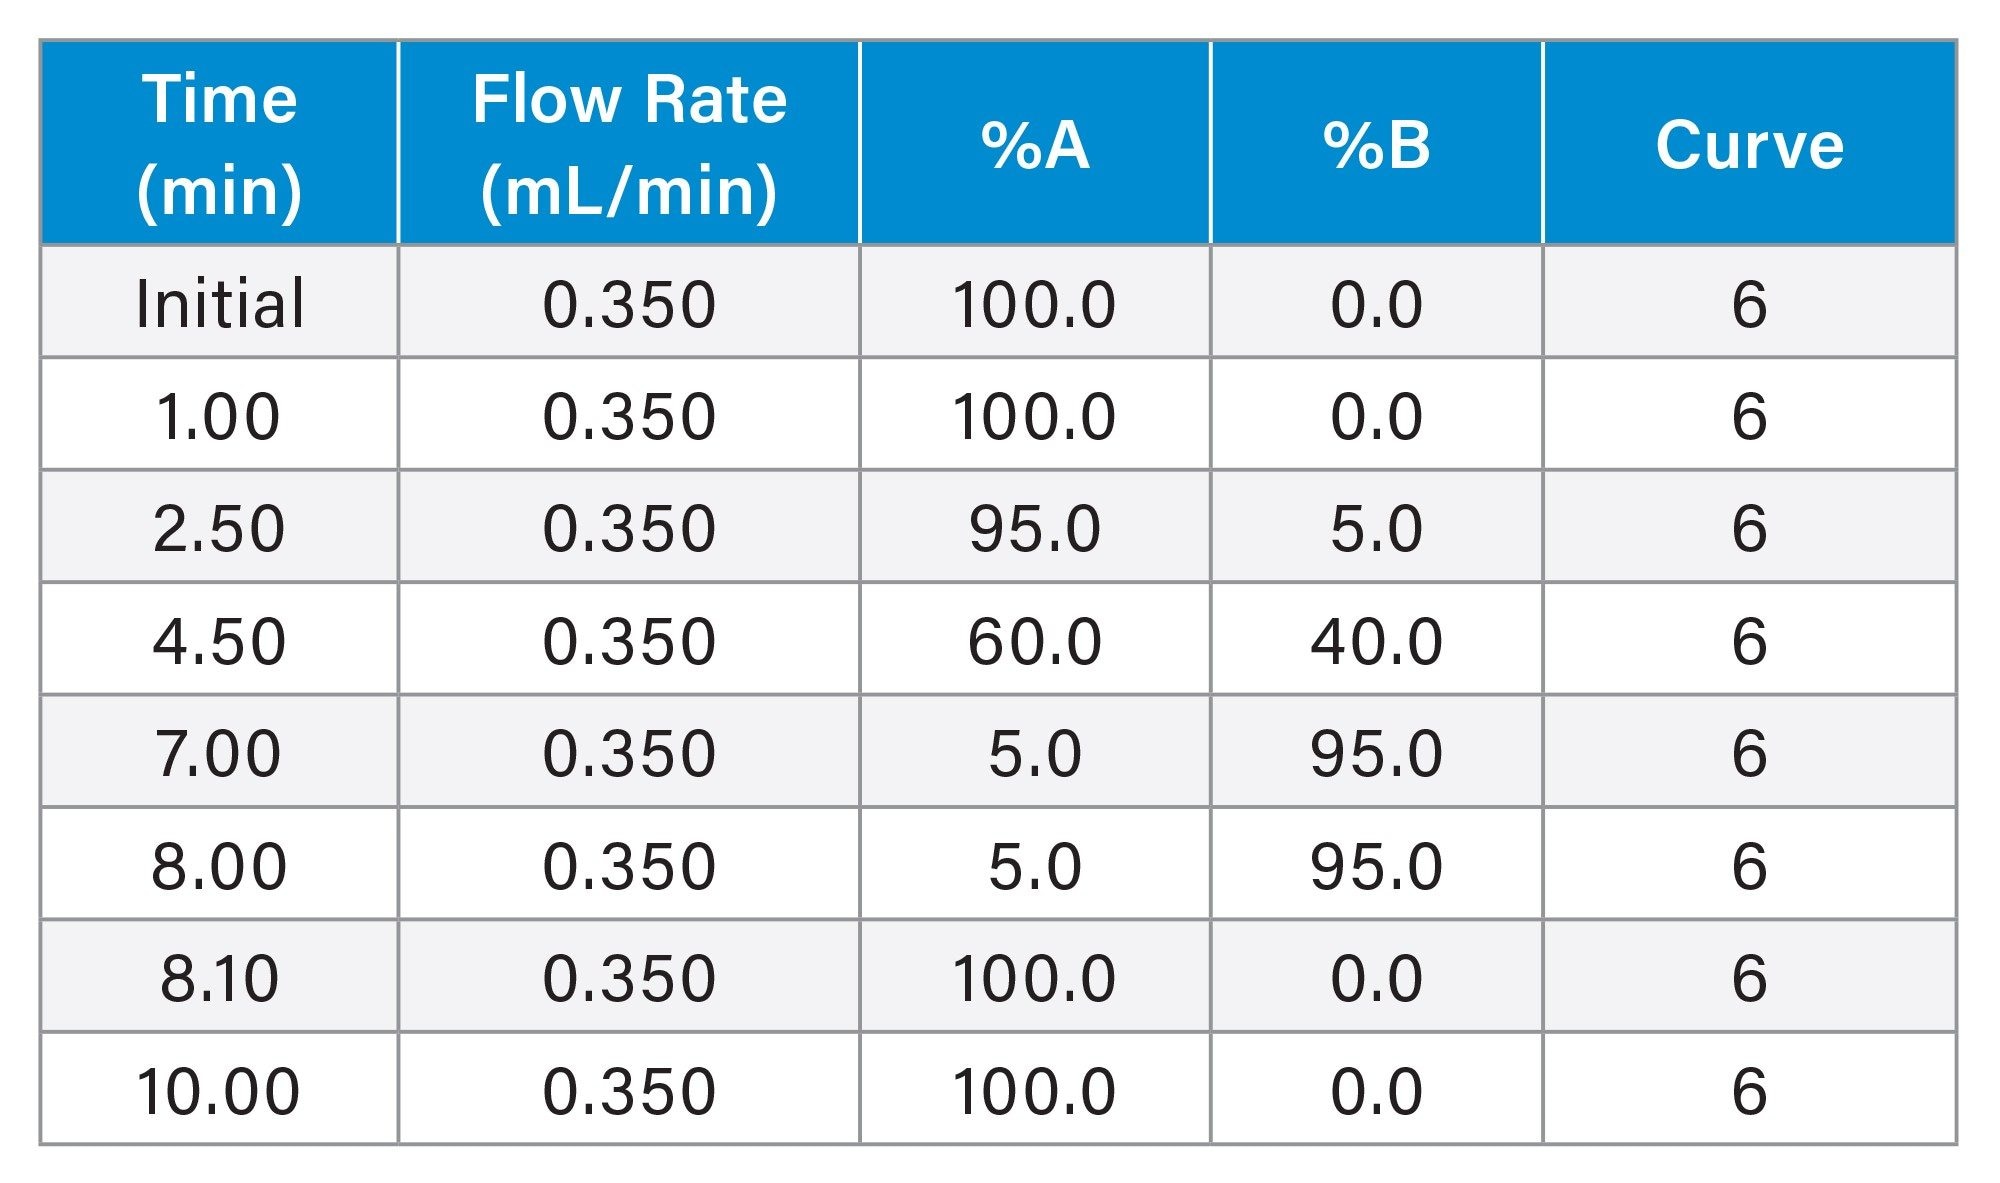
ACQUITY™ Premier Binary Solvent Manager (BSM) Liquid Chromatography System |
|
Vials: |
Waters Max Recovery Vials |
|
Column: |
ACQUITY Premier HSS T3 Column, 1.8 μm, 2.1 x 100 mm (p/n: 186009466) |
|
Column temperature: |
40 °C |
|
Sample temperature: |
6 °C |
|
Injection volume: |
2 µL |
|
Flow rate: |
0.35 mL/min |
|
Mobile phase A: |
0.1% formic acid in H2O |
|
Mobile phase B: |
0.1% formic acid in 10:90 IPA:ACN |
|
System: |
Xevo G3 QTof Mass Spectrometer |
|
Ionization mode: |
ESI+ |
|
Mass range: |
50–800 m/z |
|
Acquisition rate: |
5 spectra per second (0.20 s) |
|
Lock mass: |
Leucine enkephalin |
|
Acquisition mode: |
MSe |
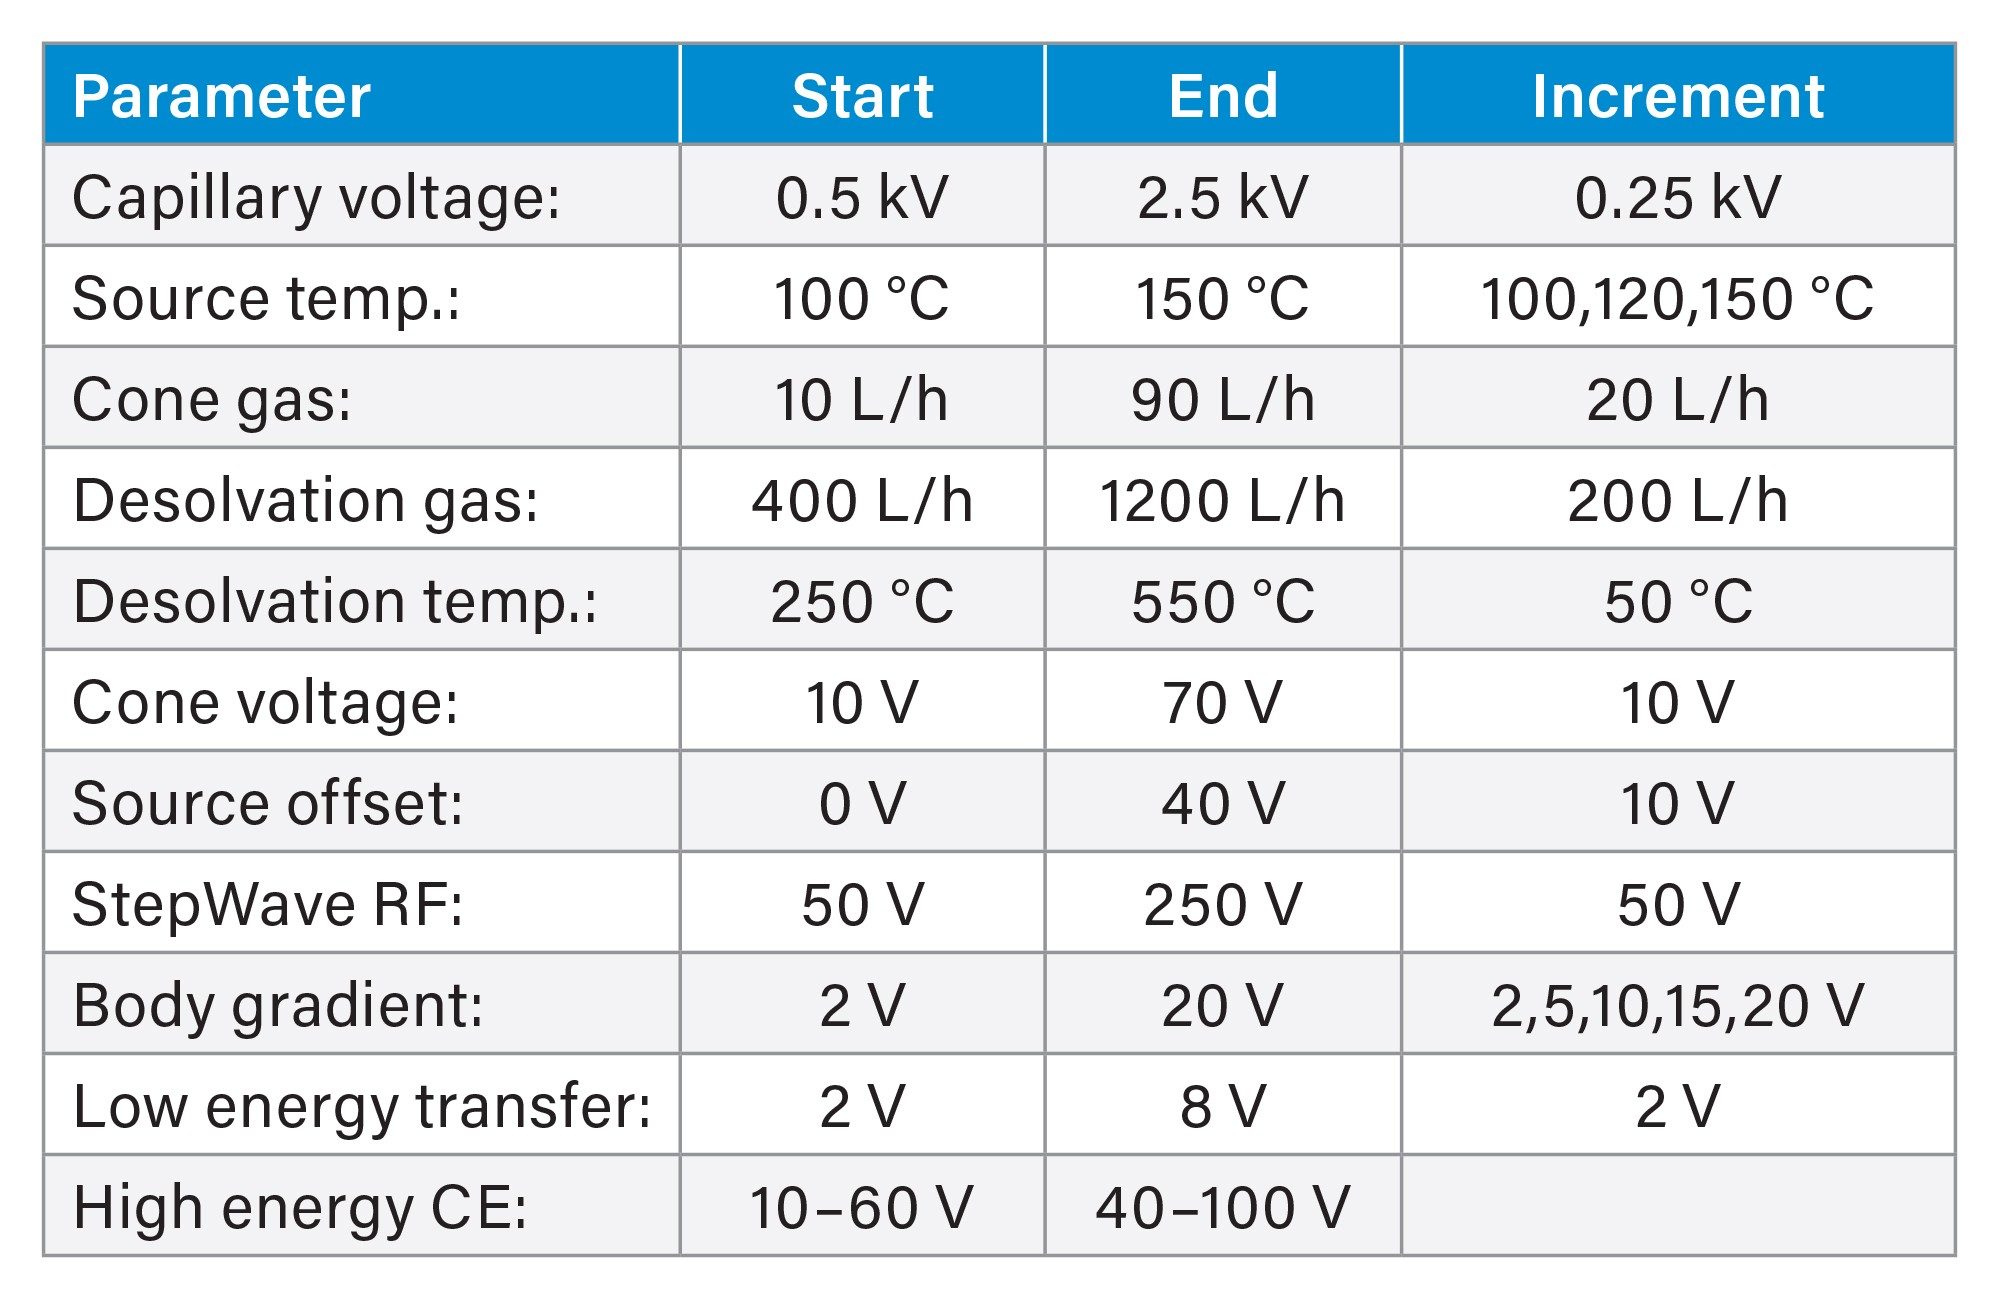
Eleven source and transmission parameters were optimized to increase response of the intact molecular ion of labile analytes and reduce the fragment ion response. Table 3 shows the range for each parameter and at what increments the parameters were evaluated.
Data acquisition was performed with waters_connect™ Software and data processing was done within the UNIFI™ Application (version 3.6.0.21). Further data analysis was accomplished with Microsoft Excel.
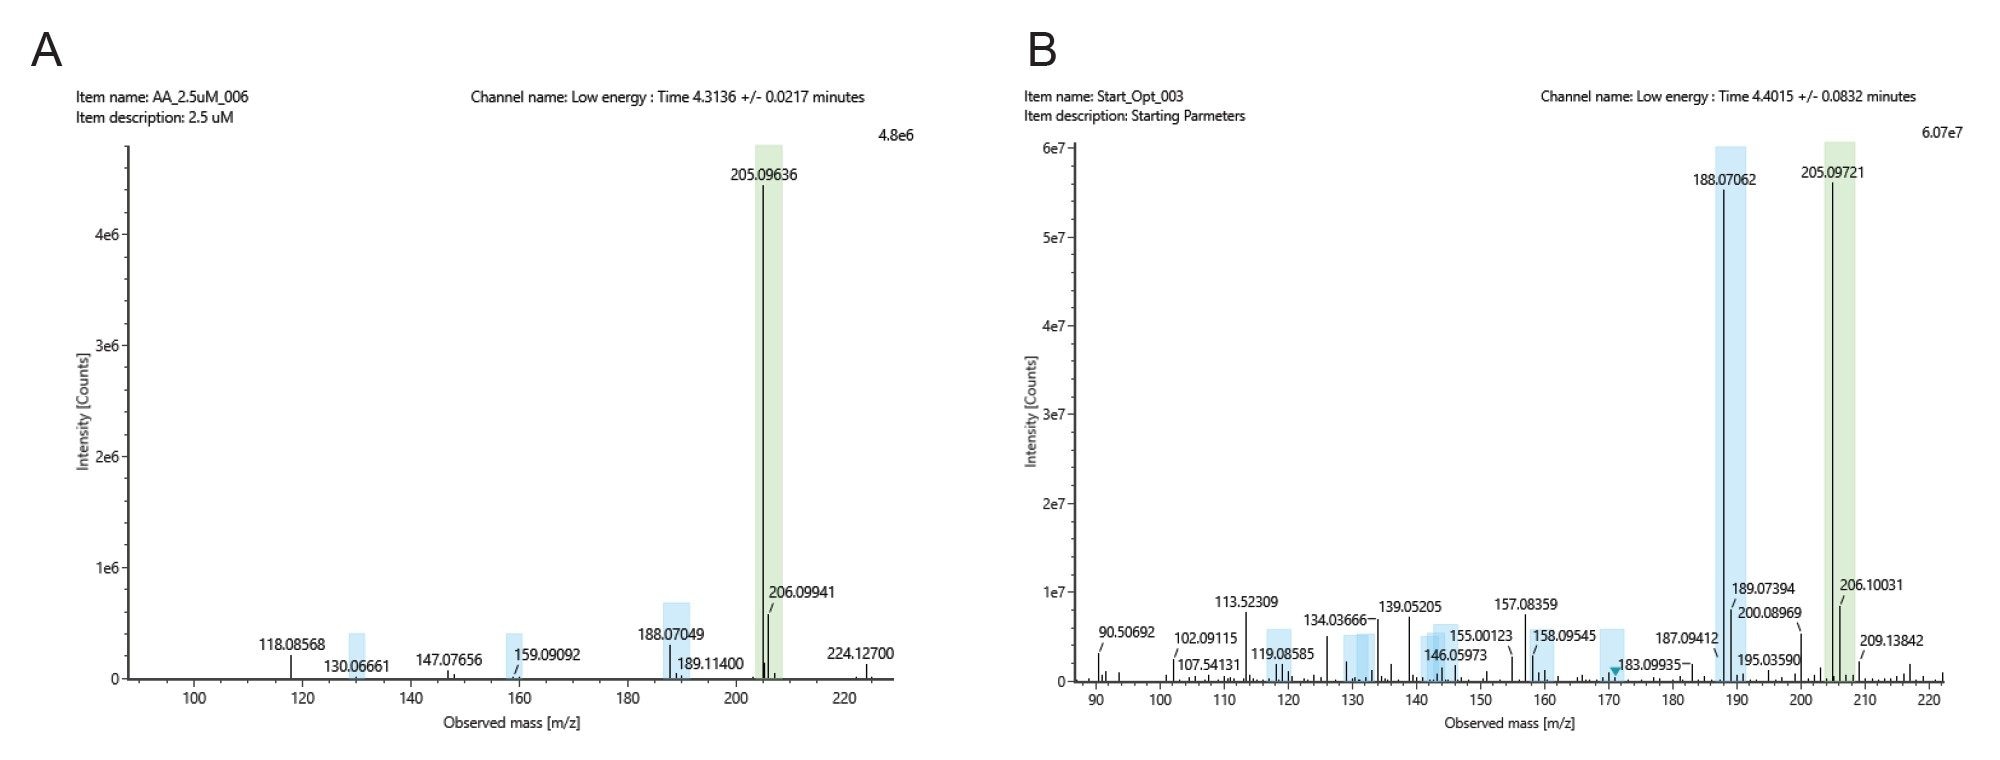
One challenge in the analysis of cell culture media is that media often contains many compounds with diverse chemical properties. Therefore, ionization and ion transfer parameters must be optimal for both stable and labile analytes. When the cell culture media LC-MS method was first transferred to the Xevo G3 QTof Mass Spectrometer, more fragmentation was observed in the low energy spectra, indicating the need for better transmission of intact analytes. The in-source fragmentation is demonstrated in Figure 1 with tryptophan as the example of amino acid. Figure 1A shows the extracted ion chromatogram (XIC) for tryptophan in the cell culture media LC-MS method on the BioAccord System. The main fragment ion of m/z 188.07 is 6.5% of the precursor ion (m/z 205.09) of tryptophan (Figure 1A), which indicates that most of the analyte reaches the detector as the intact analyte on the BioAccord System. In comparison when analyzed on the Xevo G3 QTof Mass Spectrometer at initial small molecule parameters, the main fragment ion (m/z 188.07) response is 99% of the precursor ion (m/z 205.09) response, making them almost 1:1 ratio (Figure 1B). This increase of fragment ion response in the low energy spectra occurred for all the amino acids when the method was directly transferred to the Xevo G3 QTof Mass Spectrometer without any optimization. While fragment ion response was increased due to the greater sensitivity of the Xevo G3 QTof Mass Spectrometer, overall response of the intact analyte was greater than on the BioAccord System. These results indicated the necessity of full optimization to increase signal and transmission for the small, labile amino acids.
The compound class of amino acids was utilized for optimization studies as it includes small, labile Gly and Ala and larger more stable Phe, Trp, and Tyr. For comparison, all precursor ion responses were normalized to the highest response within the parameter range to scale all analytes on the same axis. Due to their similar structure and low m/z, many amino acids will have common fragment ions and many of the amino acids are not chromatographically separated with this method. Therefore, only unique fragment ions were used for fragment-to-precursor ion response ratios. 14 of the amino acids met this criterion (Table 1). The fragment-to-precursor ion response ratio was calculated using equation 1:

The objective of optimizing the electrospray ionization source parameters was to improve the overall ion signal, particularly for the smallest amino acids, including Gly and Ala, and reduce in-source fragmentation of the same labile species while maintaining (or enhancing) precursor ion signal for the remainder of the amino acids. Figure 2A shows the change in normalized ion signal for the precursor ion of each amino acid across the range for each of the six ESI source parameters. Figure 2B depicts the same conditions for the fragment-to-precursor ratio calculated via equation 1.
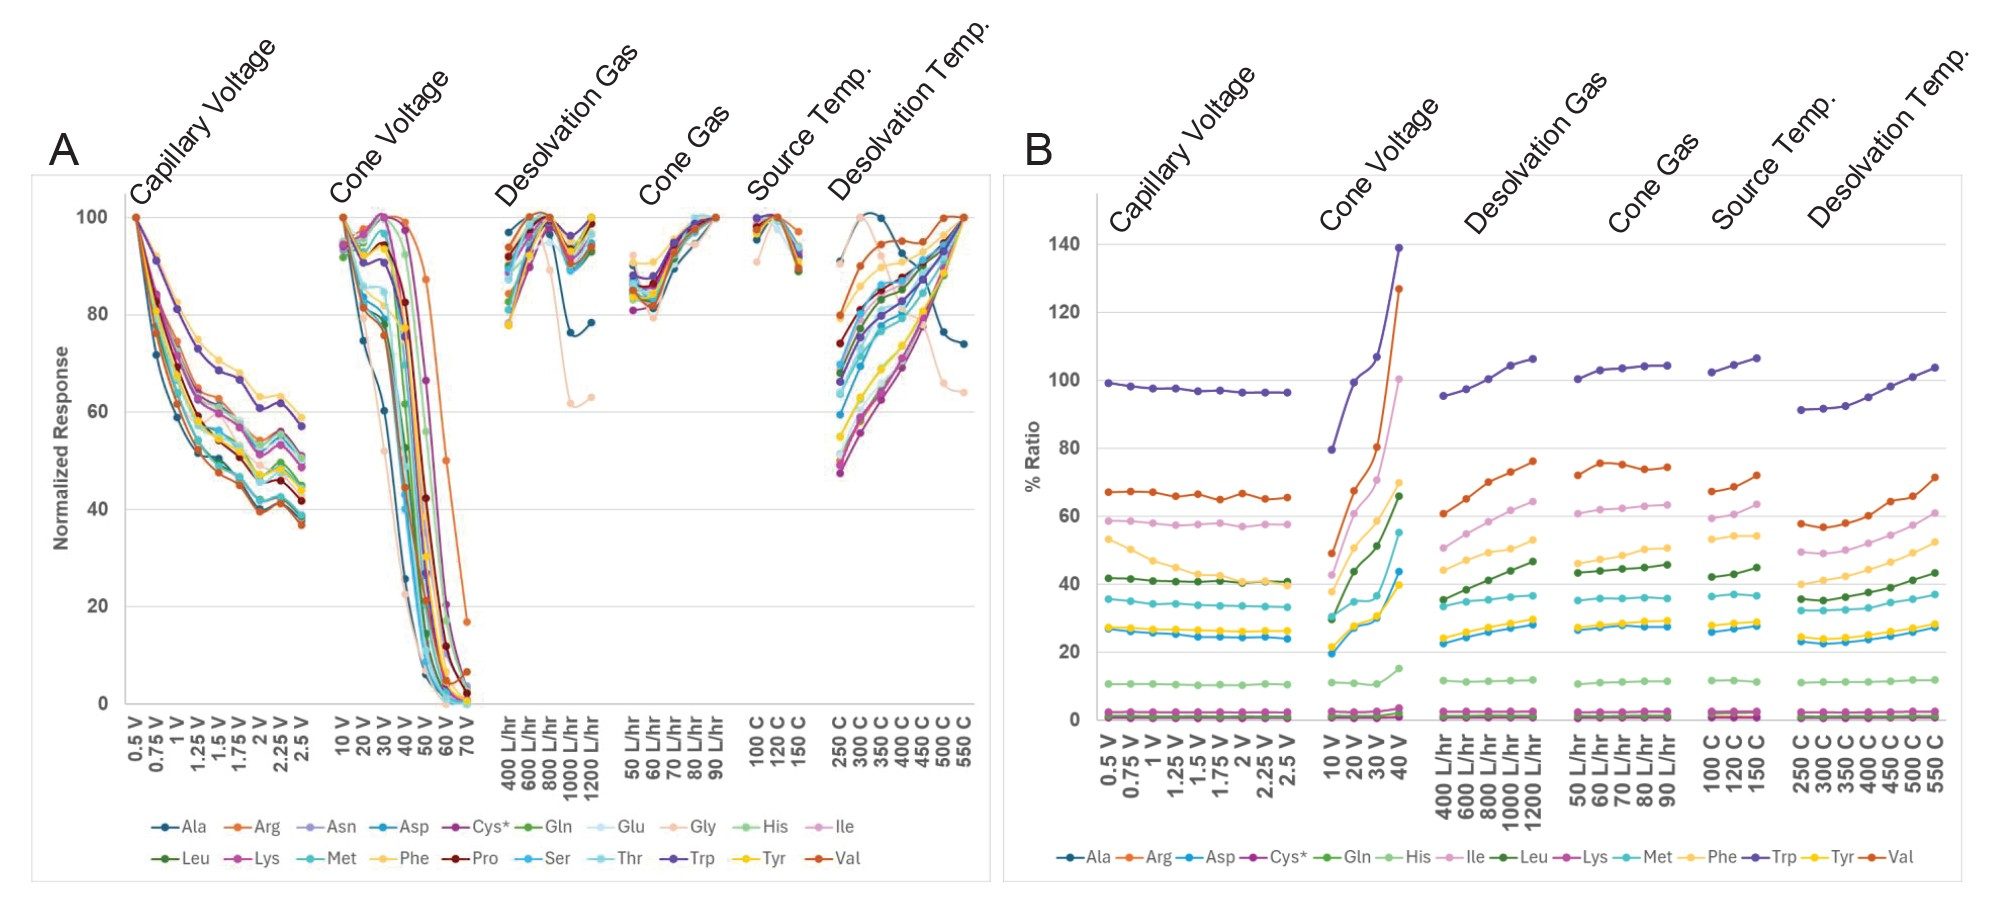
All amino acids follow the same trend with capillary voltage. Given the high flow rate of 0.350 μL/min, the best signal intensity for the precursor ions was at a capillary voltage of 0.5 kV. The capillary voltage had little effect on the fragment-to-precursor response ratio as the ratio remained consistent across the capillary voltage range within ±3% for most of the amino acids monitored.
Cone voltage had a direct impact on both intact precursor ion response and fragmentation. Cone voltage was monitored at 10V increments from 10–70 V. The majority of amino acids had the best precursor ion signal at a setting of 10V. For the six amino acids that were better optimized at 30V, their signal was still observed above 95% at the 10V setting. The most labile precursor ions of Gly and Ala were shown to quickly decrease in signal with increased cone voltage. These most labile analytes lost ~20% of the precursor signal with each 10V increase. As expected with increased cone voltage, the fragment-to-precursor ion response ratio increased at each interval with significant increase in fragment ion response occurring above 40V. The 50–70V range was excluded from the fragment-to-precursor ratio (Figure 2B) to prevent a skewed y-axis due to the fragment ions response being 100–8000% higher than the precursor ions. The setting of 10V was decided upon based on these results to maintain the best transmission and high intact analyte response for all amino acids.
Desolvation and cone gas can both play a role in the desolvation of droplets and transfer of ions into the mass spectrometer. Because of this role, both gases need to be optimized. For the optimization range of 400–1200 L/hr cone gas, only Gly and Ala, the smallest amino acids, preferred a lower desolvation gas flow of 600 L/hr. All other amino acids were optimized at a rate ≥800 L/hr. The desolvation gas had some impact on fragmentation with an increasing trend over the entire 400–1200 L/hr range. A desolvation gas rate of 800 L/hr was chosen as the optimal value which gave all analytes precursor signal ≥89%. The cone gas has the highest signal for all precursor ions at 90 L/hr and did not affect fragment ion response outside of normal variance (<5%).
Lastly, temperature of the desolvation gas and source can also impart energy which can result in more fragment ions prior to transmission into the instrument. As expected, Gly and Ala preferred a lower temperature of 300 °C. All other amino acids were optimized at the higher temperature of 550 °C. At the condition of 550 °C, Gly and Ala were 64% and 74% of their precursor signal, respectively. With higher temperatures more energy can be imparted to the molecules which increases the likelihood of in-source fragmentation as observed with the increased fragment-to-precursor ratio over the 250–550 °C range. This is a key parameter where labile and stable analytes will not be optimal at the same setting. A temperature of 450 °C was chosen as all analytes have ≥79% of their precursor ion signal at that condition. Source temperature played a lesser role as all analytes were above 88% of their precursor ion across the temperature range of 100–150 °C. The parameter was set at 120 °C as it was optimal for the majority of amino acids.
While the StepWave XS Ion Guide has shown improvement in transmission of labile species compared to previous ion optics, further improvement is still necessitated to increase transmission of the precursor ions and reduce fragmentation within the StepWave XS Ion Guide.5 The role of each of the three StepWave XS Ion Guide parameters has on the precursor ion response and fragmentation was demonstrated. Figure 3 shows the effect of StepWave Ion Guide RF voltage, body gradient voltage, and source offset on the amino acid precursor ions and the fragment-to-precursor ion response ratio.
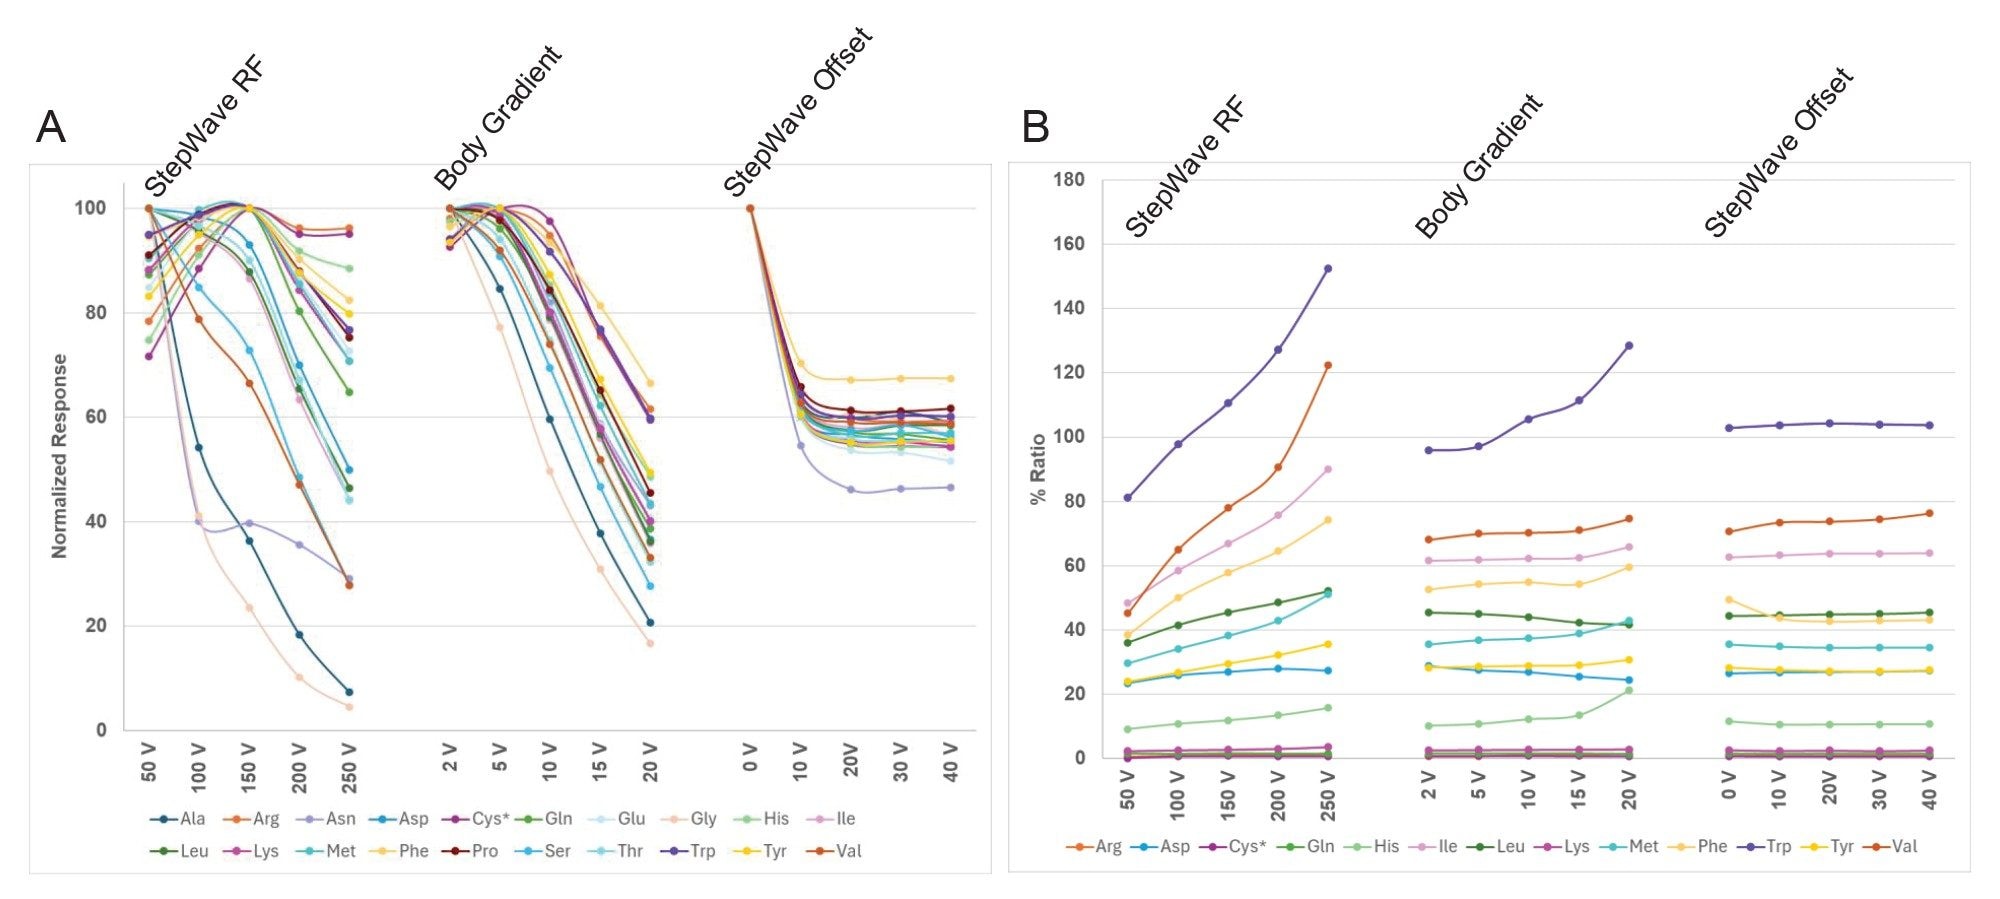
The StepWave XS Ion Guide RF voltage had the largest influence on the amino acids. Nine of the amino acids had the highest response at a StepWave XS Ion Guide RF setting of 50V. These nine amino acids are all under m/z 135 and include the most easily fragmented amino acids. The only exception was proline which is under m/z 135 but contains a ringed side group which makes it more stable. The larger amino acids showed an optimized StepWave XS Ion Guide RF value at 150V. While most amino acids were optimized at 150V, the most fragile amino acids (Gly and Ala) show a loss of intact analyte signal >65% at that setting. All amino acids followed the same trend in that fragment ion response increased up to two-fold over the StepWave XS Ion Guide RF range. These results show that it is difficult to choose an optimized value for StepWave XS Ion Guide RF voltage without compromising for both labile small amino acid and the more stable amino acids. At a setting of 50V, all amino acids were >70% precursor ion signal. Therefore, 50V was chosen as the setting for the StepWave XS Ion Guide RF to enhance the signal for the smallest amino acids and reduce fragmentation of all analytes.
Similar to the StepWave XS Ion Guide RF, the body gradient voltage had two optimal settings dependent on the amino acids. The smallest and most labile amino acids were optimized at the lowest voltage of 2V. The larger, stable amino acids had an optimal at a higher body gradient of 5V. The fragment-to-precursor ratio had minimal variance of <2% at both settings and increased more above 10V. As such, 2V was designated as the optimal setting for the body gradient as it provided the best signal intensity for most precursor ions. The source had the highest precursor ion signals when no voltage (0V) was applied.
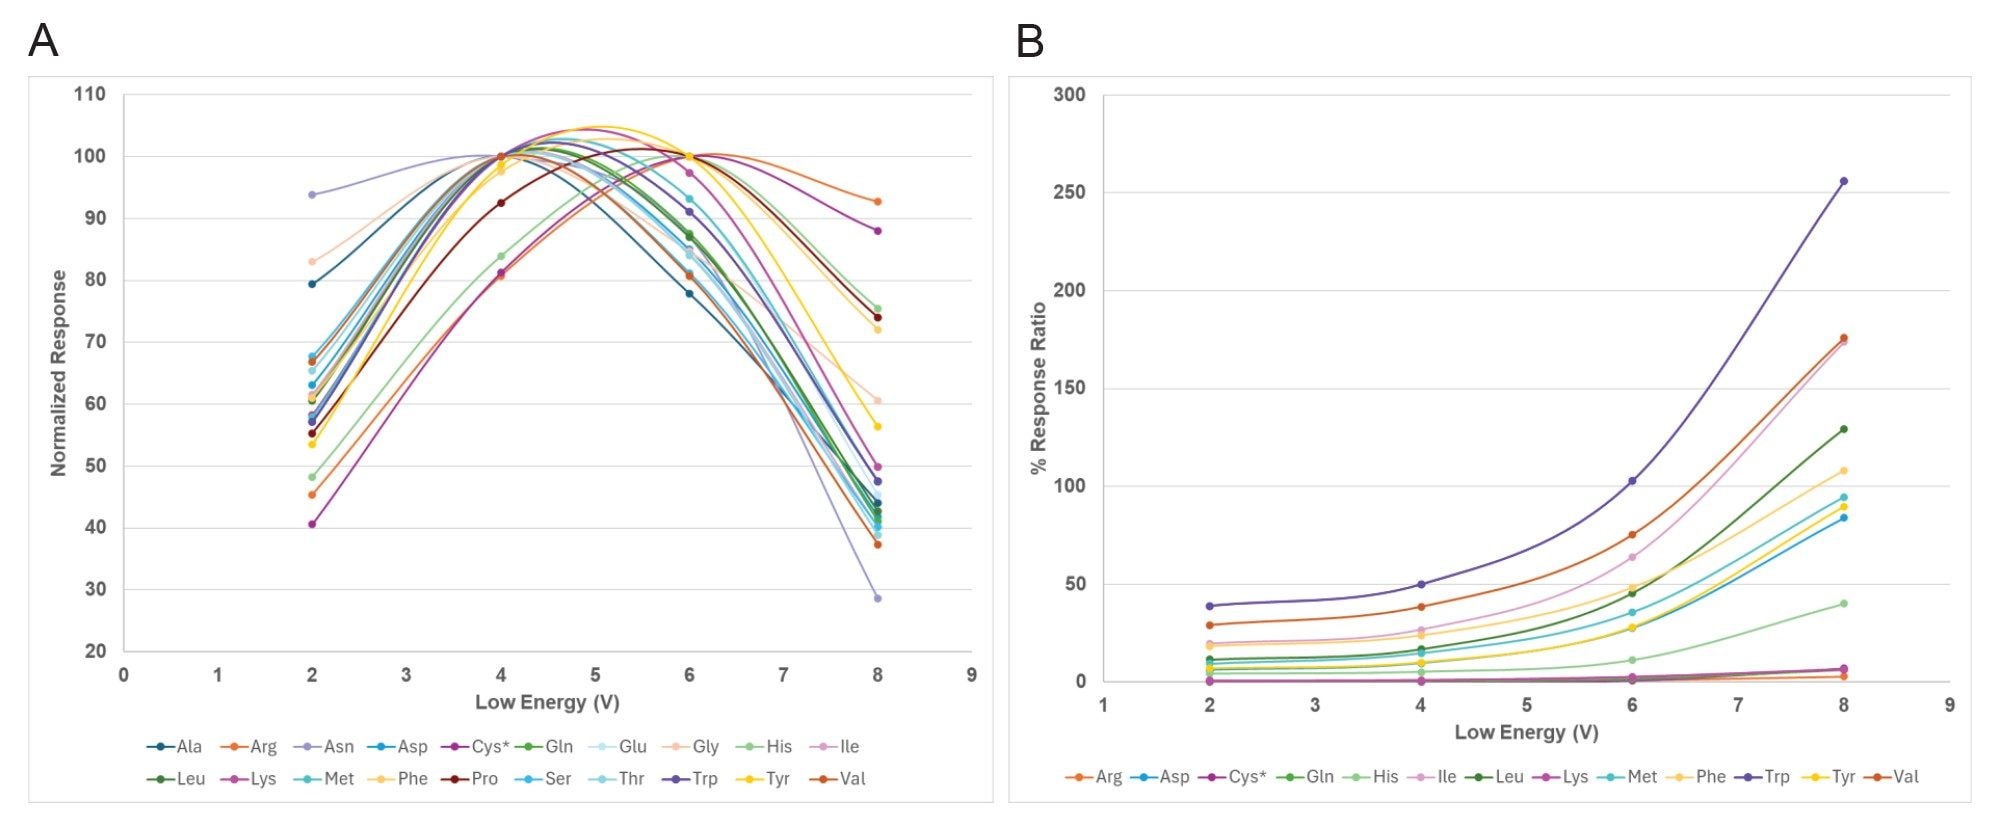
The XS collision cell has a set default value of 6V for transfer of ions through the cell. Figure 4 shows the effect of the voltage used for transfer of ions through the collision cell. The default value of 6V tends to favor the larger amino acids resulting in a better precursor ion response (Figure 4A). Figure 4B shows the fragment-to-precursor ion ratio with a trend of increased fragment ion response with increased voltage. The value of 6V shows significant fragmentation. The smaller amino acids including Gly and Ala showed an optimized precursor ion response at a voltage of 4V. The setting of 4V has an ion response of at least 80% for all amino acid precursor ions and was therefore set as optimal as it also reduced response of fragment ions.
The second parameter for the XS collision cell is the energy used for high energy scans or MS/MS. The voltage used for CID fragmentation was monitored to get the best overall fragment ion response, as the fragmentation spectra is used for structural confirmation or elucidation. For optimization of high energy, four ramps ranging from 10–40 V as the starting setting and 60–100 V for ending setting were run. The main fragment ions of amino acids were observed at all four ranges. The beginning setting of 10 V is sufficient to induce fragmentation as 6 V and 8 V already showed increased fragmentation in the low energy scans. By monitoring the main fragment ions from Table 1 the highest response was observed at the 10–60 V range. All higher ranges resulted in decreased response of the fragment ions. Therefore, the setting of 10–60 V for the high energy was sufficient to achieve fragmentation of the amino acids for structural confirmation.
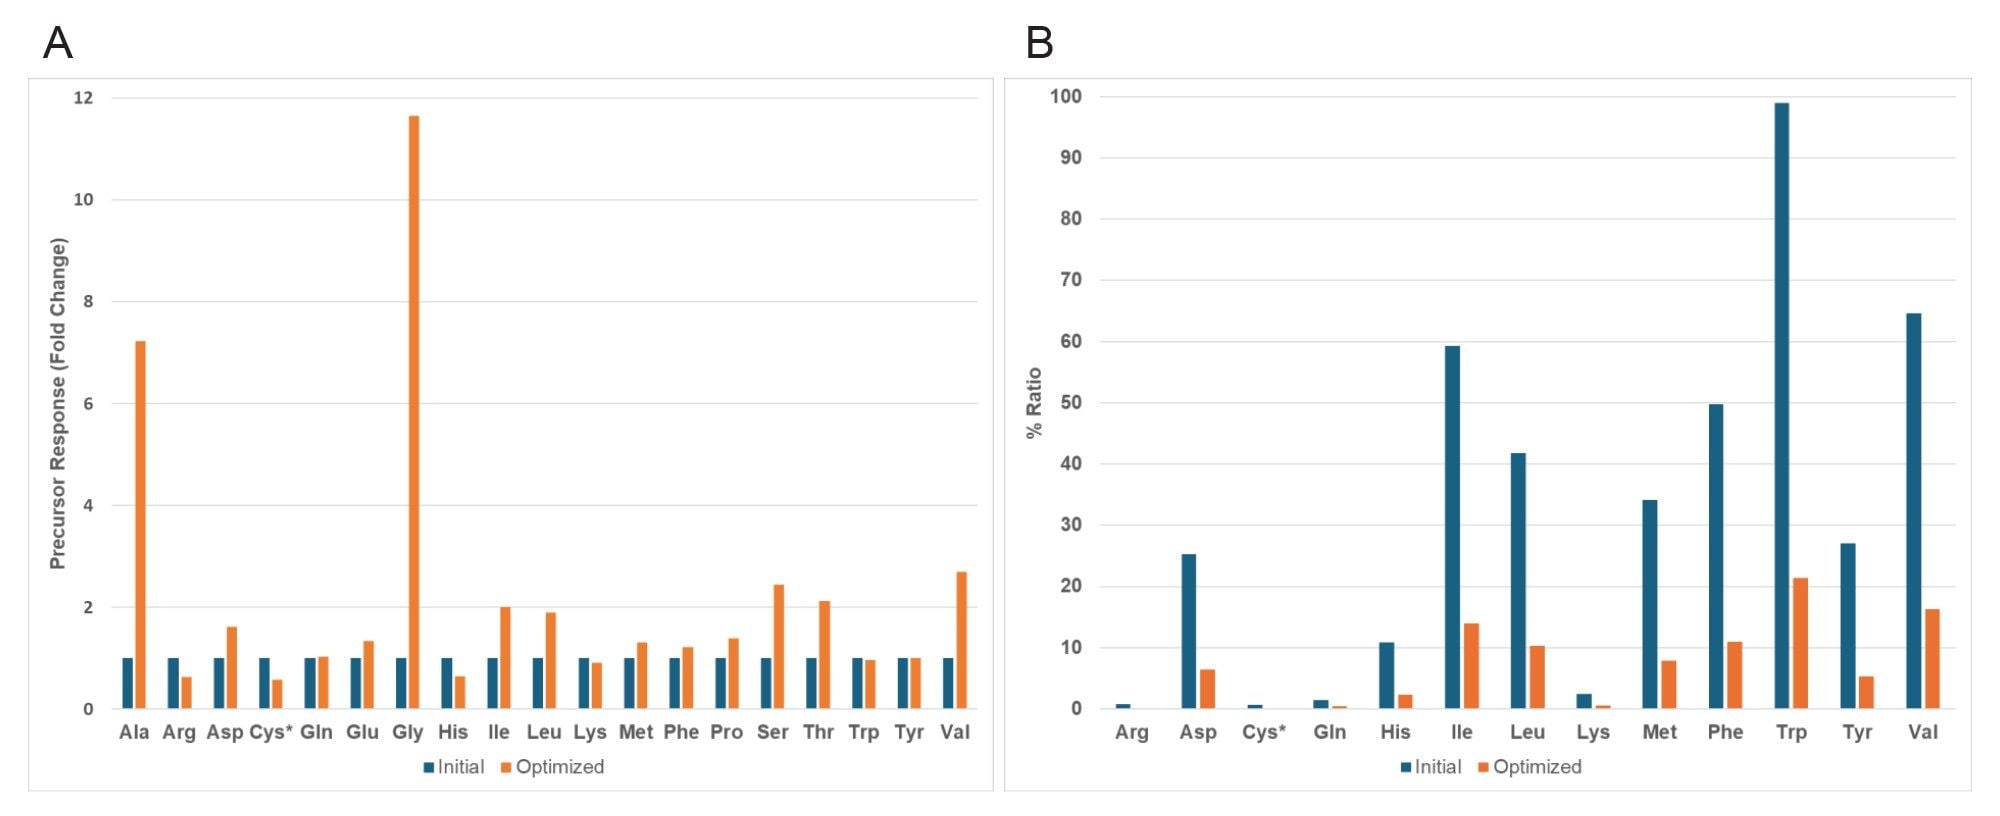
After the best conditions were established for each of the source and transmission parameters (Table 4), amino acid ion response obtained using optimized parameters were compared with the initial settings. Figure 5A shows the fold change of the precursor ions response, while 3B shows the fragment-to-precursor ratio at initial and optimized settings for the 2.5 μM sample.
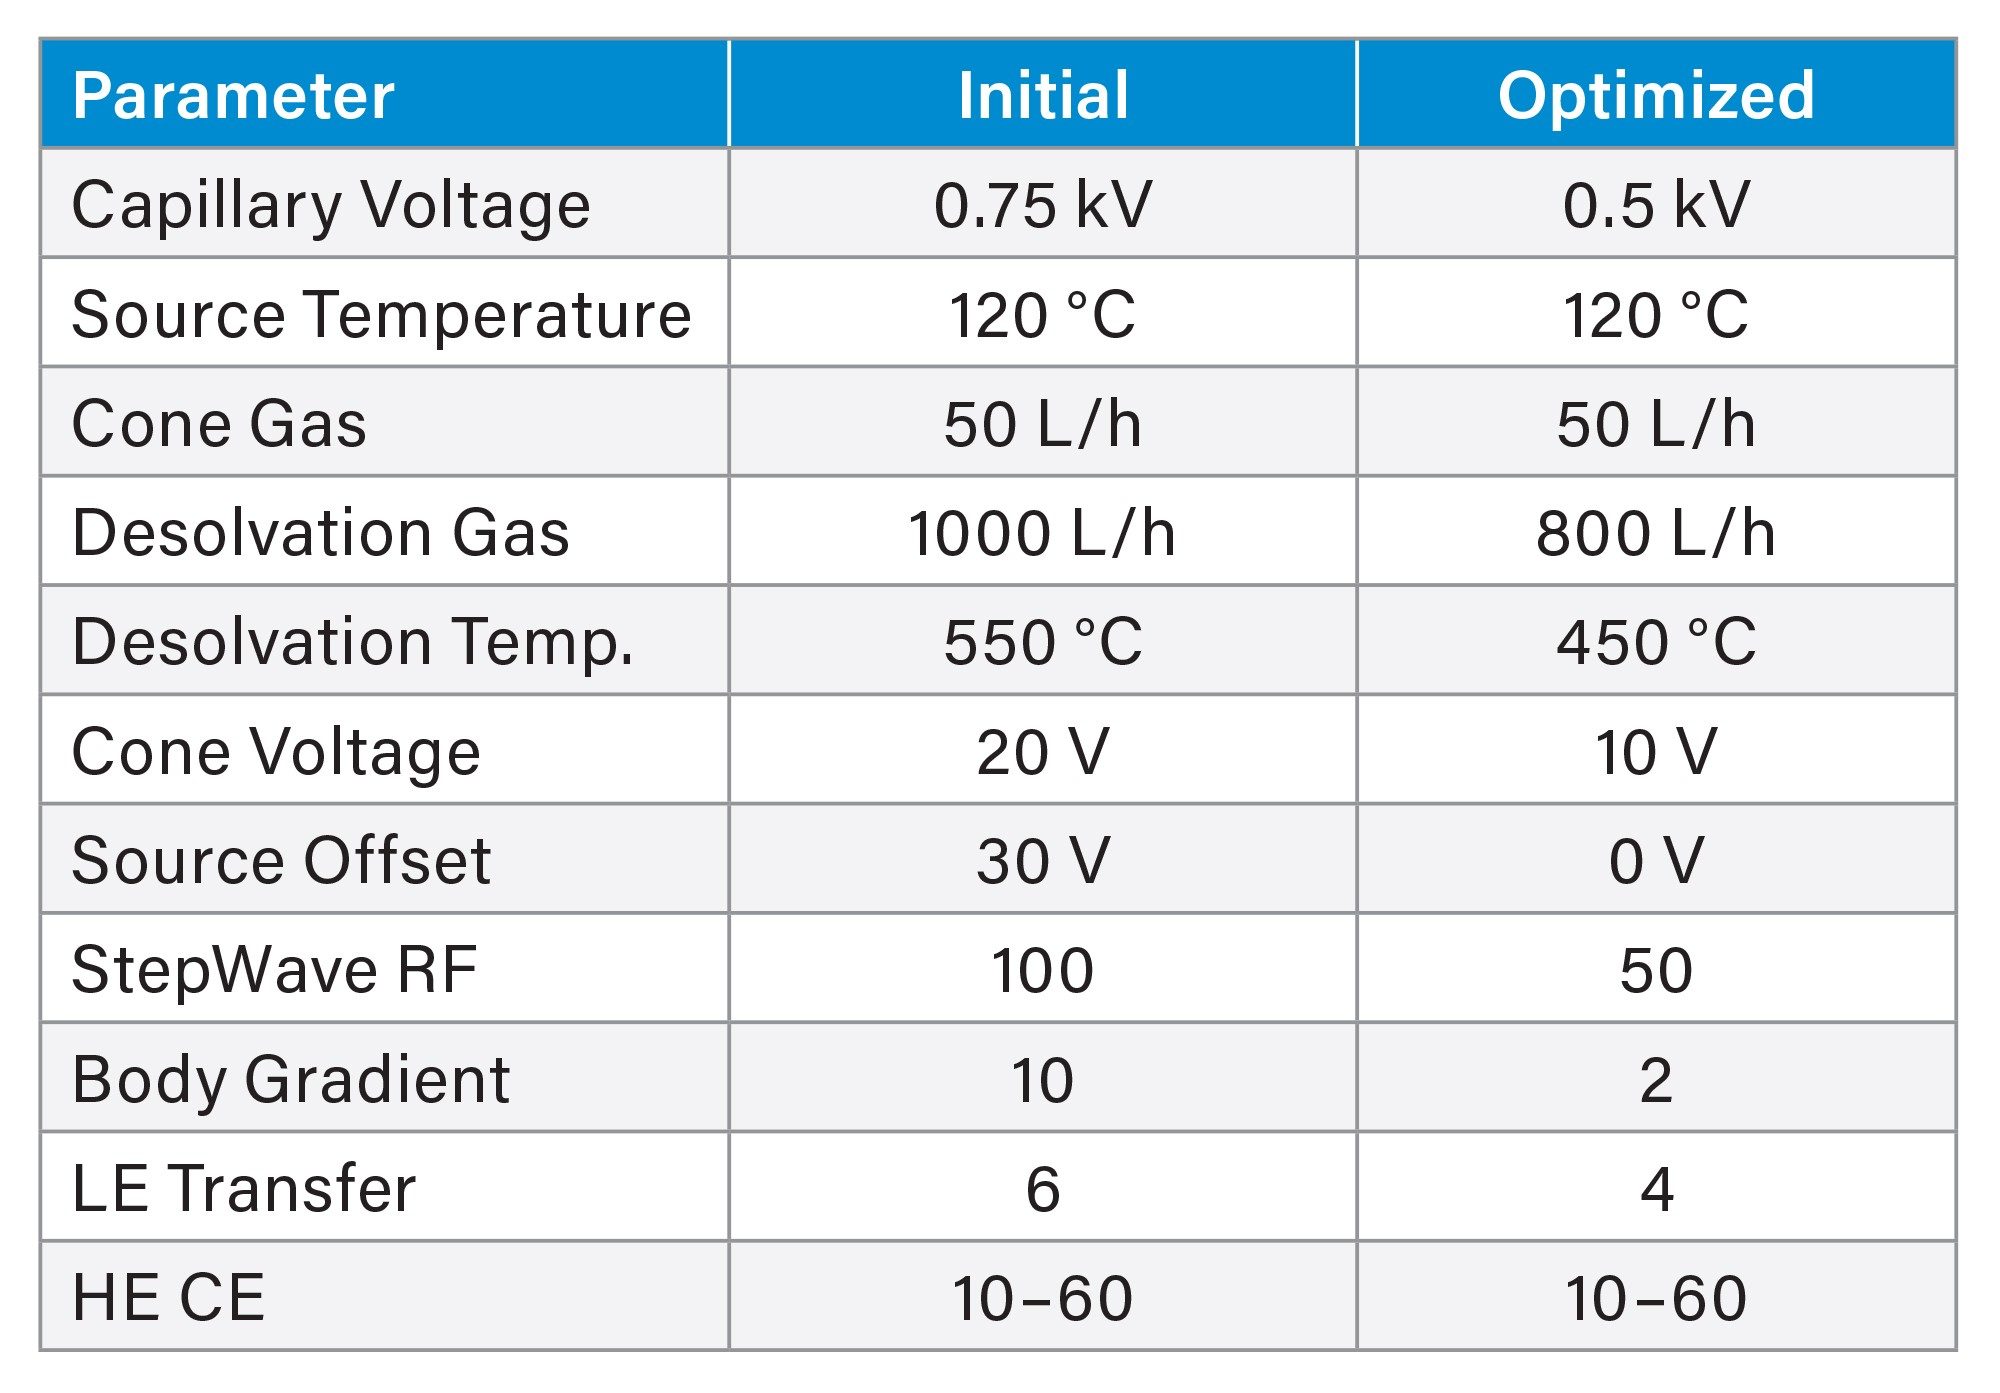
Figure 5A showed that most amino acids have the same or increased ion response for their molecular ion after optimization. This demonstrates that with optimal settings, the transmission of intact analytes is maintained or enhanced. The smallest and most labile amino acids, alanine and glycine, had the most dramatic signal enhancement, 11x and 7x fold increase respectively, while most small and labile amino acids showed at least a two-fold increase. Amino acids which showed a slight decrease in molecular ion response, Arg, Cystine, His, and Lys, are those that are easily ionizable and often have higher ion signal than most amino acids, so a small decrease in response would not be expected to have a large effect on quantitative and qualitative results. Figure 5B showed the optimized conditions resulted in an overall decrease in the precursor-to-fragment ion ratio, an indication better transmission of the intact molecular ions. Except for Trp, all monitored fragment-ion-ratios were below 20% in the low energy spectra. The ratio of Trp decreased from 99% to 25%. Overall, the optimized parameters for the ESI source, StepWave XS Ion Guide, and XS collision cell demonstrated in these experiments provided an increase to the overall molecular ion response of the labile amino acids and a reduction of in-source fragmentation for all amino acids.
An LC-MS method has been developed for cell culture media and metabolite analysis using Xevo G3 QTof Mass Spectrometer. The method employed a nine minute chromatographic run time, a 200+ compound library, and corresponding workflow-guided data process as was published based on BioAccord HRMS System. Given Xevo G3 QTof Mass Spectrometer has more ion optics and transmission regions within the instrument, resulting in more places where labile molecules can undergo in-source fragmentation, an extensive optimization was executed as summarized in this application note. After optimization, the most labile amino acids of Gly and Ala increased in molecular ion response by 11x and 7x, respectively. A significant increase in molecular ion response was observed for all small amino acids below m/z 135. In-source fragmentation was also reduced by optimized parameters as indicated by the decrease of fragmentation ratio of Trp from 99% to 25% in the low energy mass spectra. The decrease in fragment-to-precursor ion response ratio was achieved for all monitored amino acids. Overall, these optimized parameters will provide the best molecular ion responses for monitoring and quantitating amino acids in cell culture media.
Alelyunas, Y. W.; Gray, J.; Wrona, M. D.; Boyce, P. Introducing a Rapid Throughput LC-MS Method for Cell Culture Media Nutrient and Metabolite Analysis Supporting Upstream Bioprocessing. Waters Application Note. 720008170. January 2024.
Alelyunas, Y. W.; Wrona, M. D.; Chen, W. Monitoring Nutrients and Metabolites in Spent Cell Culture Media for Bioprocess Development Using the BioAccord LC-MS System with ACQUITY Premier. Waters Application Note. 720007359. September 2021.
Alelyunas, Y. W.; Wrona, M. D.; Yu, Y. Q. Quantification of Underivatized Amino Acids in Cell Culture Media Using the BioAccord™ LC-MS System. Waters Application Note. 720007766. October 2022.
Khoury-Hollins, H.; Riba, I.; Kirk, J. Optimization of Source and Transmission Parameters for a Mix of Labile and Stable Per- or Polyfluoroalkyl Substances (PFAS) Using the Xevo™ G3 QTof Mass Spectrometer. Waters Application Note. 720008118. November 2023.
Reid, L.; Pickles, D. Improved Transmission of Labile Species on the Xevo™ G3 QTof Mass Spectrometer with the StepWave™ XS. Waters Application Note. 720007794. November 2022.
720009581, September 2026