High-throughput Single Cell Lipidomics LC-MS/MS Workflow Using the Xevo™ MRT P10 Mass Spectrometer
Qianying Xua,b, Scarlet Ferrinhoa,b, Lee A. Gethingsa,b, David Heywooda, Robert S. Plumba, Matt Spickb, Olivier Cexusc, Paul Townsendd, E.N. Clare Millsb
a Waters Corporation, Wilmslow, United Kingdom
b University of Surrey, Guildford, United Kingdom
c Universitè Paris-Saclay, Gustave Roussy, Paris, France
dLiverpool John Moores University, Liverpool, United Kingdom
Published on June 17, 2026
Abstract
This application note describes a high-throughput single-cell LC-MS workflow including single-cell harvesting, sample preparation, data acquisition and data processing. This workflow demonstrates high reproducibility, sensitivity and high-quality lipid annotations at single-cell level using an ACQUITY™ Premier UPLC™ System coupled with the Xevo MRT P10 Mass Spectrometer (MS). Over 180 lipids were reproducibly identified from single cell samples, 80 of which were confidently annotated with a mass accuracy of less than 1 ppm.
Benefits
- A high-throughput (6.5 min, injection-injection) data independent analysis (DIA) LC-MS method for single-cell lipidomics.
- Analytical-scale LC separation of lipids at the single cell level, avoiding the requirement for capillary scale LC.
- High mass accuracy (<1 ppm) provides confident lipid identification when database searching for identifications.
- A robust, reproducible single-cell analysis workflow accessible to labs with standard cell culture facilities and either sample-shipping capacity or moderate LC-MS expertise.
Introduction
Traditional lipidomics often relies on extracting lipids from bulk and homogenised samples.1,2 While this approach provides broad and abundant information about the overall lipid profiles, it lacks the cellular details that arise from biological heterogeneity. Cells and higher structures such as tissues exhibit substantial biological heterogeneity and therefore, single-cell omics analysis is becoming increasingly essential for advancing fundamental cell biology and translational medical research.
Although single-cell transcriptomics has established analysis at the cellular level and is now routine and broadly accessible, extending this resolution to LC-MS-based omics approaches remains challenging. Recently, many single cell omics have relied on the use of nanoflow LC-MS,3, 4 to adopt lower flow rates and therefore increase ionisation efficiency and thus improve sensitivity. However, this can have drawbacks including high back pressures from the column, low throughput and high maintenance demands, particularly when using solvents such as isopropanol, which are routinely used for lipidomic analyses. This application note describes a high-throughput single-cell lipidomics workflow using analytical-flow LC-MS. This approach achieves single-cell sensitivity, while also enabling high-throughput , which utilizes a 6.5 min injection-to-injection LC gradient.
Experimental
Sample Preparation
Caco-2 (ATCC-HTB-37) and HT29-MTX (ATCC-HTB-38) cells were separately cultured in Dulbecco’s Modified Eagle Medium (DMEM) supplemented with 10% (v/v) fetal bovine serum (FBS), 2% (v/v) L-glutamine, 1% (v/v) sodium pyruvate, 1% (v/v) penicillin-streptomycin and 0.1% (v/v) amphotericin B. Both cell lines were passaged when they reached approximately 80% confluence (~2-3 days). Caco-2 cells were cultured for 21 days until fully differentiated. The complete growth media was replaced with DMEM ~ 4-16 hrs in advance to avoid the misdetection of the growth media contents.
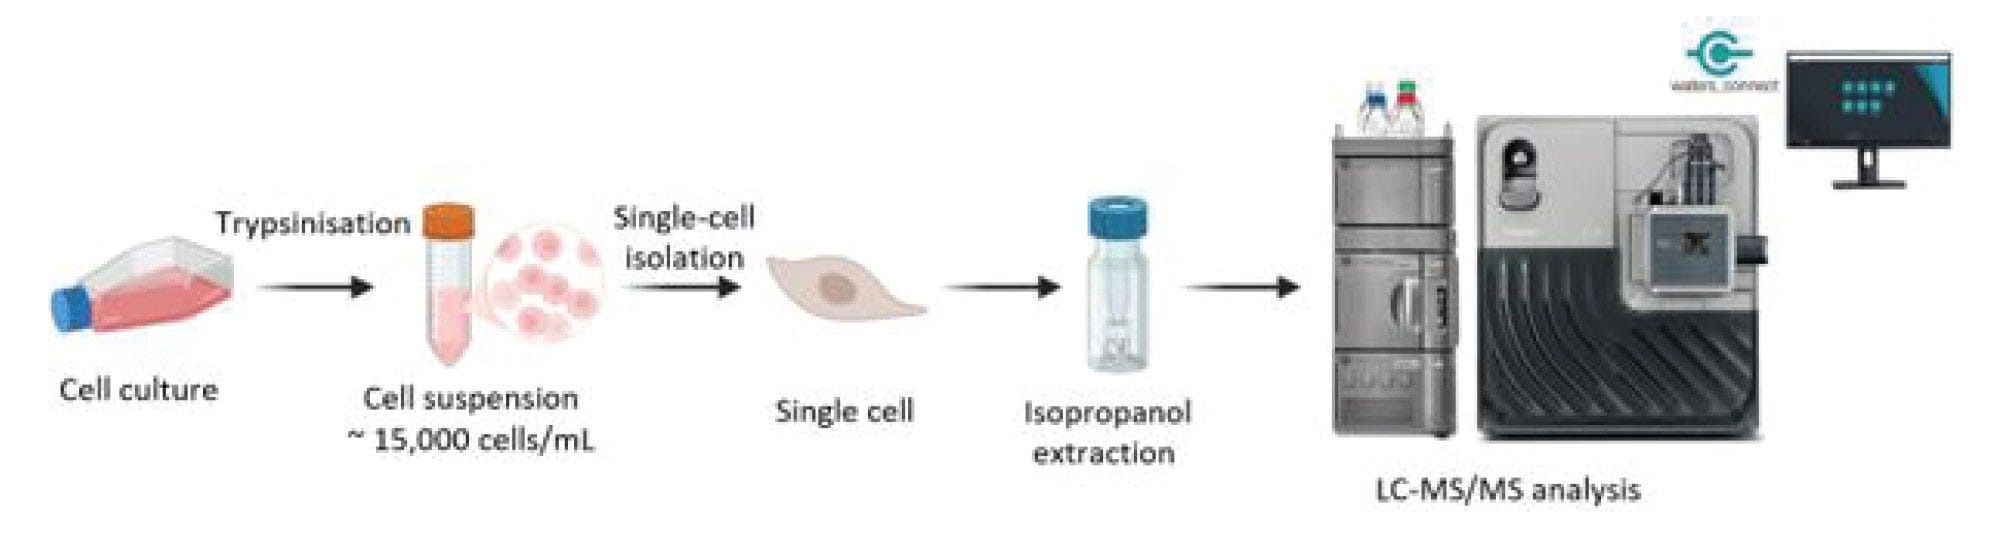
Single-cell samples were isolated using the isoPick™ Platform (iotaSciences, UK) following the manufacturer’s protocol. Briefly, cell layers were rinsed with Dulbecco’s phosphate buffered saline (DPBS) and trypsinized into suspension and pelleted by centrifugation (300 × g). The cell pellet was then resuspended in DPBS to ~ 15,000 cells/mL. Single cells were then isolated into GRID chambers to be visualized, and the presence of single cell were confirmed by microscopy, before collecting into Waters Qsert Vials (p/n: 186001126DV). On the day of processing, 10 µL of ice-cold isopropanol containing 16 ng/mL EquiSPLASH™ (Avanti Research) was added to each vial.
LC Conditions
|
LC system: |
ACQUITY Premier Flow-Through Needle (FTN) UPLC System |
|
Vials: |
Glass Qsert Vials (p/n: 186001126DV) |
|
Column(s): |
ACQUITY Premier CSH™ Phenyl-Hexyl Column 2.1 x 50 mm, 1.7 µm (p/n: 186009474) |
|
Column temperature: |
70 °C |
|
Injection volume: |
10 µL |
|
Flow rate: |
0.7 mL/min |
|
Mobile phase A: |
Water, 0.1% formic acid, 1 mM ammonium formate |
|
Mobile phase B: |
95% acetonitrile, 0.1% formic acid, 1 mM ammonium formate |
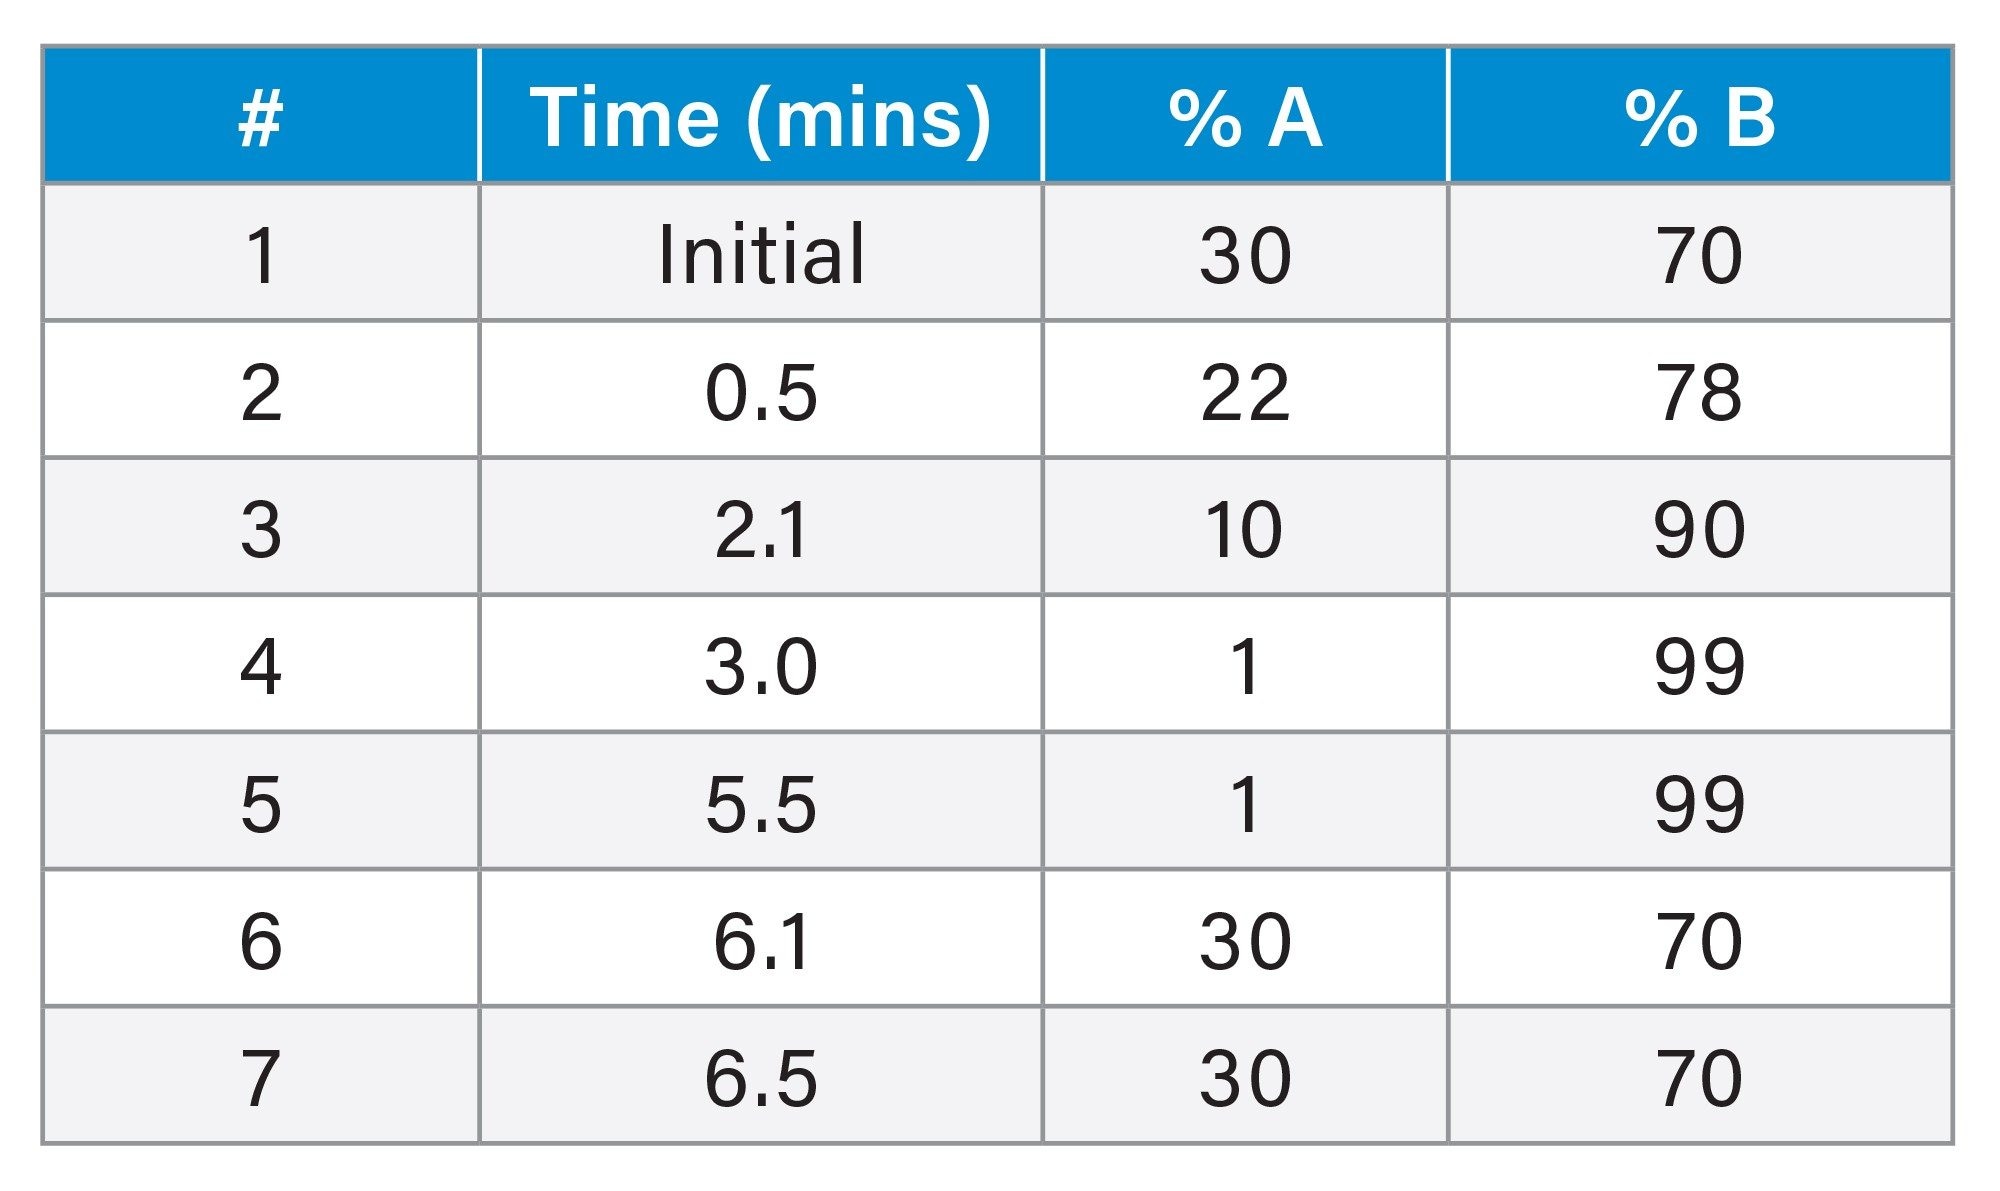
LC Gradient
MS Conditions
|
MS system: |
Xevo MRT P10 MS |
|
Ionization polarity: |
Positive |
|
Capillary voltage: |
2.8 kV |
|
Sampling cone: |
40 V |
|
Source Temperature: |
120 °C |
|
Desolvation temperature: |
500 °C |
|
Cone gas flow: |
50 L/Hr |
|
Desolvation flow: |
750 L/Hr |
|
Data format: |
MSE continuum |
|
Acquisition range: |
50-1200 Da |
|
Quadrupole: |
Auto |
|
Scan speed: |
10 Hz |
|
Fragmentation CE: |
20-40 eV (ramp profile) |
Data Analysis
The resulting .mzML files were exported using waters_connect™ Software and imported into Lipostar (Mass Analytica)5 (v2.1.7b3) for processing. The MS signal threshold was set at 700, whilst the MS/MS signal threshold was set at 500; S/N filter was set to 3. Lipid features were searched against the LIPID MAPS® Structure Database (LMSD)6 with the MS tolerance at 2 ppm. Samples were blank corrected and normalized against a mix of deuterium-labeled internal standards (EquiSPLASH). Lipid annotations were retained for those with mass scores over 20. Multi-variate statistical analysis was performed by Lipostar2 built-in tools. Mass spectra and extracted ion chromatograms were also generated in Lipostar2. After generating the transition list for the deuterium labeled lipid standards using LipidCreator,7 the internal standards were visualized using Skyline.8
Results and Discussion
One of the critical issues discovered during the workflow optimisation was ensuring adequate contamination control (i.e., originating from labware used during sample handling). To minimize these sources of contamination, glass vials were used to avoid the possibility microplastics leaching into the single-cell samples. Cells were also collected directly into pre-frozen glass Qsert Vials, mounted on an ice-module (pre-frozen at -20 °C). In order to maintain these ice-cold conditions, samples were immediately stored at -80 °C after collection. Lipid extraction was performed directly within the same vial using MS-grade isopropanol to reduce the number of handling steps and to minimize sample loss.
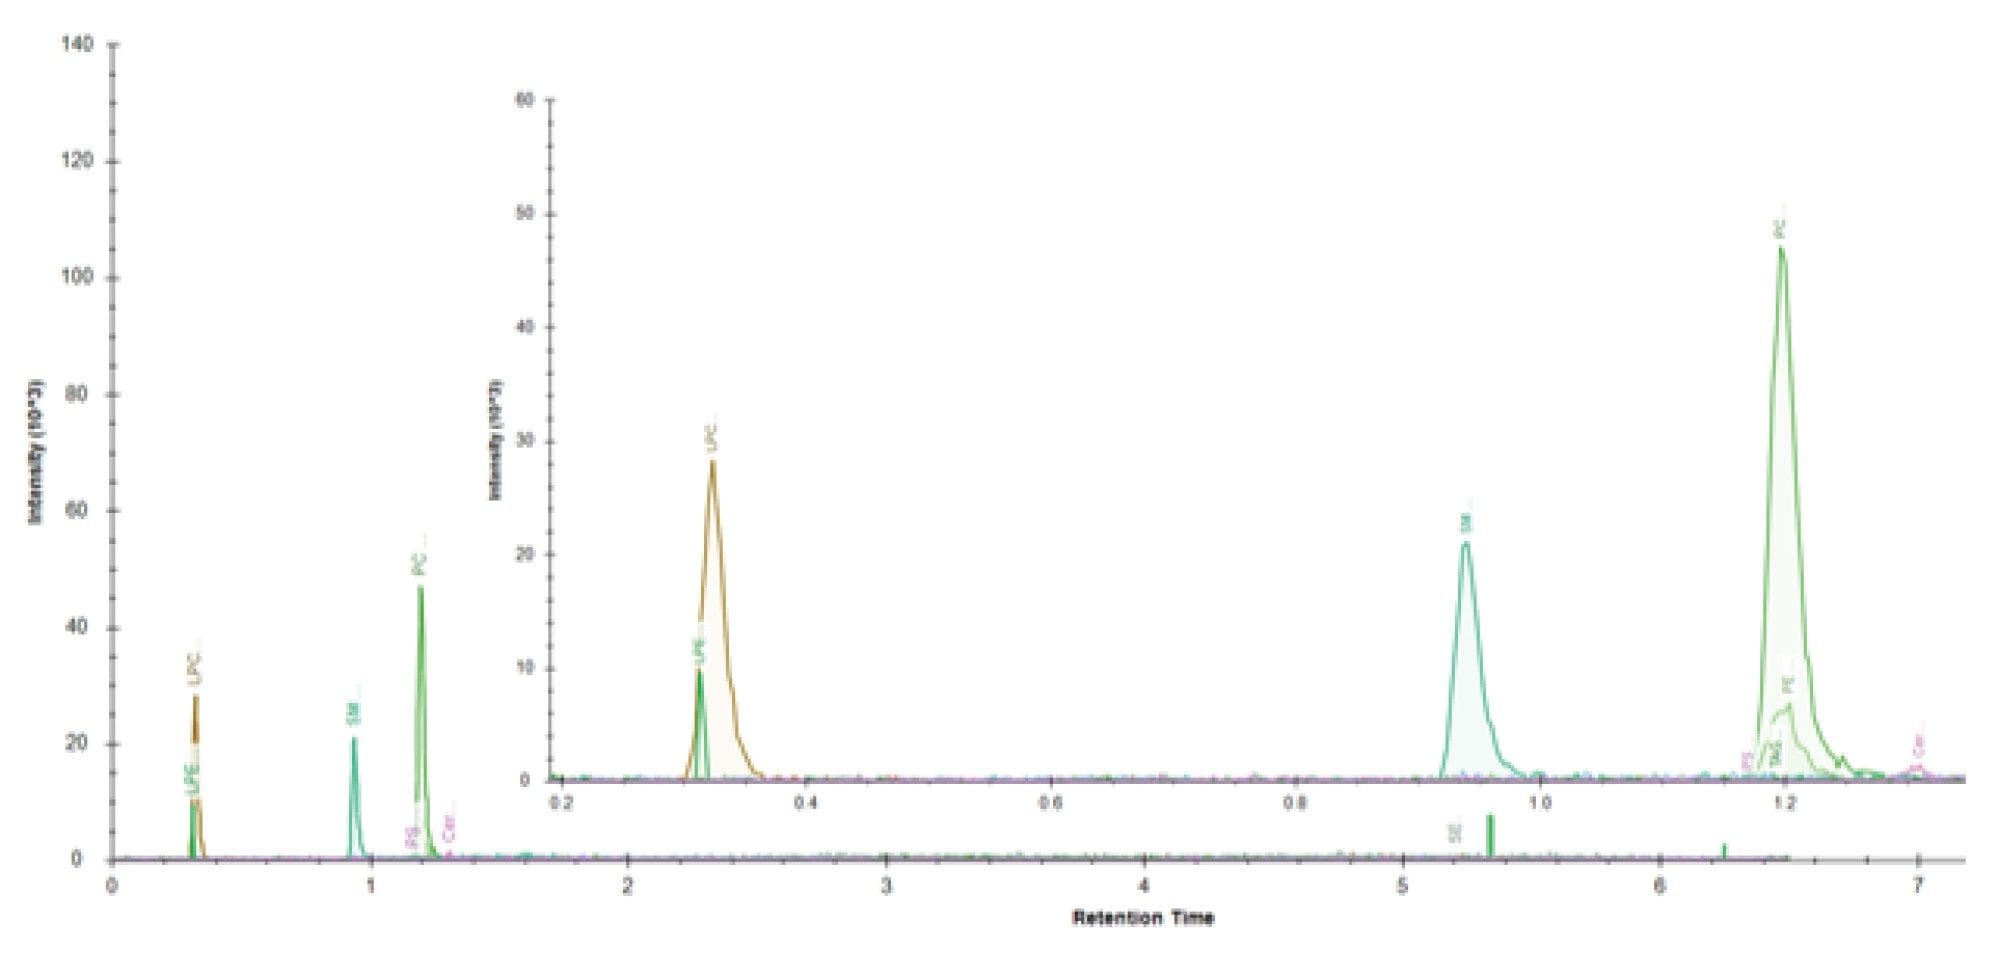
Ten microliters of each sample were injected onto an analytical-scale ACQUITY Premier UPLC System at a flow rate of 0.7 mL/min and lipids separated using a charged surface hybrid (CSH) phenyl-hexyl column, which retains analytes via pi-pi (π-π) interactions. When coupled with the Xevo MRT P10 Mass Spectrometer, operating at a scan rate of 10 Hz, this analytical-flow LC method provided a 6.5-min method (injection-injection). The method retained resolution and sensitivity that was particularly suitable for the high-throughput needs required for single-cell lipidomics (Figure 1). The phenyl-hexyl stationary phase utilized acetonitrile as the mobile phase in lieu of the common lipidomic solvent, isopropanol, therefore resulting in a lower background pressure and provides the ability for polar metabolite analysis with the same setup (i.e., multi-omics configuration). Further, the phenyl-hexyl column offers the potential for positional isomer separation by discriminating the isomeric structures via π-π interactions to the column chemistry.
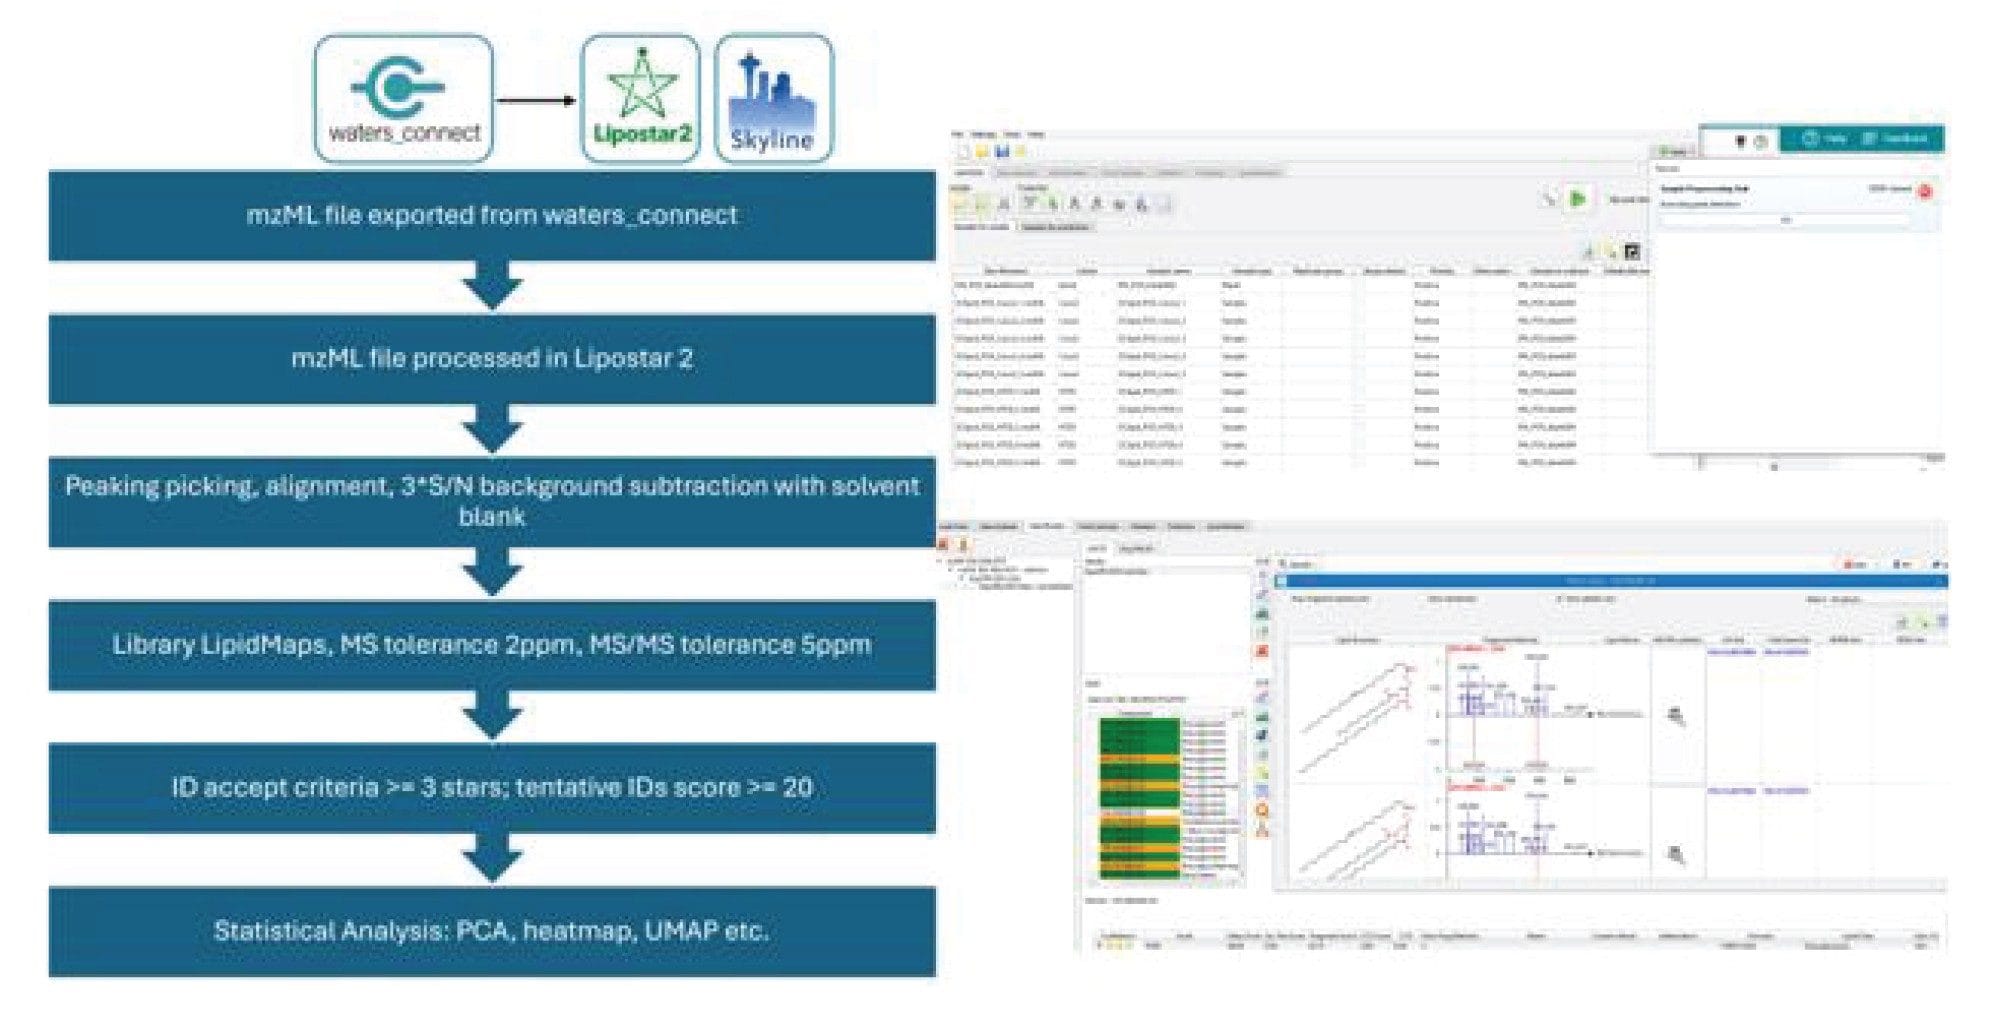
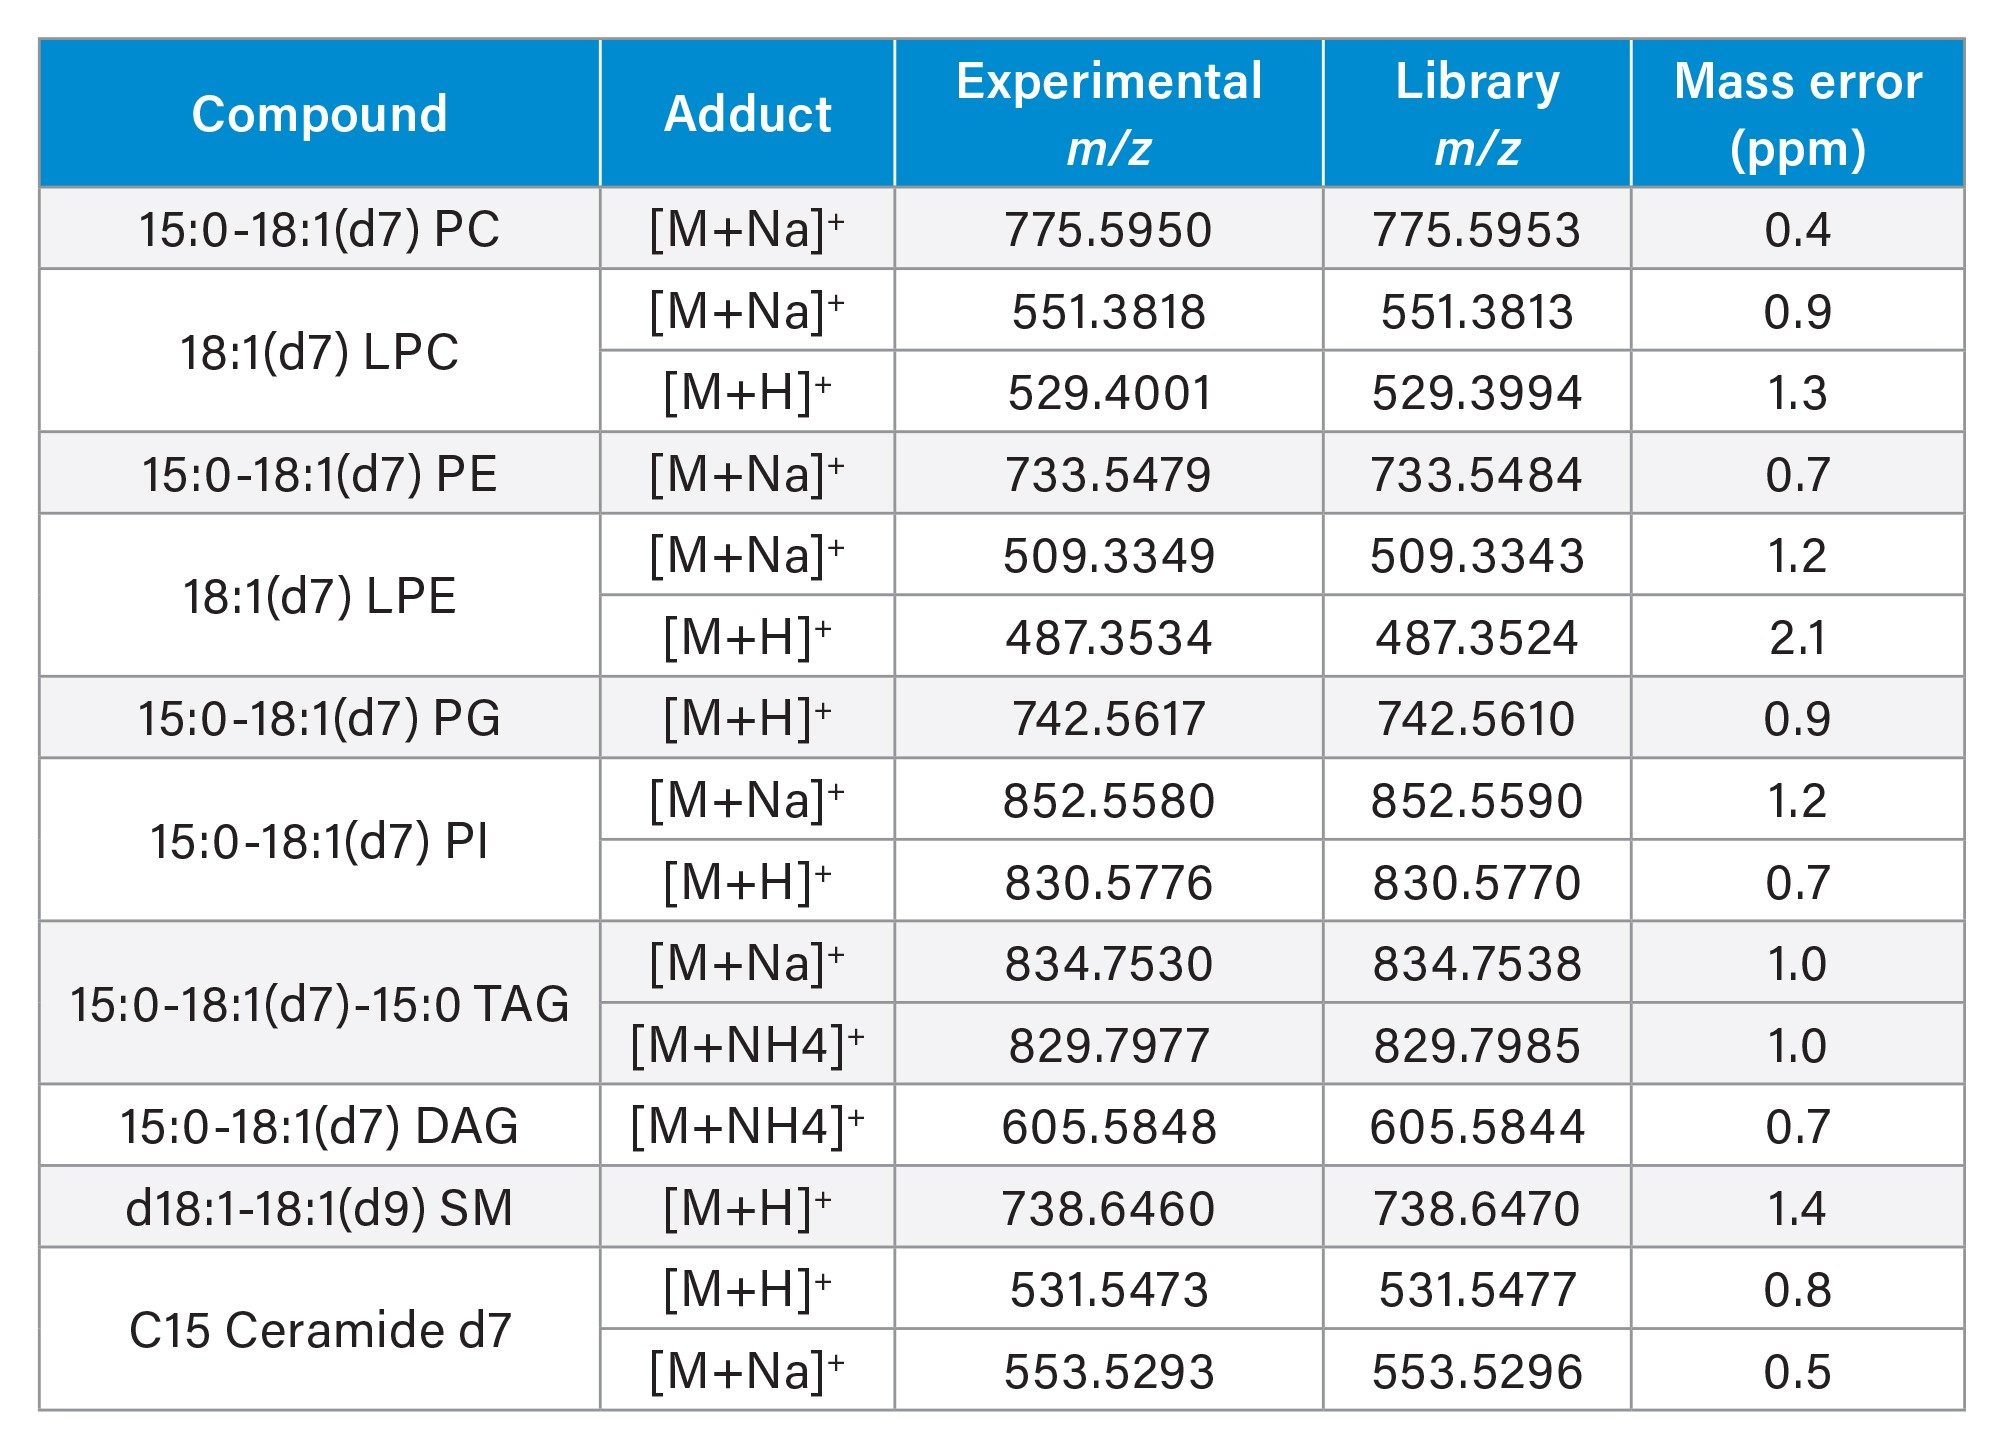
The data was converted to .mzML format via waters_connect Software prior to importing into Lipostar5 (Figure 2). After blank correction, the mass features were searched against the open-source library, LIPID MAPS® Structure Database (LMSD). Based on the mass scores, manual review of the mass spectra and retention times, there were more than 300 tentative annotated lipid identifications, covering a range of lipid classes (PC, PE, PI, PG, PS, SM, CE, TG, DG and ceramides). EquiSPLASH was added as an internal reference (based on single cell equivalent concentration) for the purpose of monitoring system performance and serving as reference for normalization (Figure 3). The internal standards detected are listed in Table 1. With exception of PS, CE and MG, all the spiked lipid standards were detected with up to two adducts.
Additional confidence in the compound identifications is provided with the high mass accuracy of the Xevo MRT P10 Platform. Data relating to the EquiSPLASH standards, highlights this with an average of <1 ppm. An example of a confident identification based on the endogenous lipids, is provided for TG (60:9) in Figure 5, with a matched fragment ion of m/z 705.582 (error < 500 ppb).
Representative extracted ion chromatograms (XIC) and corresponding MS2 spectra are shown in Figure 4. TG 14:0/14:0/18:0 eluted at approximately 3.2 min with a precursor ion at m/z 801.6935, was as expected retention time of neutral lipids. The fragment ion at m/z 573.4853 likely corresponds to a neutral loss of 14:0 yielding DG 14:0/18:0-Na+, while m/z 551.5029 corresponds to a neutral loss of 18:0, producing DG 14:0/14:0-Na+. The two phosphatidylcholines eluted at around 1 min and exhibited relatively sharper peak shapes. Diagnostic fragments such as the PC headgroup (m/z 184.074), present in the MS2 spectra, provided additional confirmation of the PC species. High mass accuracy associated with the precursor and corresponding fragment ions, further increased the confidence of the lipid assignment.
![The extracted ion chromatograms of endogenous lipids: TG 46:0 [M+Na] + (m/z=983.8030), PC 42:8 [M+H] + (m/z=858.5993) and PC 36:2 [M+H] + (m/z=786.5987). Their corresponding MS2 spectra are also shown, indicating the raw experimental data (blue peaks) matched to the reference library spectra (red peaks)](/content/dam/waters/en/app-notes/2026/720009350/720009350en-f4.jpg.82.resize/img.jpg)
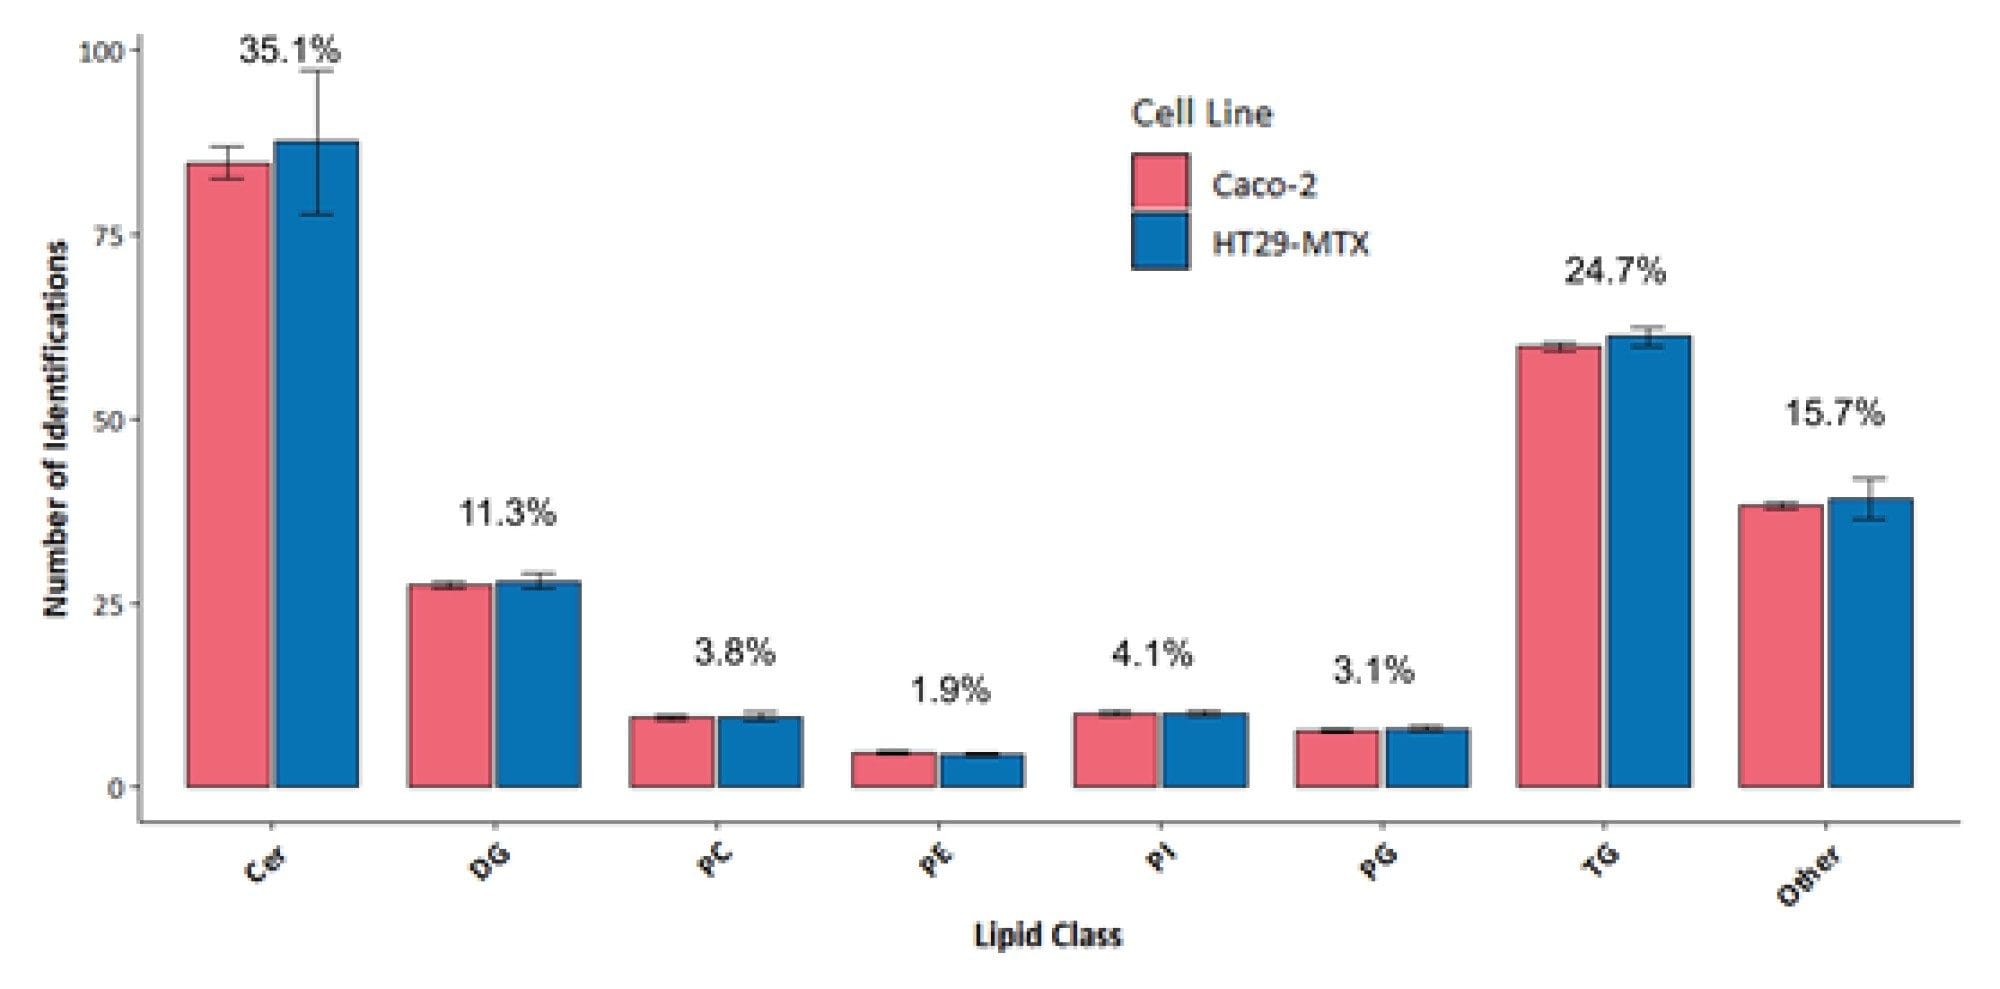
Overall, a comparable number of lipid identifications and a similar distribution across lipid classes for Caco-2 and HT29-MTX cells were observed (Figure 5). Ceramides, diglycerides, and triglycerides constituted the majority of the identified lipids. A variety of phospholipid species were the third largest lipid group to be identified, including phosphatidylcholines (PC) and phosphatidylinositol (PI), for example.
Conclusion
These data demonstrate the capability of Xevo MRT P10 MS coupled with analytical flow ACQUITY Premier LC System at the single-cell level. One-step extraction and a high-throughput gradient largely simplified the workflow and ensured accessibility to the community. The high-resolution of Xevo MRT P10 MS improves data quality for lipid annotations. The utilization of a phenyl-hexyl column hugely expands the potential for further applications in isomer differentiation.
References
- Satomi, Y.; Hirayama, M.; Kobayashi, H. One-step lipid extraction for plasma lipidomics analysis by liquid chromatography mass spectrometry. Journal of Chromatography B. 2017;1063:93–100.
- Quehenberger, O.; et al. Lipidomics reveals a remarkable diversity of lipids in human plasma. Journal of lipid research. 2010;51(11):3299–305.
- Xie, X.; et al. Multicolumn nanoflow liquid chromatography with Accelerated offline gradient generation for robust and sensitive single-cell proteome profiling. Analytical chemistry. 2024;96(26):10534–42.
- Kreimer, S.; et al. High-throughput single-cell proteomic analysis of organ-derived heterogeneous cell populations by nanoflow dual-trap single-column liquid chromatography. Analytical chemistry. 2023;95(24):9145–50.
- Goracci, L.; et al. MARS: a multipurpose software for untargeted LC–MS-based metabolomics and exposomics. Analytical Chemistry. 2024;96(4):1468–77.
- LIPID MAPS: update to databases and tools for the lipidomics community. Nucleic Acids Research. 2023;5(52):D1677-D1682.
- Peng, B.; et al. LipidCreator workbench to probe the lipidomic landscape. Nature Communications. 2020;11(1):2057.
Featured Products
720009350, June 2026