Automating Sample Extraction and Cleanup of Per- and Polyfluoroalkyl Substances (PFAS) in Fish Tissues Following EPA 1633 Guidance
Kari Organtini
Waters Corporation, United States
Published on January 27, 2026
Abstract
US EPA Method 1633 is a multi-lab validated method for the analysis of 40 per- and polyfluoroalkyl substances (PFAS) in a variety of environmental matrices, including fish tissues. The manual sample preparation method utilizes a lengthy extraction and solid phase extraction (SPE) clean-up procedure requiring 2 days. Pressurized liquid extraction and SPE automation are presented as reliable alternatives to the manual sample preparation procedure. This reduces the sample preparation workflow from 2 days to being able to complete in a single 8-hour shift. The performance of the automated workflow was equivalent to performing this method manually, making this a reliable option for use with the Environmental Protection Agency (EPA) 1633 extraction of tissues. The method was demonstrated on a variety of types of fish tissue with different protein and fat compositions. Analysis was performed using the Waters PFAS workflow for LC-MS/MS.
Benefits
- A fully automated comprehensive workflow including sample extraction and clean-up for PFAS analysis of fish tissues produces high quality data with reduced manual efforts, while maintaining compliance with the EPA 1633 procedure.
- Performance criteria of EPA 1633 for extraction and analysis of tissue samples were easily met using a fully automated workflow, delivering accurate results with greater efficiency and confidence.
- An automated sample preparation workflow optimizes laboratory efficiency by reducing sample preparation time from 2 days to a single 8-hour shift minimizing overall time to process samples.
Introduction
US EPA Method 1633 is a multi-lab validated method for the targeted analysis of 40 PFAS in non-potable water matrices, soils, biosolids and tissues.1 For tissue samples, the sample is first extracted followed by clean-up using graphitized carbon black (GCB) and a weak anion exchange (WAX) SPE cartridge. The initial sample extraction method is a lengthy 3 step protocol where the first step requires a 16-hour extraction. If this method is performed full manually, it is a 2-day process to complete the extraction, sample cleanup and analysis which impacts sample throughput and turn-around time. Automation of the sample preparation workflow can significantly decrease the sample processing time and ease the burden of challenging methods on laboratory staff.
In previous work, the manual workflow for tissue analysis following EPA 1633 was presented and tested.2 The current work adapts the use of automated sample preparation systems; a pressurized fluid extraction system (EDGE PFAS™ System from CEM) and an automated SPE extraction system (SPE-03 Gen 4 from PromoChrom). Using both systems to automate the sample preparation and clean-up reduced the 2-day process to one that is achievable in a single 8-hour shift with minimal human interaction. Utilizing an automation workflow enhances the already reliable solution of the ACQUITY™ Premier System coupled to a Xevo™ TQ Absolute Mass Spectrometer for PFAS analysis following EPA Method 1633.
Experimental
Sample Preparation
The salmon, tuna, and shrimp used as representative tissues in this work were purchased from a local grocery store. Each tissue sample was homogenized in a blender with dry ice. Samples were frozen until sample analysis. In addition to the authentic samples, a fish tissue certified reference material (CRM) from FAPAS was processed with the samples. This reference material was certified for 4 PFAS residues. Standards used were purchased from Wellington Laboratories and include EPA-1633STK, MPFAC-HIF-ES and MPFAC-HIF-IS.
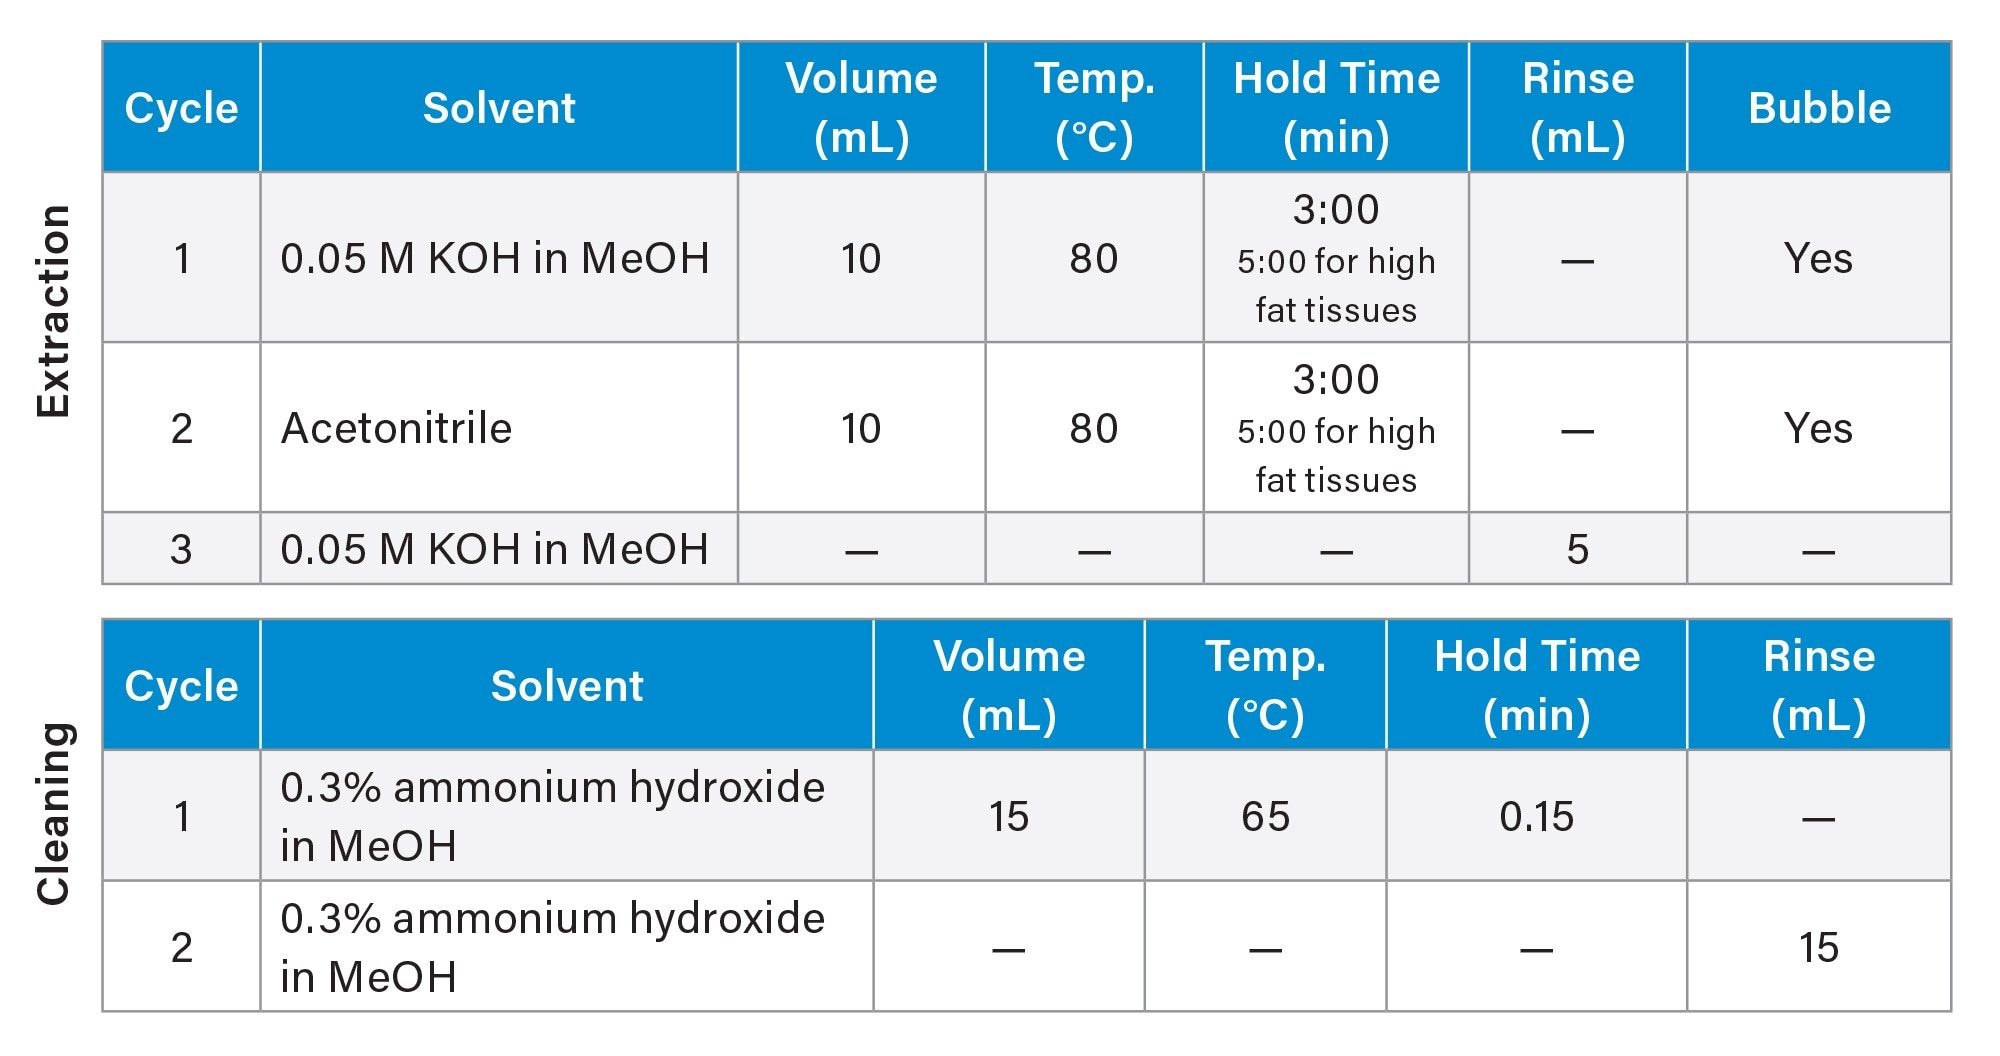
Automated sample extraction was performed using the EDGE PFAS System which is a pressurized fluid extraction device. Each Q-Cup sample cell was fitted with an S1 Q-Disc. 1.5 g of Q-Matrix Hydra and 2 g of the homogenized tissue were measured into each Q-Cup. Samples were spiked with 0.625–12.5 ng/g (concentration dependent on the range of MPFAC-HIF-ES mix) of the extracted internal standard prior to extraction. The extraction program used for the EDGE is detailed in Table 1. Following sample extraction, the entire extracted volume was diluted to 250 mL in reagent water to prepare for SPE cleanup. Sample pH was adjusted to <6 using formic acid.
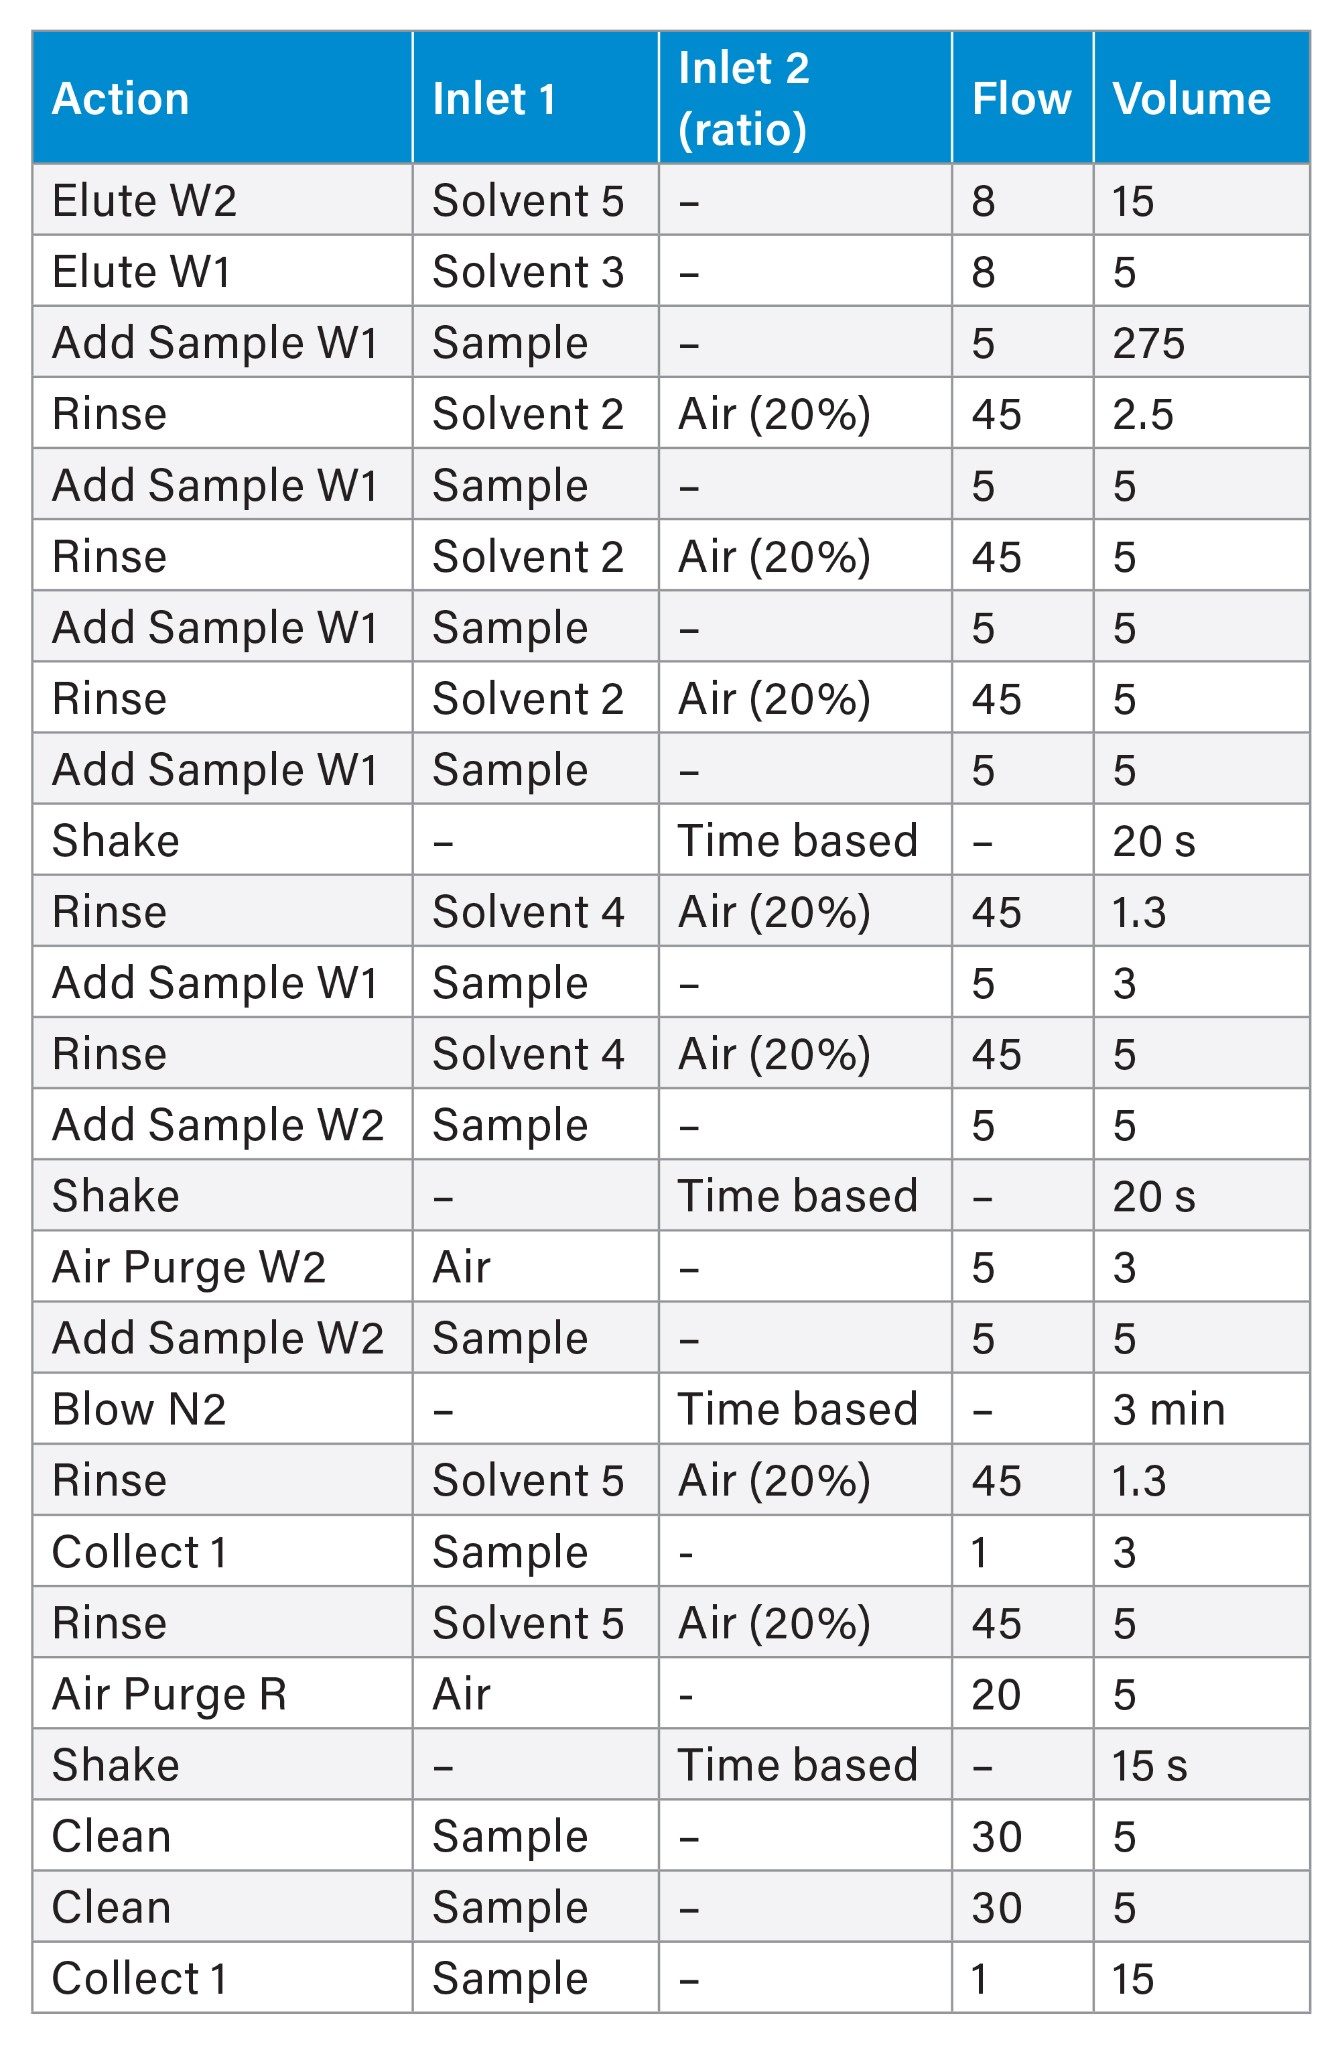
Sample cleanup was performed using the PromoChrom SPE-03 Gen 4 Automated SPE System. The method used to control the automated SPE system is detailed in Table 2 and was directly adapted from EPA 1633. High-capacity inline filters and anti-clogging tips for the MOD-004 caps were used on the sample inlet lines to filter out particulates before introduction to the SPE system. Oasis™ GCB/WAX bilayer dual-phase SPE cartridges (p/n: 186011112) containing both WAX and GCB sorbents were used. After elution from the SPE cartridge, 25 µL of acetic acid and 5 µL of the non-extracted internal standard (MPFAC-HIF-IS) were added to each sample before analysis. The calibration curve range for each analyte is listed in Appendix Table 1.
Method Conditions
LC Conditions
|
LC system: |
ACQUITY Premier System with Binary Solvent Manager and Flow Through Needle |
|
Vials: |
700 µL Polypropylene Screw Cap Vials (p/n: 186005219) |
|
Analytical column: |
ACQUITY Premier BEH™ C18 Column 2.1 x 50 mm, 1.7 µm (p/n: 186009452) |
|
Isolator column: |
Atlantis™ Premier BEH C18 AX Column 2.1 x 50 mm, 5.0 µm (p/n: 186009407) |
|
Column temperature: |
35 °C |
|
Sample temperature: |
10 °C |
|
PFAS kit: |
PFAS Install Kit (p/n: 176004548) |
|
Injection volume: |
2 µL |
|
Flow rate: |
0.3 mL/min |
|
Mobile phase A: |
2 mM ammonium acetate in water |
|
Mobile phase B: |
2 mM ammonium acetate in acetonitrile |
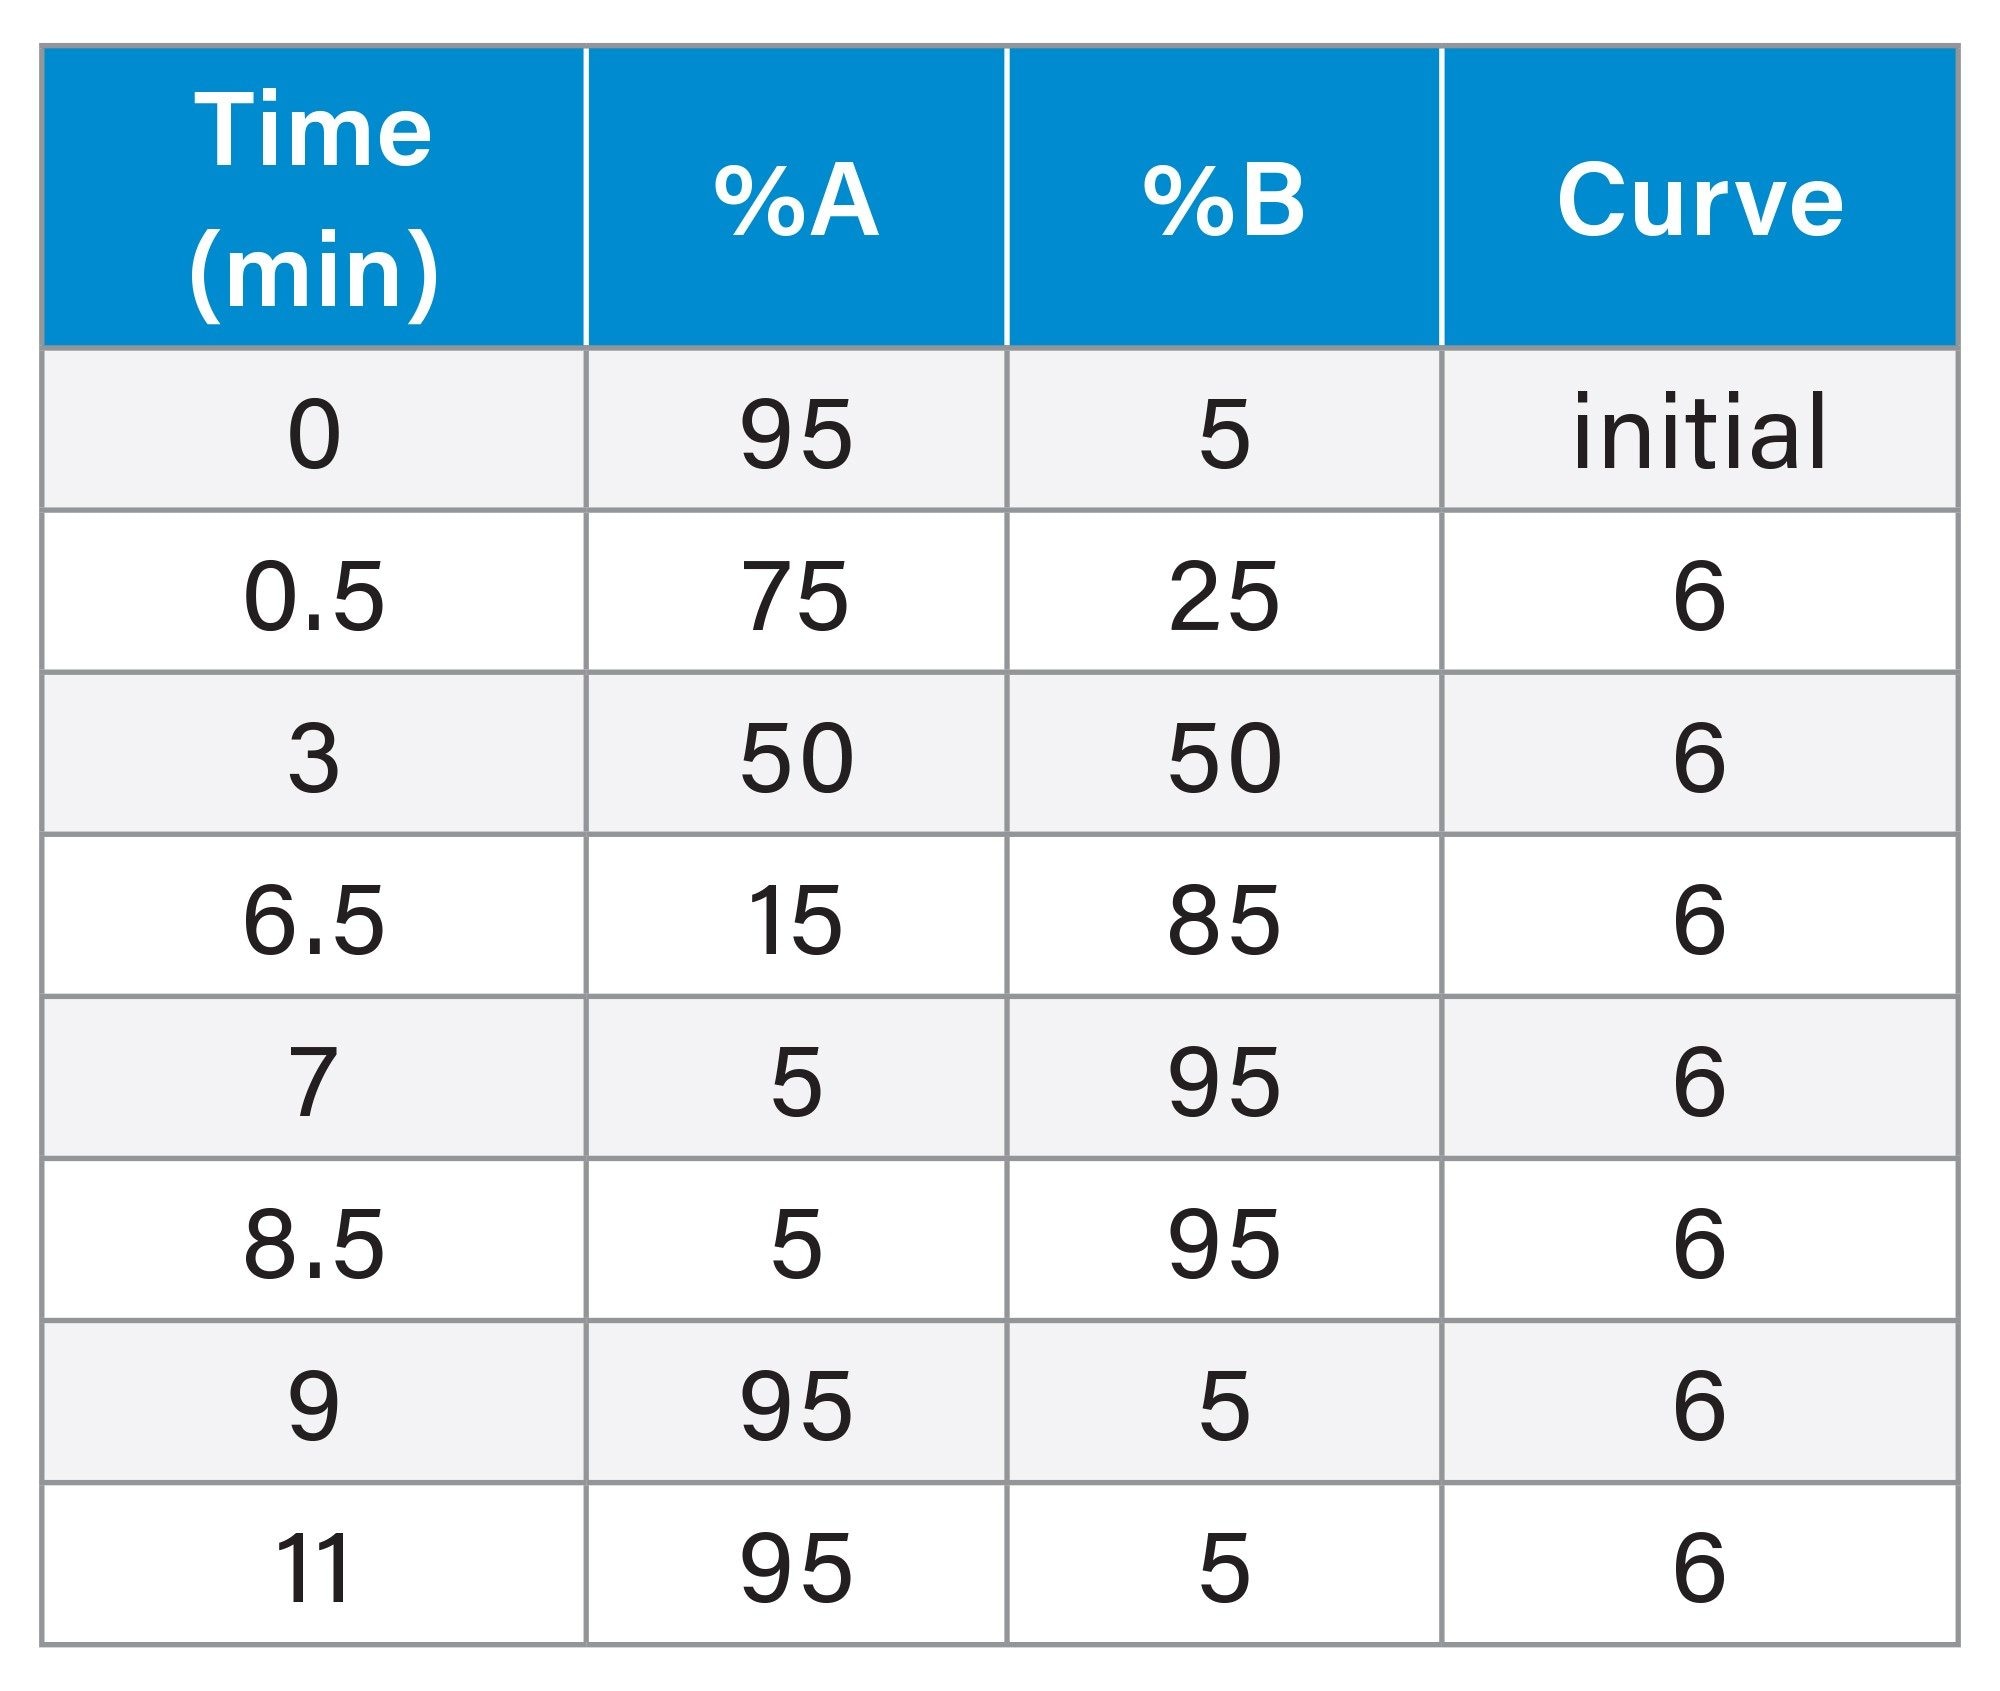
Gradient Table
MS Conditions
|
MS system: |
Xevo TQ Absolute Mass Spectrometer |
|
Ionization mode: |
ESI- |
|
Capillary voltage: |
0.5 kV |
|
Source temperature: |
100 °C |
|
Desolvation temperature: |
350 °C |
|
Desolvation flow: |
900 L/hr |
|
Cone flow: |
150 L/hr |
|
MRM method |
See Appendix for Full MRM Method details |
Data Management
|
Software: |
waters_connect™ for Quantitation Software |
Results and Discussion
Overall Time Saving Benefit of Automated Workflow
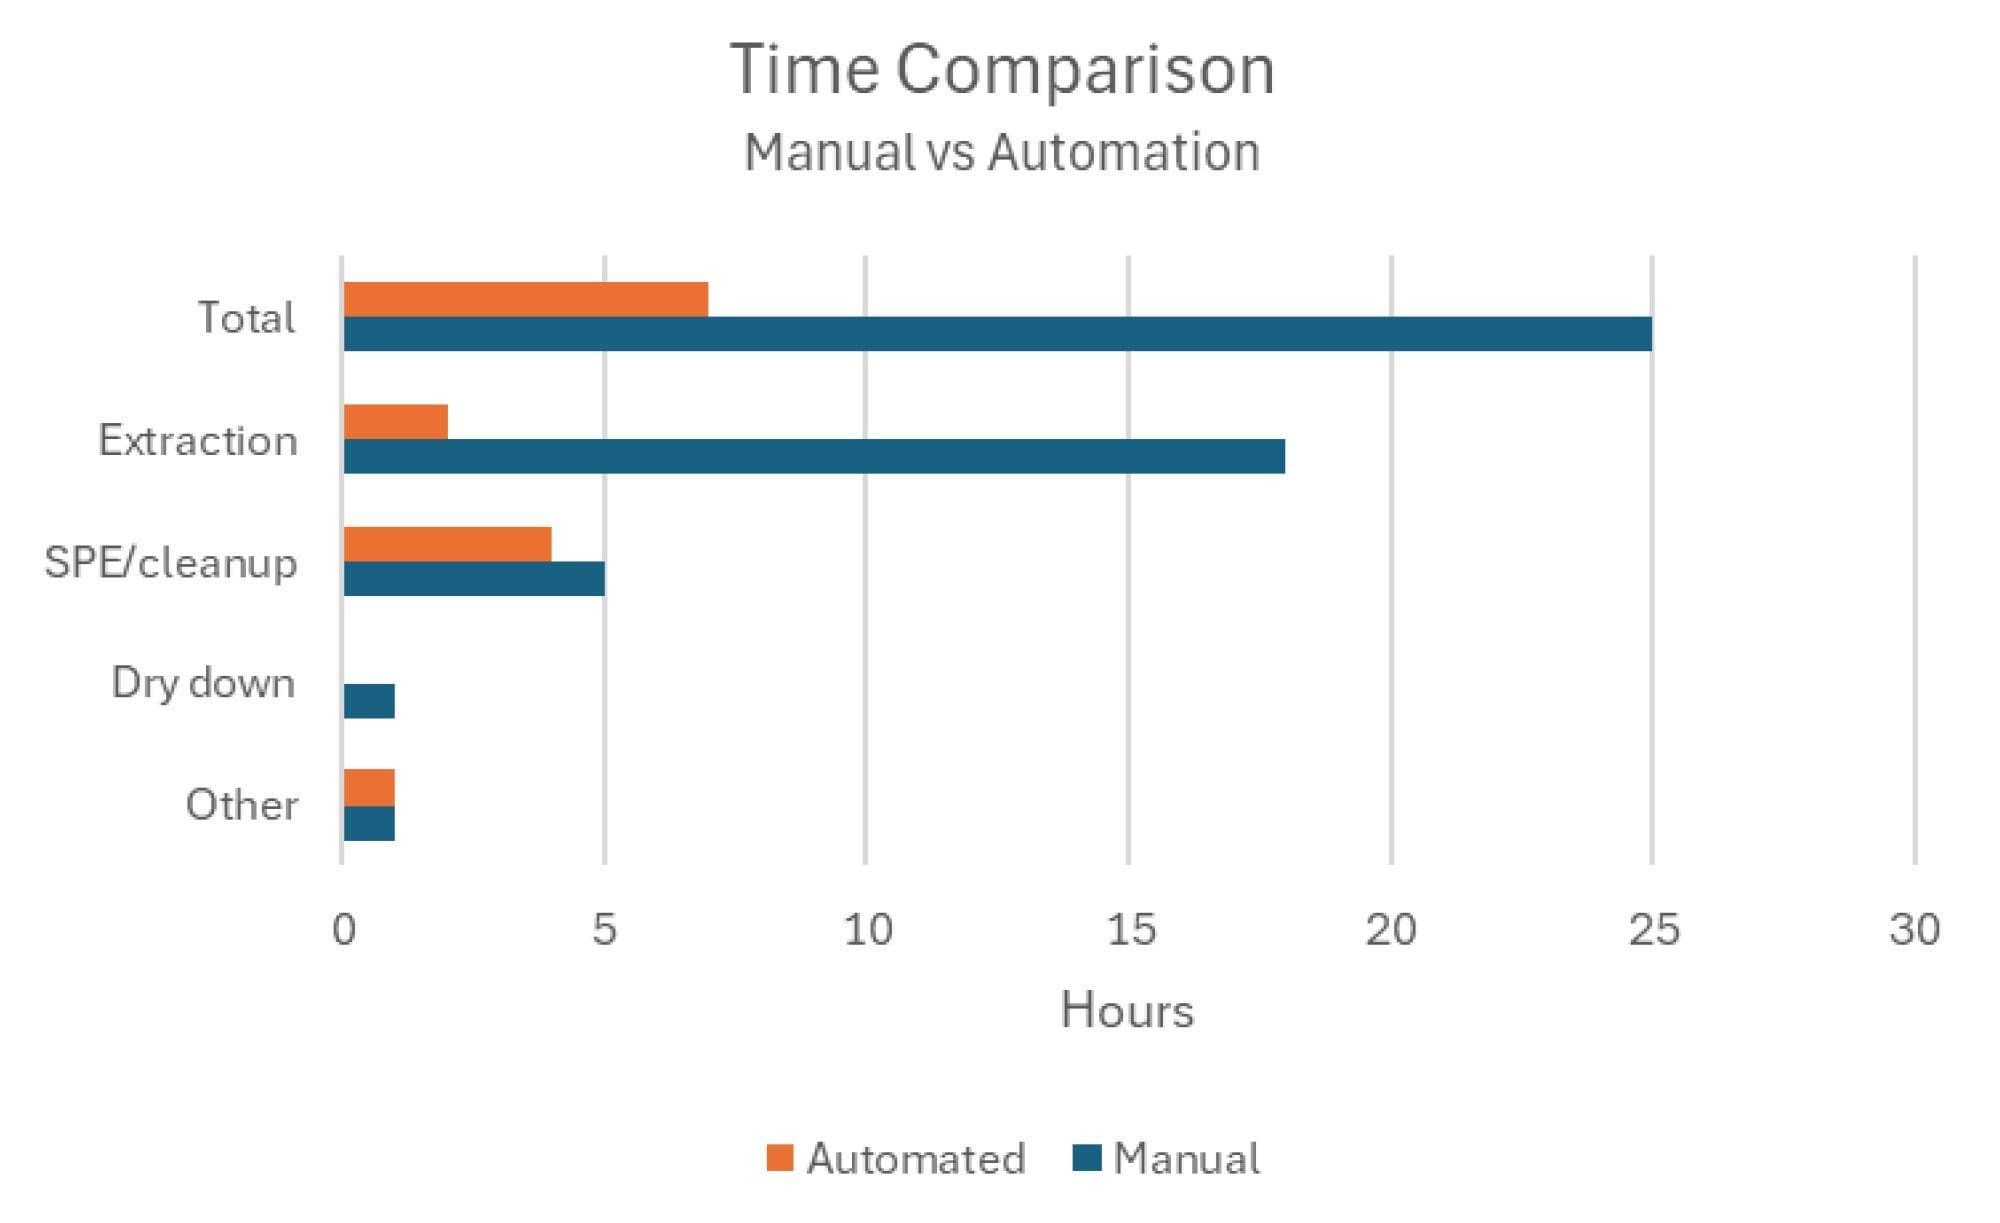
The breakdown of the time requirements for the manual sample preparation and the automated sample preparation processes is compared in Figure 1. The automated sample extraction method processes samples in series and takes approximately 10 minutes per sample to extract and then clean the system to prepare for the next. The sample rack holds 12 samples, resulting in a 2-hour time period to extract a full batch of samples. The comparison of manual and automated methods highlights not only how much time saving there is in automating the process, but also the reduction in steps that require human intervention. After weighing the sample into the extraction cup, the only other step that requires hands-on time is diluting the sample to prepare for SPE. This aids in reducing the potential of introducing PFAS contamination into the samples and allows for more efficient use of analyst time as the samples are extracted.
Verifying Extraction System Blanks
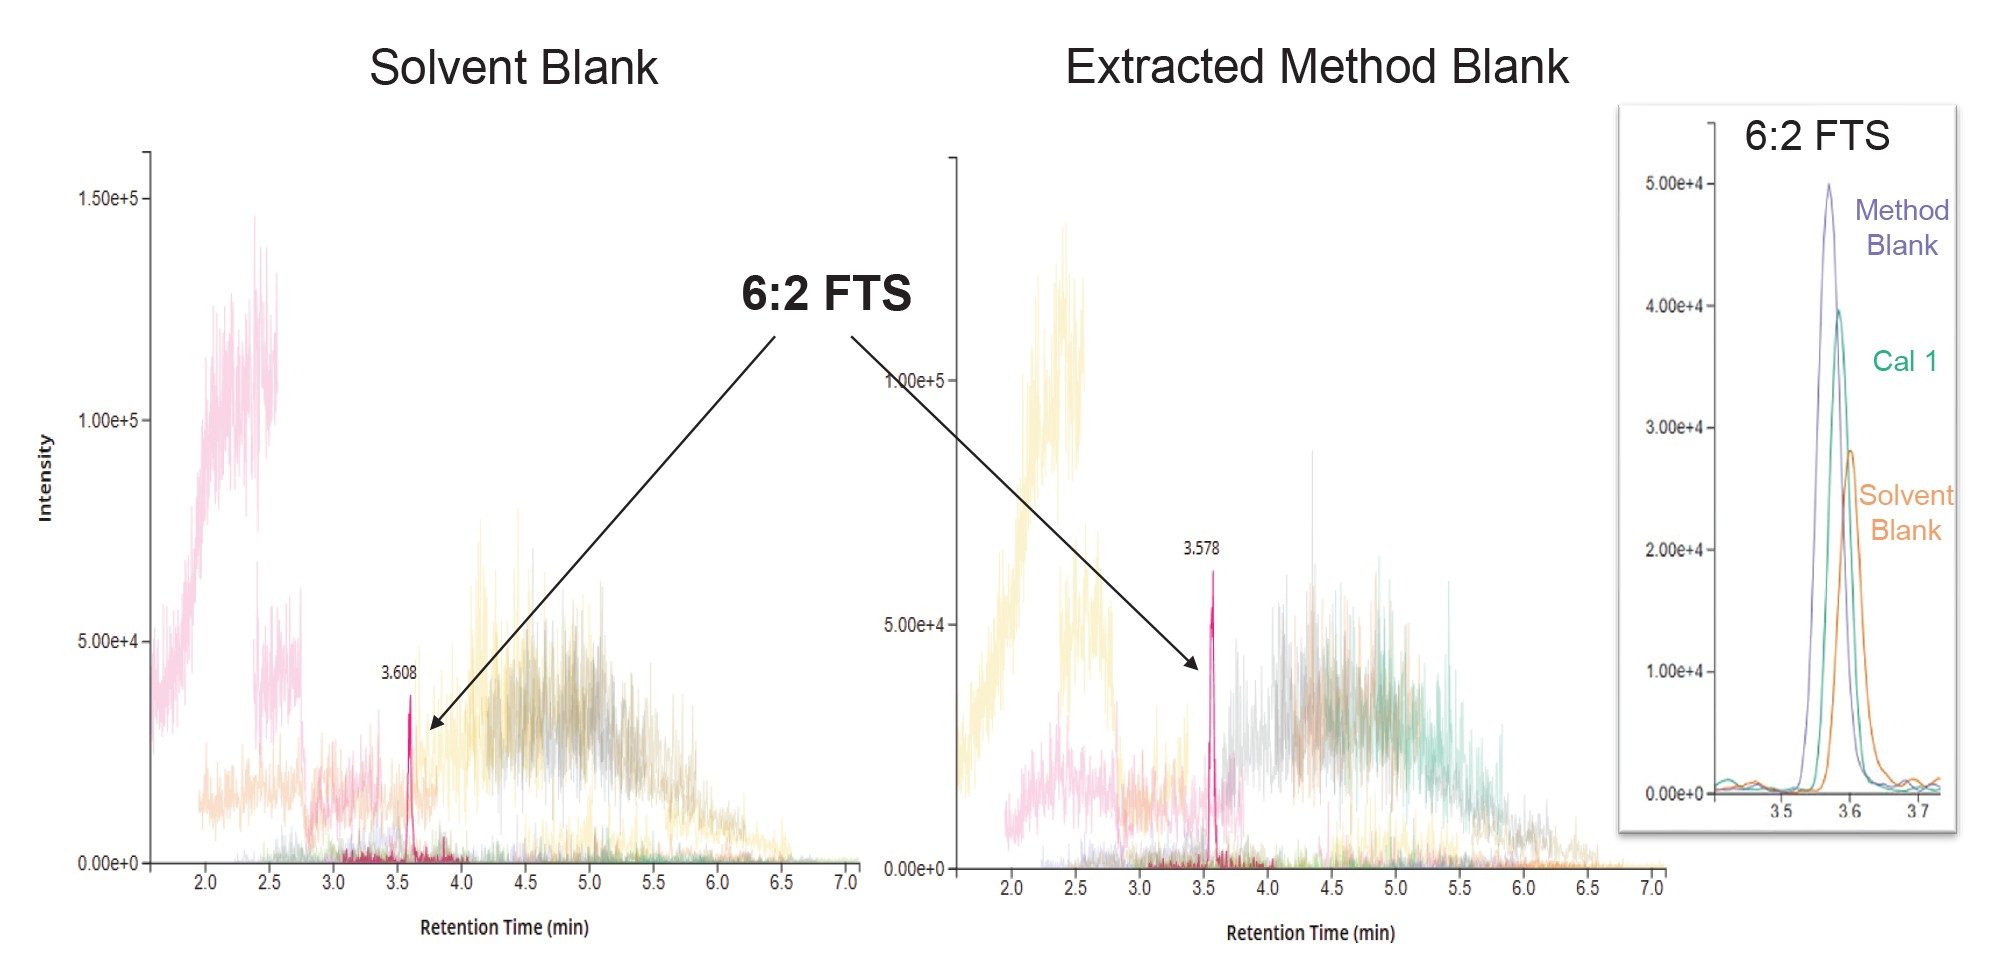
PFAS contamination is often a concern due to their widespread use in everyday products. This is of special concern during sample preparation as any contamination introduced can become concentrated during the extraction and clean-up procedures. Therefore, it is imperative to have confidence that the equipment, consumables and reagents used for sample preparation are free from or low in PFAS contamination. Method blanks (consisting of just 1.5 g of Q-Matrix Hydra) were taken through the full procedure of extraction and clean-up to monitor any contribution from the extraction systems used for automation. Chromatograms showing the comparison of background levels of all targeted PFAS in the method for a solvent blank and an extracted method blank are shown in Figure 2. The only PFAS detected in both blank samples was 6:2 FTS, which can be seen in the inlay of Figure 2, demonstrating a comparison of the response in the solvent blank, method blank and lowest calibration point (5 ng/L). The presence of this compound in the solvent blank that is not exposed to any extraction equipment suggests that the EDGE and SPE-03 are not the source of this contaminant, but that it is present in a solvent or reagent used in the procedure.
Recovery in Fish Tissue Samples
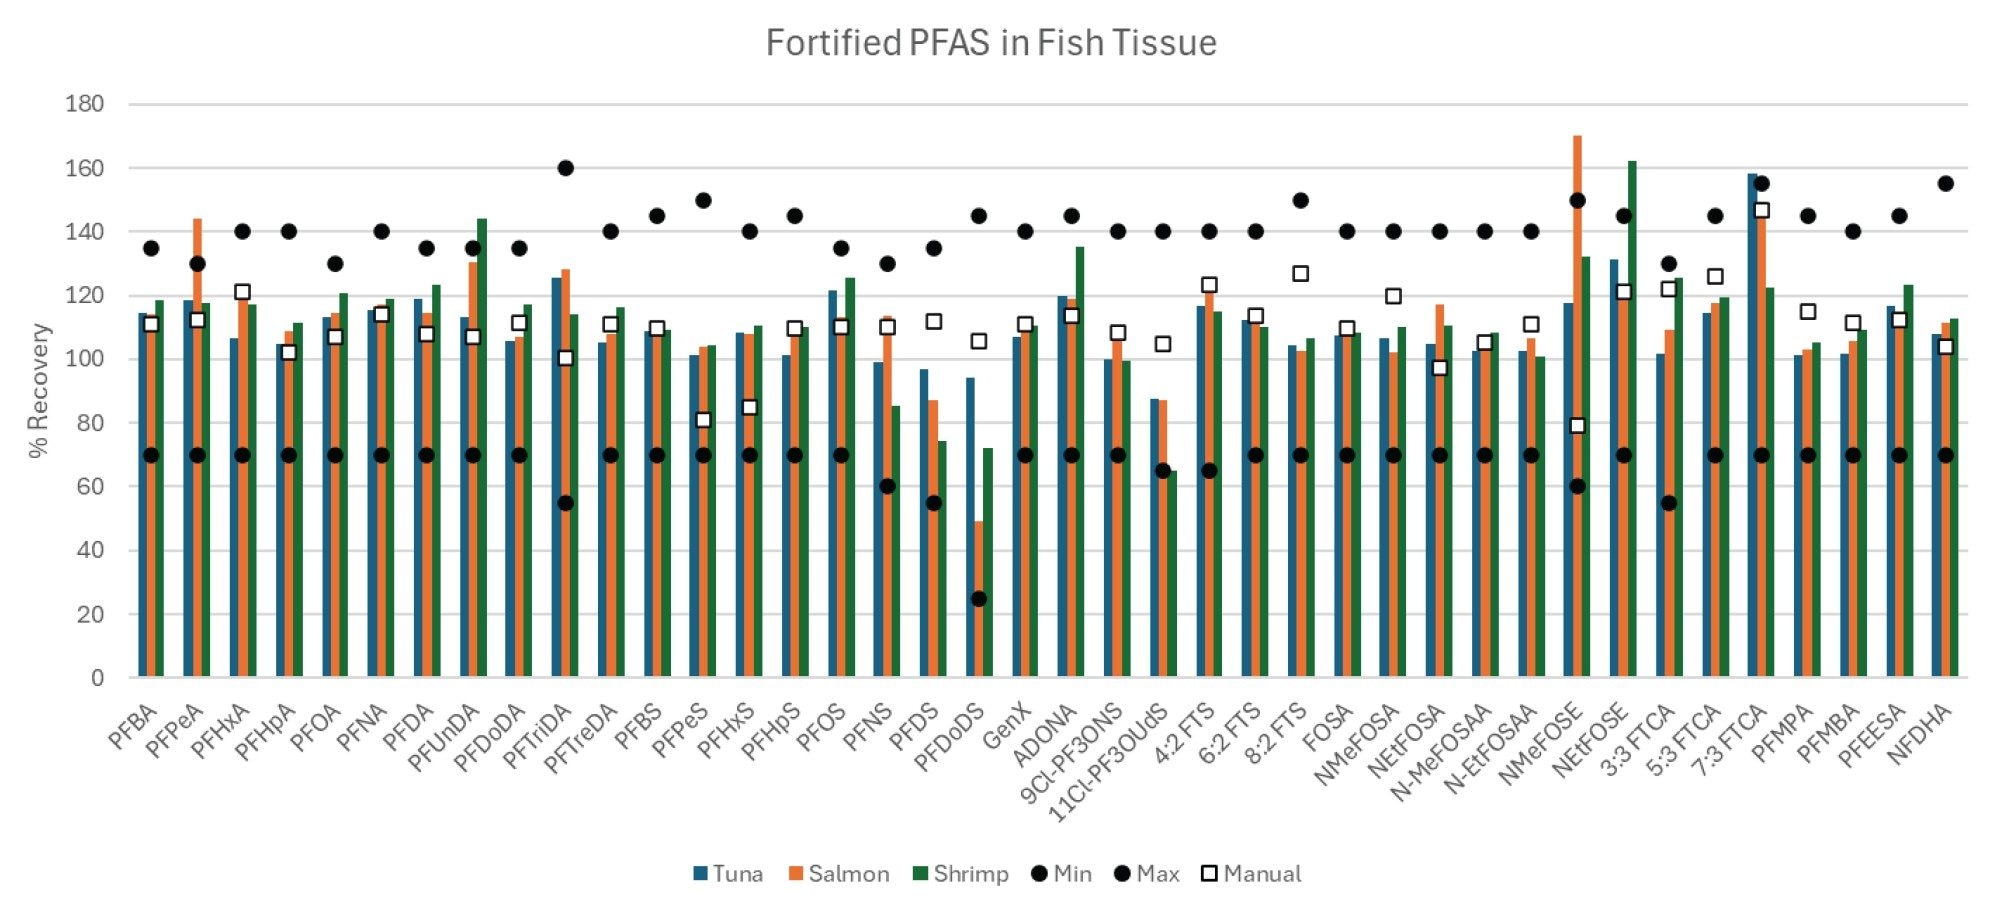
Performance of the automated extraction and clean-up was monitored by the recovery of the extracted internal standards and recovery of the native compounds fortified into the samples. Extracted internal standard recoveries are shown in Figure 3 for the three different tissues. The recoveries of each extracted internal standard are compared to the equivalent manual extraction method previously published (in salmon tissue only), as well as the minimum recovery guidelines provided by EPA 1633.1 All compounds were easily above the required minimum recovery levels for all three tissue types. Furthermore, the recoveries were also comparable to those of the manual extraction, demonstrating the automated sample preparation workflow is equivalent. Additionally, the overall recoveries of the 40 targeted native PFAS fortified into each tissue were also equivalent to the manual extractions as demonstrated in Figure 4. All compounds were above the minimum recovery requirements with a few that slightly exceeded the maximum recovery requirements potentially due to matrix interference or lack of matched internal standards.

Analysis of a Certified Reference Material
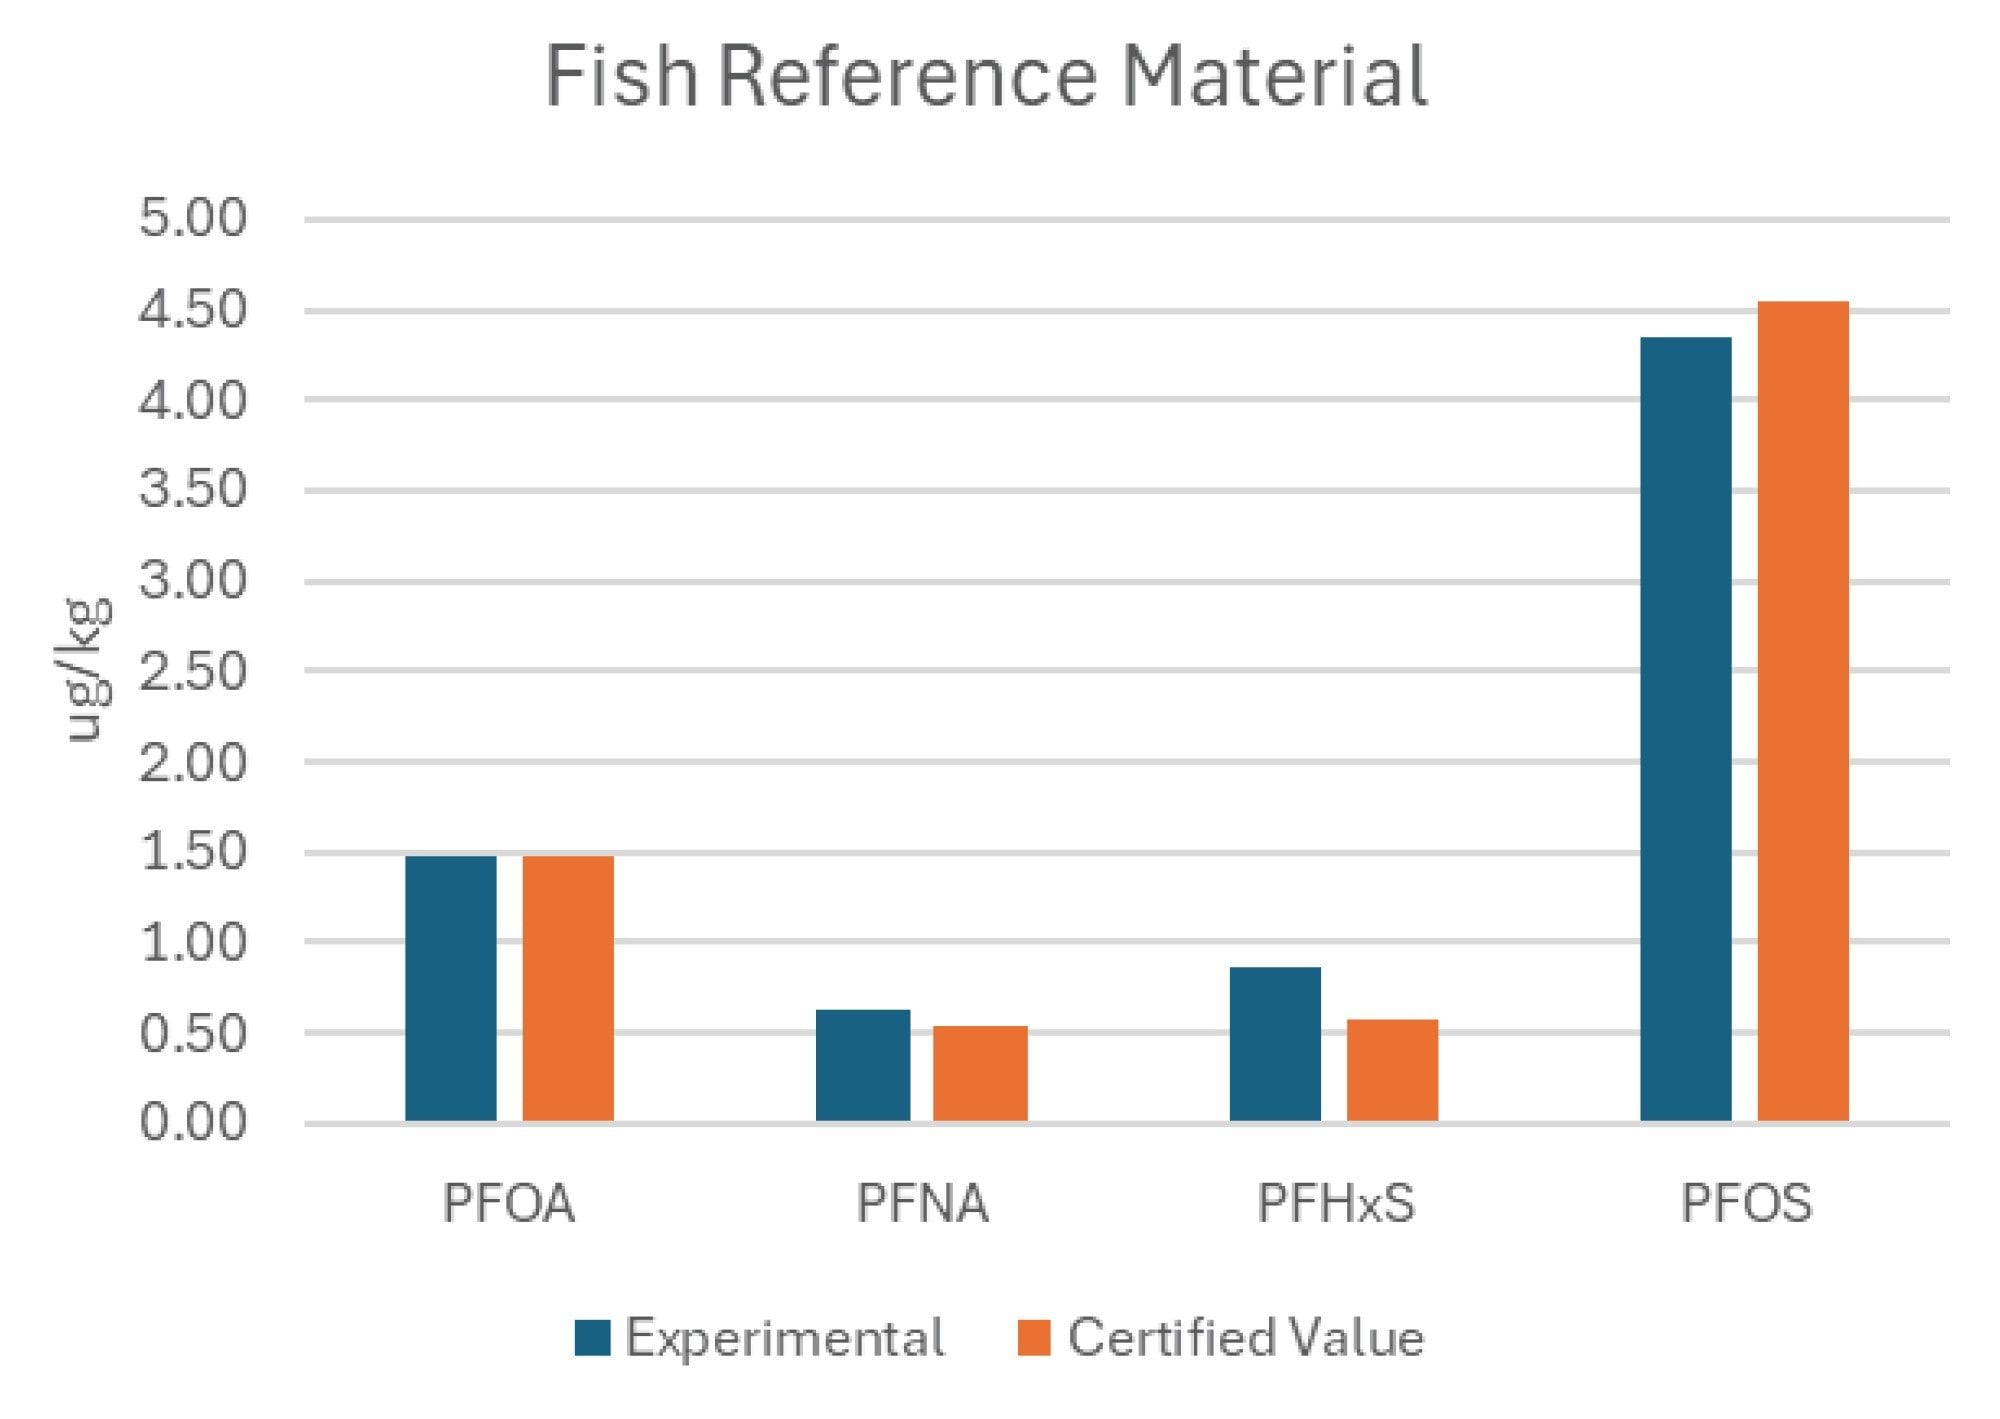
To assess accuracy of the automated sample preparation technique, CRM from FAPAS was processed with the authentic samples. This reference material only provides certified levels for 4 PFAS compounds; perfluorooctanoic acid (PFOA), perfluorononanoic acid (PFNA), perfluorohexane sulfonic acid (PFHxS), and perfluorooctane sulfonate (PFOS). The calculated concentrations determined following the automated sample preparation for the CRM are shown in Figure 5 and compared to the certified values provided with the reference material. The results agreed with the certified values, giving confidence that the automated workflow produces accurate results.
Conclusion
Sample preparation for fish tissues following the EPA 1633 guidance was successfully automated using the CEM EDGE PFAS and PromoChrom SPE-03 systems. The overnight extraction step required when performing this method manually was reduced to about 10 minutes per sample, allowing a batch of 12 to process in approximately 2 hours. Additionally, the SPE clean-up process was also fully automated requiring only a 2-hour hands-free method. The combined procedures using both automated systems allows for the reduction of sample preparation from a 2 day process to one that is easily achievable in an 8 hour shift.
It was shown that neither automated system contributed any PFAS contamination to the samples and is therefore suitable for accurate and confident PFAS analysis even at trace levels. Extracted internal standard and fortified native PFAS recoveries in salmon, tuna and shrimp were well above the required minimum recovery values and shown to be equivalent to the manual process previously evaluated. Additionally, calculated concentration values for a fish reference material closely matched expected results, reinforcing confidence in method accuracy. The data demonstrates that using automated pressurized liquid extraction in series with automated SPE extraction is equivalent to processing tissue samples manually, giving laboratories more flexibility in sample handling while increasing sample capacity for EPA 1633.
References
- US Environmental Protection Agency. EPA 1633A: Analysis of Per- and Polyfluoroalkyl Substances (PFAS) in Aqueous, Solid, Biosolids, and Tissue Samples by LC-MS/MS. December 2024.
- K Organtini, K Rosnack, C Plummer, P Hancock, O Burt. Analysis of Per- and Polyfluoroalkyl Substances (PFAS) in Accordance with EPA 1633 Part 3: Analysis of Soil and Tissue. Waters Application Note 720008230. 2024.
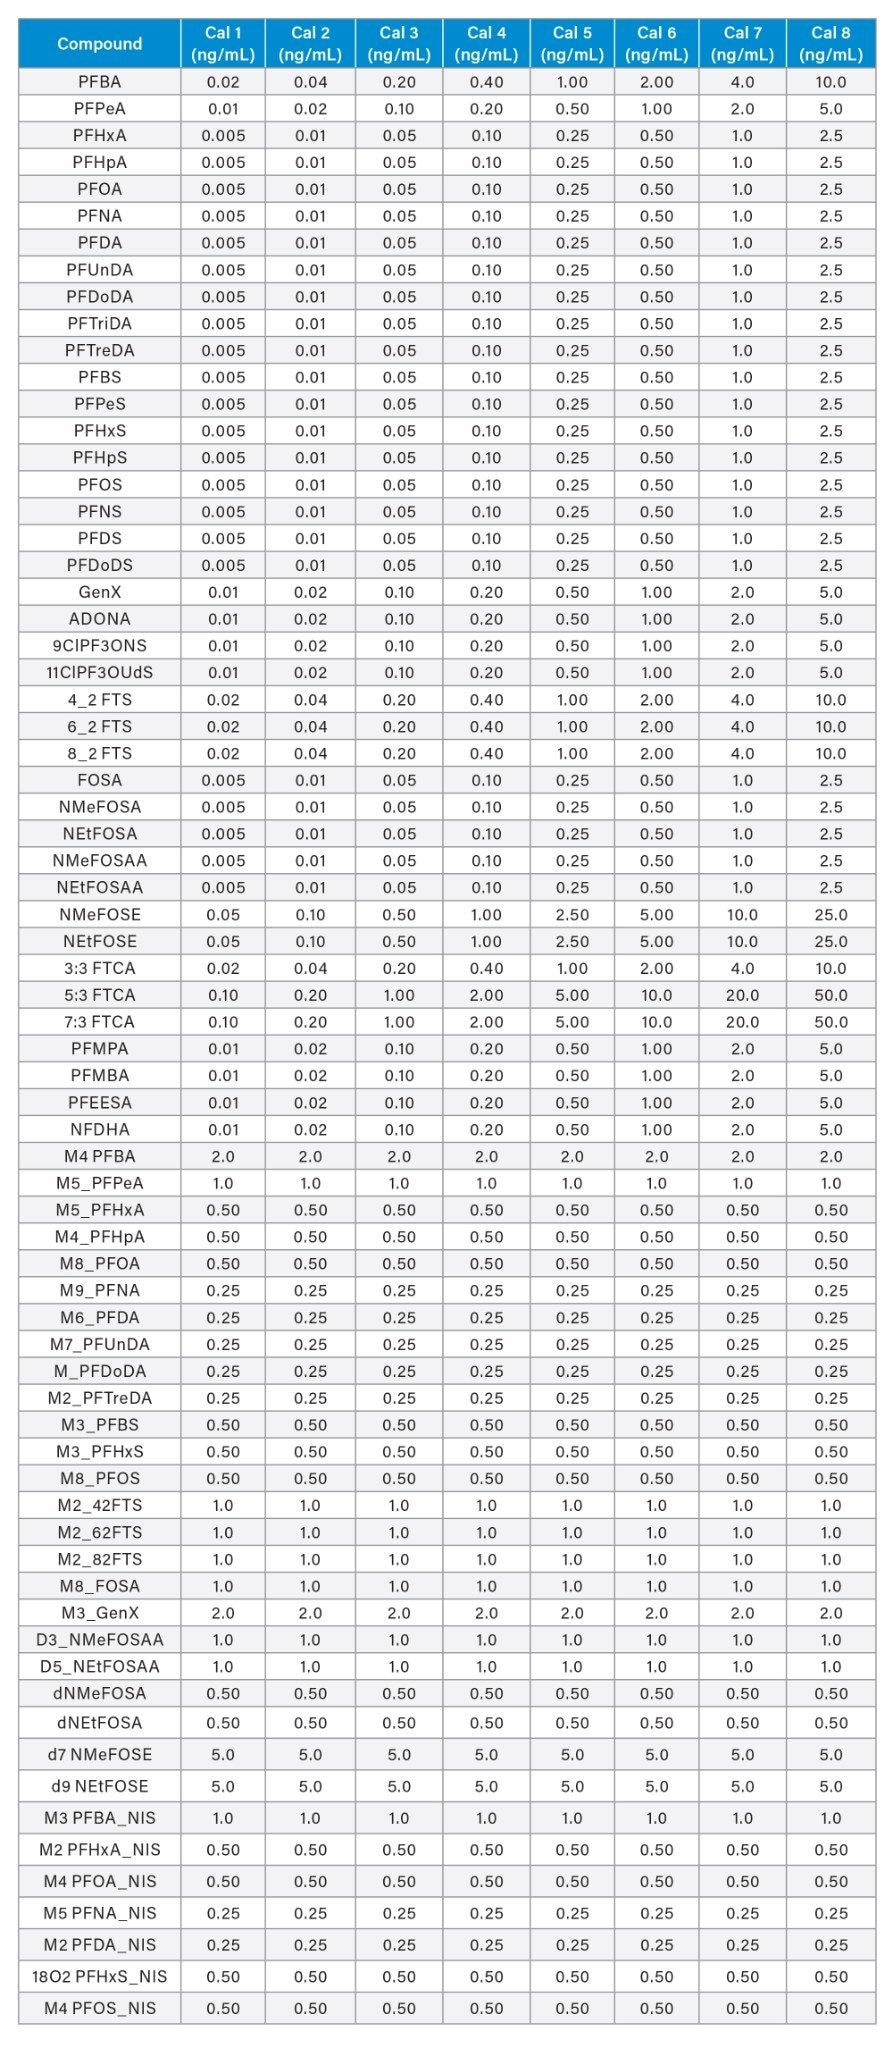
Appendix Table 1: Calibration curve range used for PFAS analysis of EPA 1633 compounds in fish samples on the Xevo TQ Absolute Mass Spectrometer.
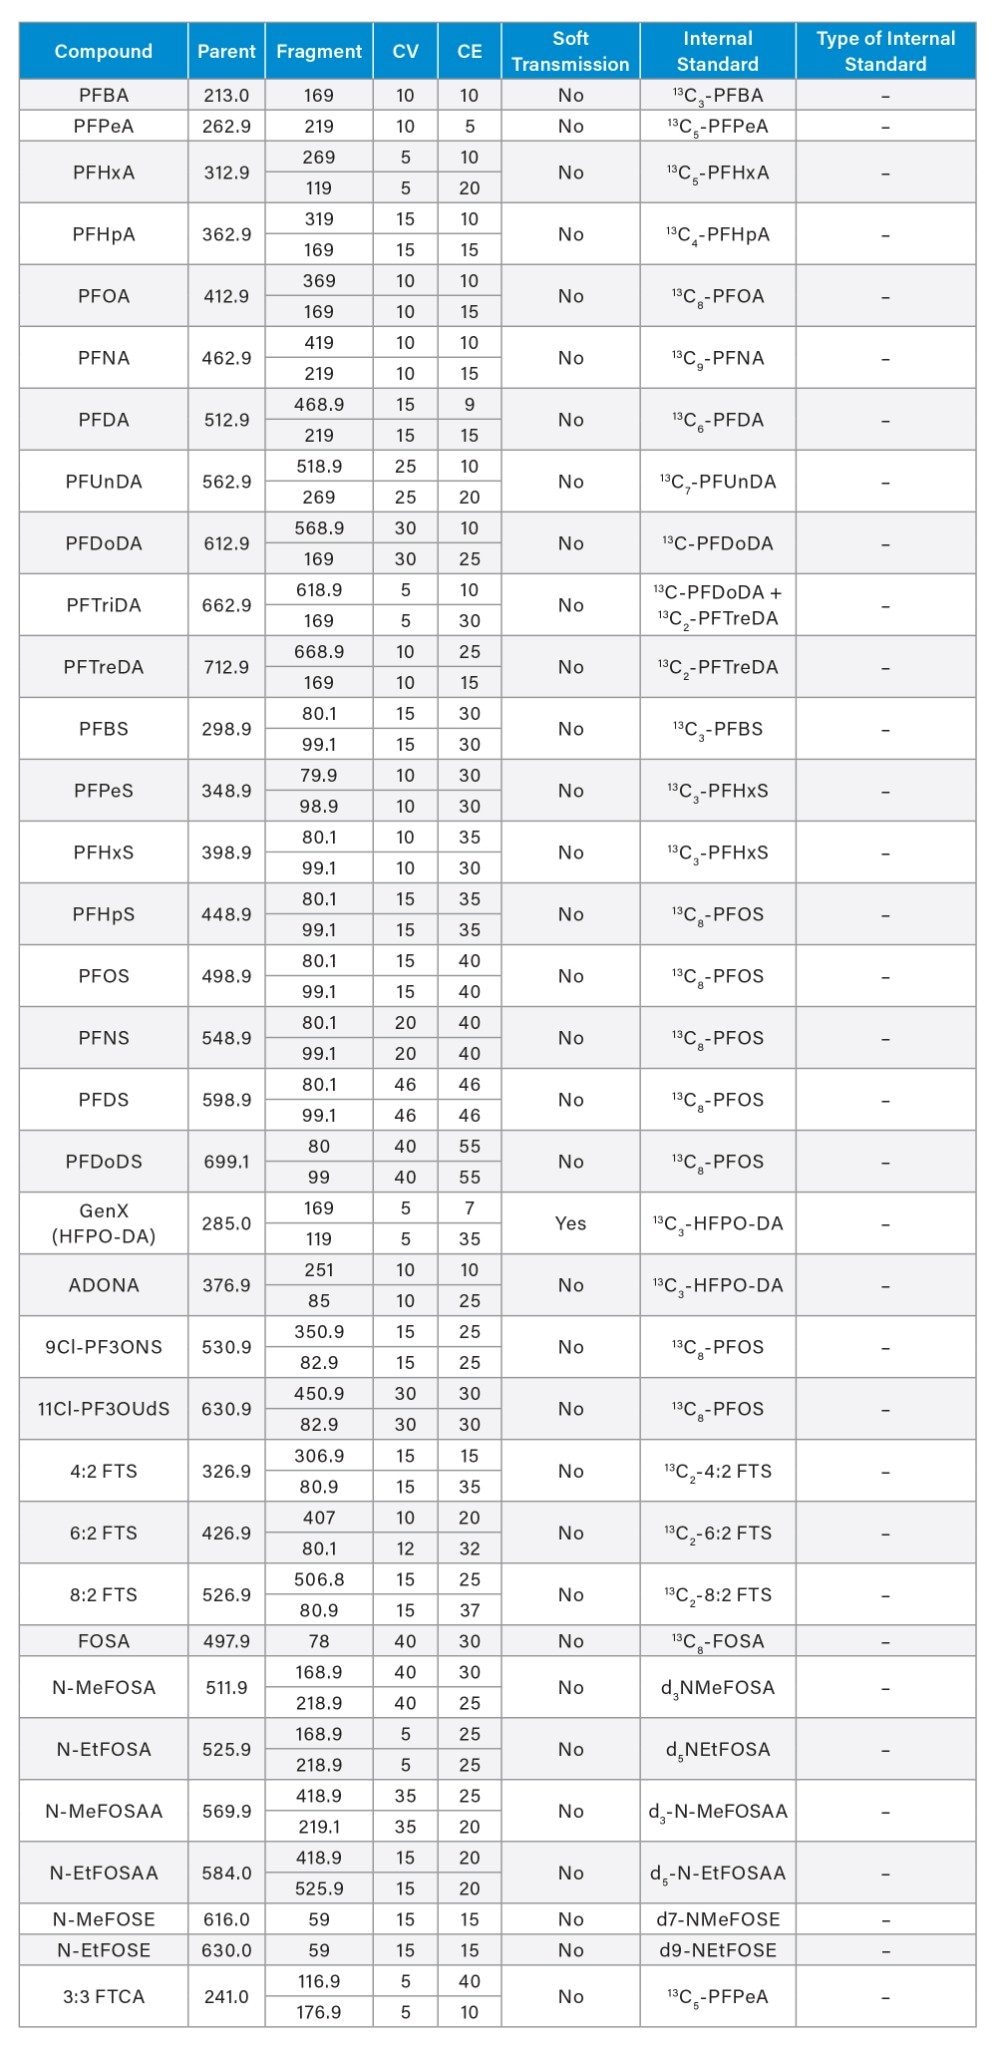
Appendix Table 2. MS Method conditions used for PFAS analysis of EPA 1633 compounds in water samples on the Xevo TQ Absolute Mass Spectrometer.
720009201, January 2026