Alkaline-hydrolysis Method for PFAS in Textiles and Textiles Products by Xevo™ TQ-S micro with ACQUITY™ UPLC™ H-Class Plus System
Meena Mariappana, Pavan Kumar Kb, Padmakar Waghb, Peter Hancockb
a TÜV SÜD, Bengaluru-India
b Waters Corporation, United States
Published on June 23, 2026
Abstract
This study describes the prevention and reduction of contamination in LC-MS/MS systems by improving sample preparation for the analysis of per- and polyfluoroalkyl substances (PFAS) including side chain fluorinated polymer in chemically processed textiles, coated textiles and textile products. Specifically, it addresses the extraction of PFAS in the C4–C5, C6–C8 and C9–C14 categories, including their salts, derivatives and related substances. Conventional methanol-based extraction has been found inadequate for detecting side-chain fluorinated polymers. Therefore, the alkaline hydrolysis method from EN 17681-1:2025 has been optimized for sample extraction and modified liquid chromatographic conditions with the use of a divert valve function based on the retention time of the earliest eluting analyte. This approach yields a clear extract that minimizes matrix, reagent-related interferences and protects the inlet of the mass spectrometer from blockages, deposition and contamination. The optimized method enhances the stability of the extract in the autosampler for over 24 hours, improves baseline quality and significantly reduces the matrix load across the chromatographic and detection pathways. When applied to the Xevo TQ-S micro Mass Spectrometer with the ACQUITY UPLC™ H-Class Plus LC-MS/MS System, the method achieved linear calibration across the range of 0.5-50 ng/mL and demonstrated analyte recoveries for 30 PFAS compounds within the range of 60-110% ensuring reliable and reproducible quantification even in complex textile matrices. It has also been observed that the enhanced response of the FTS compounds, resulting in apparent recoveries exceeding 150%, may have been an analytical artifact associated with the multi-component mix analyzed within a single run or enhanced ionization with co-extracted components of the matrix.
Benefits
- Alkaline hydrolysis method (EN 17681-1:2025) used for preparing textiles, coated textiles and textile products for PFAS analysis allowed the inclusion of side-chain fluorinated polymers
- Extraction method provided significant advantages in handling complex textile matrices by creating clear extracts free from dispersions, settleable solids and particulates
- Protected the high-value LC-MS/MS components from potential damage
- The method improved analytical sensitivity, reproducibility and accuracy, enabled cost-effective and time-efficient PFAS analysis maintained high analytical quality even for challenging high-matrix samples
Introduction
Many PFAS are linked to health concerns because of their ability to interfere with the body’s hormone systems, acting as endocrine disruptors also, linked to other toxic effects. Since textiles come into direct and prolonged contact with the skin, there is an increased risk of human exposure—especially for babies and children.4 In addition, PFAS pose significant environmental concerns. These “forever chemicals” do not readily break down and can be released during manufacturing, washing and disposal, allowing them to enter water pathways and persist in the environment. As a result, testing for PFAS has become increasingly important in the textile industry to demonstrate supply chain transparency, build consumer trust and protect brand reputation
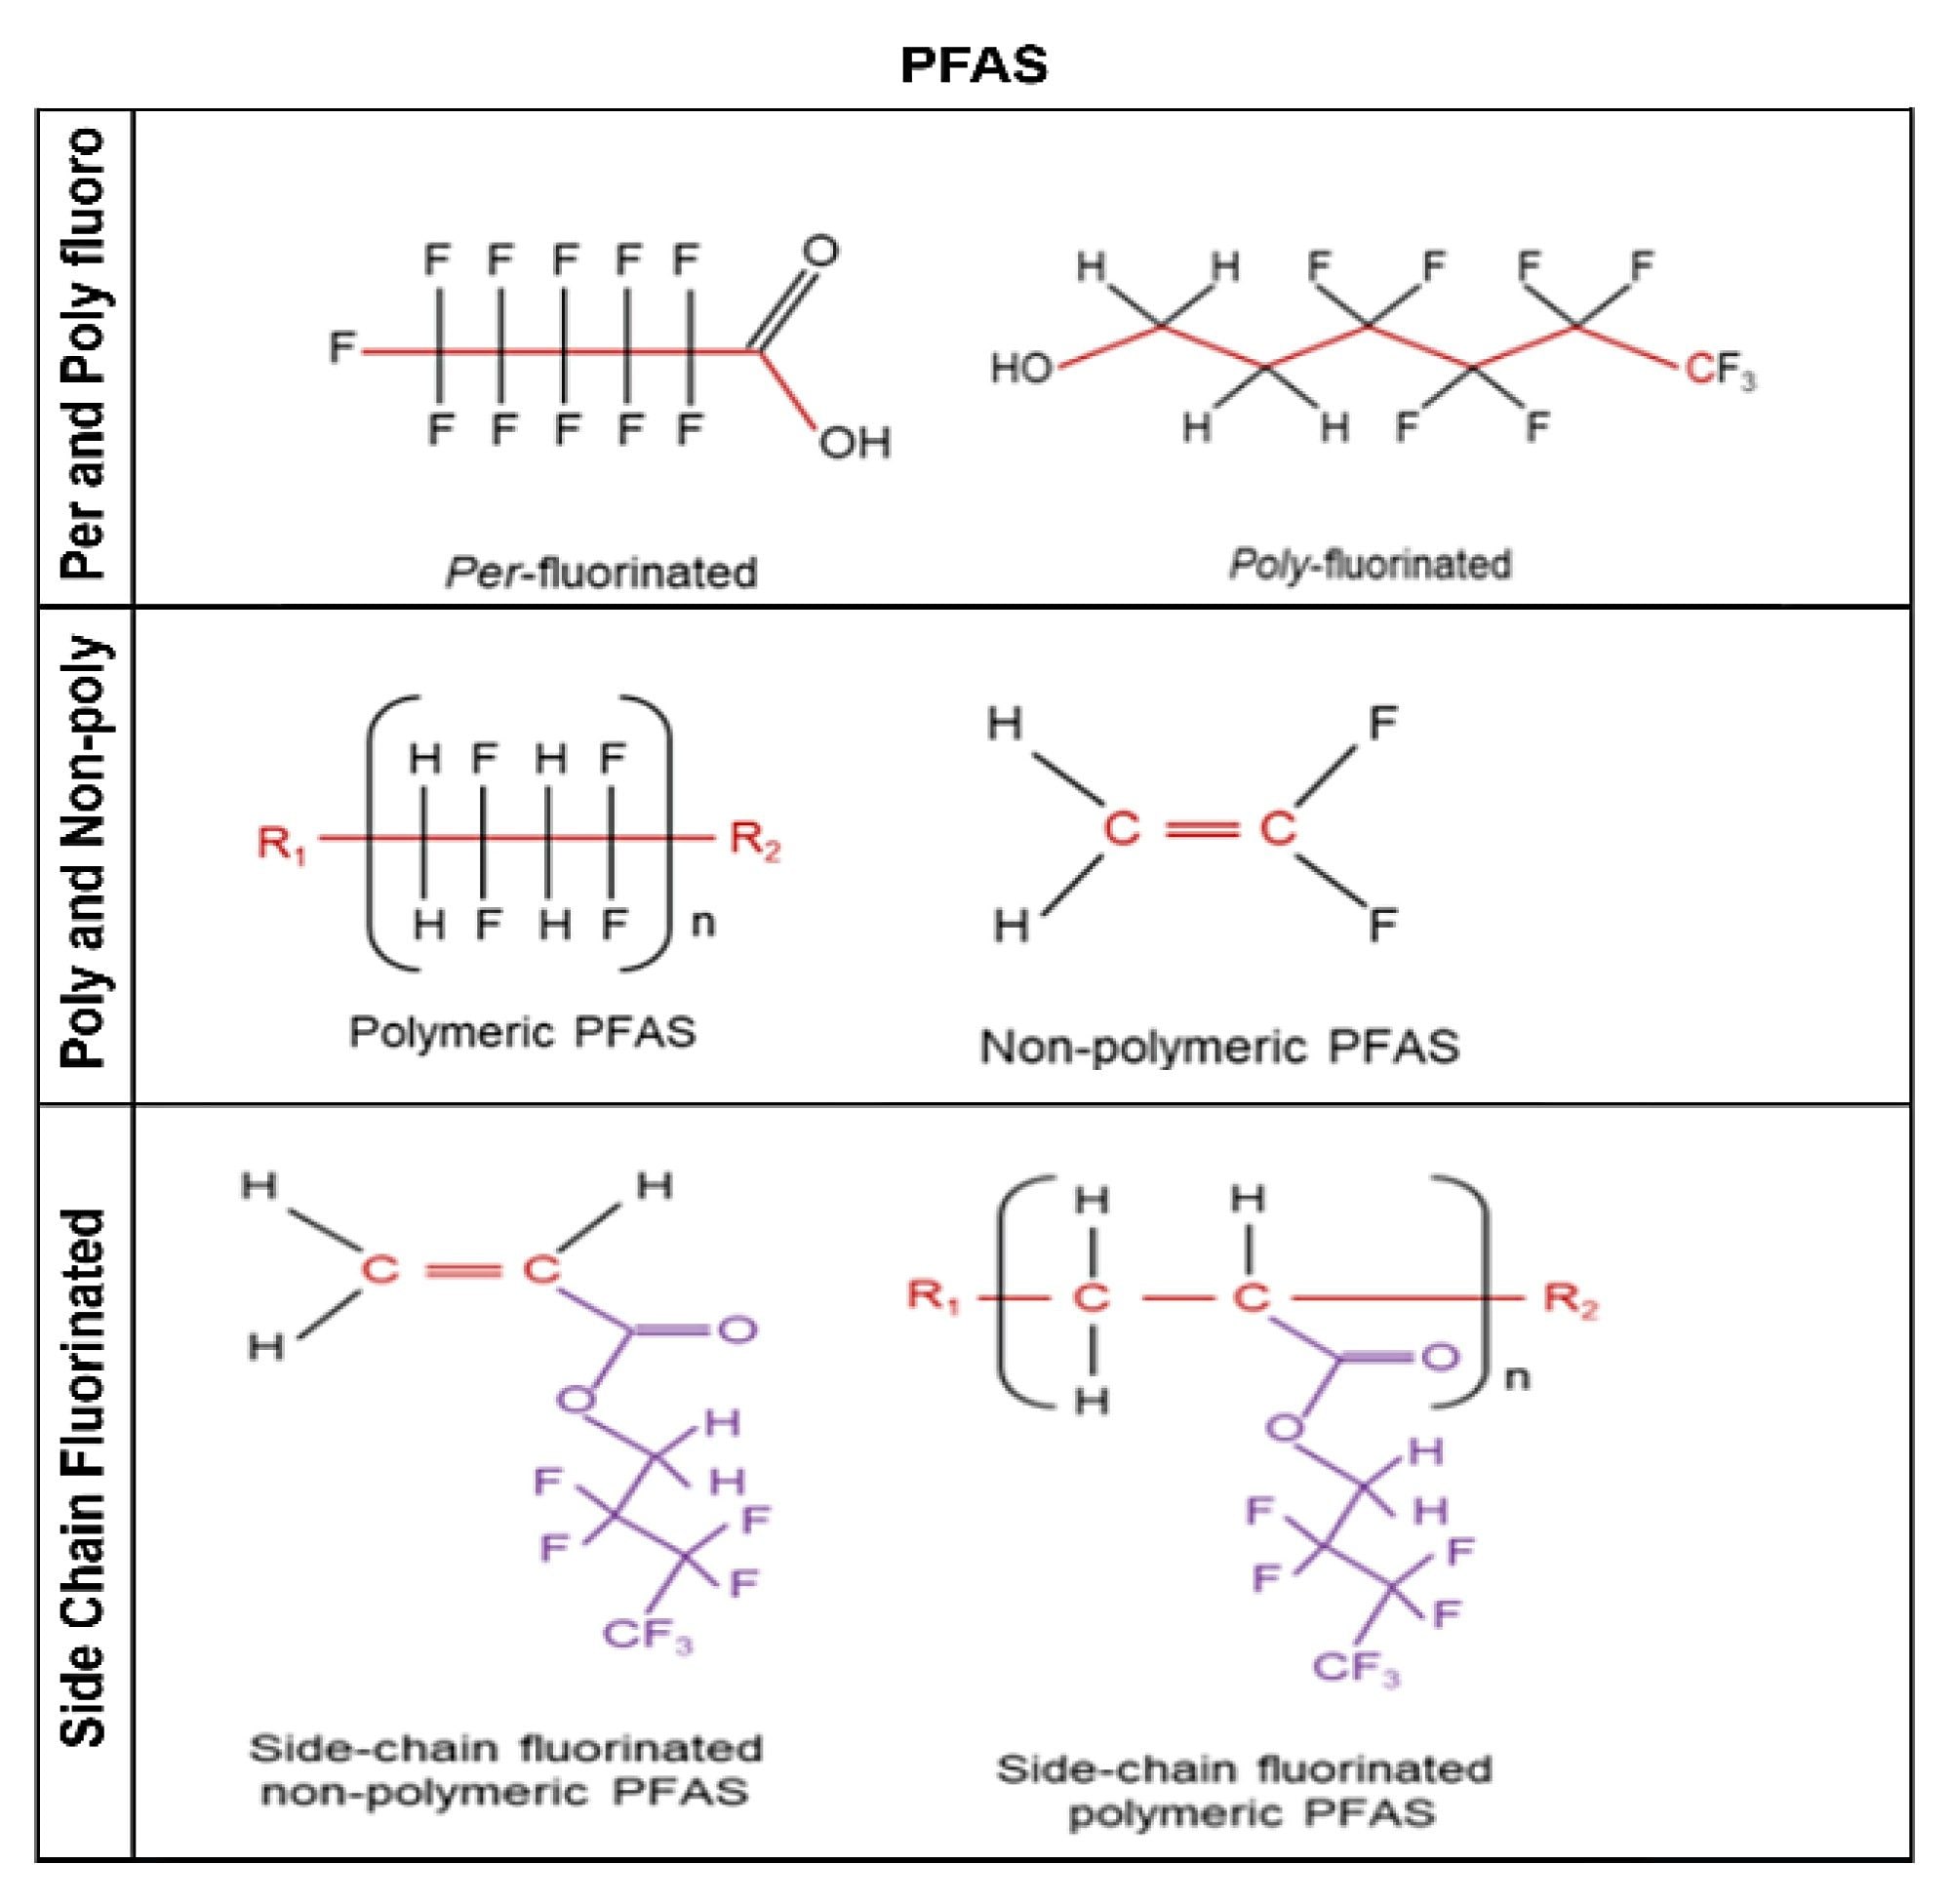
Synthetic fluorinated chemicals are categorized into two main groups - non-polymeric PFAS and polymeric PFAS, known for their use as water and grease repellent, heat resistant finishes in textiles, upholstery, leather, apparel, carpet and other industrial applications such as packaging, firefighting foams, non-stick cookware, etc. (Figure 1). PFAS are fluorinated substances contain at least one fully fluorinated methyl or methylene carbon atom (without any H/Cl/Br/I atom attached to it), i.e. with a few noted exceptions, any chemical with at least a perfluorinated methyl group or a perfluorinated methylene group.2 PFAS are classified as long chain and short chain based on their perfluorinated carbon chain length. Short chain fluorinated polymers encompasses a diverse range of chemistries, categorized according to their generic chemical and repeating units structures. Few examples are: derivatives of fluorotelomers, perfluoropolyethers with varying carbon chain lengths and acrylates, epoxylates, urethane, silicones of repeated units based structures.3 Polyfluoroalkyl substances such as fluorotelomer alcohols (FTOHs) contain C–H bonds, rendering them more susceptible to degradation. The ethoxylates in fluorotelomers-methacrylate break down to FTOH whereas polymeric fluorinated urethanes, acrylates break down to PFCAs (non-polymeric and polymeric side chain fluorinated polymers). In contrast, perfluoroalkyl substances such as PFOS and PFOA are extremely persistent due to their fully fluorinated carbon chains.
In alkaline hydrolysis methods, methanolic aqueous sodium hydroxide is used to break down precursor PFAS such as FTOHs, branched side chain PFAS. This process releases terminal perfluorinated carboxylic acids (PFCAs), which can then be measured. However, the efficiency of hydrolysis varies among different PFAS compounds and the presence of interfering substances such as organic matter or other chemicals in the sample matrix can inhibit the cleavage and detection of these analytes.
Experimental
Sample Extraction and Analysis
Sample preparation was conducted on textile and coated textile materials which were spiked with a concentration of 10 µg/kg from 30 PFAS mixed standards and two internal standards, following the procedure described in EN 17681-1:2025.1 The test sample preparation protocol was optimized with specific focus on controlled temperature conditions, extraction time, pH adjustment to near-neutral, high-speed refrigerated centrifugation and deep freeze of the extract as mentioned in Figure 2.
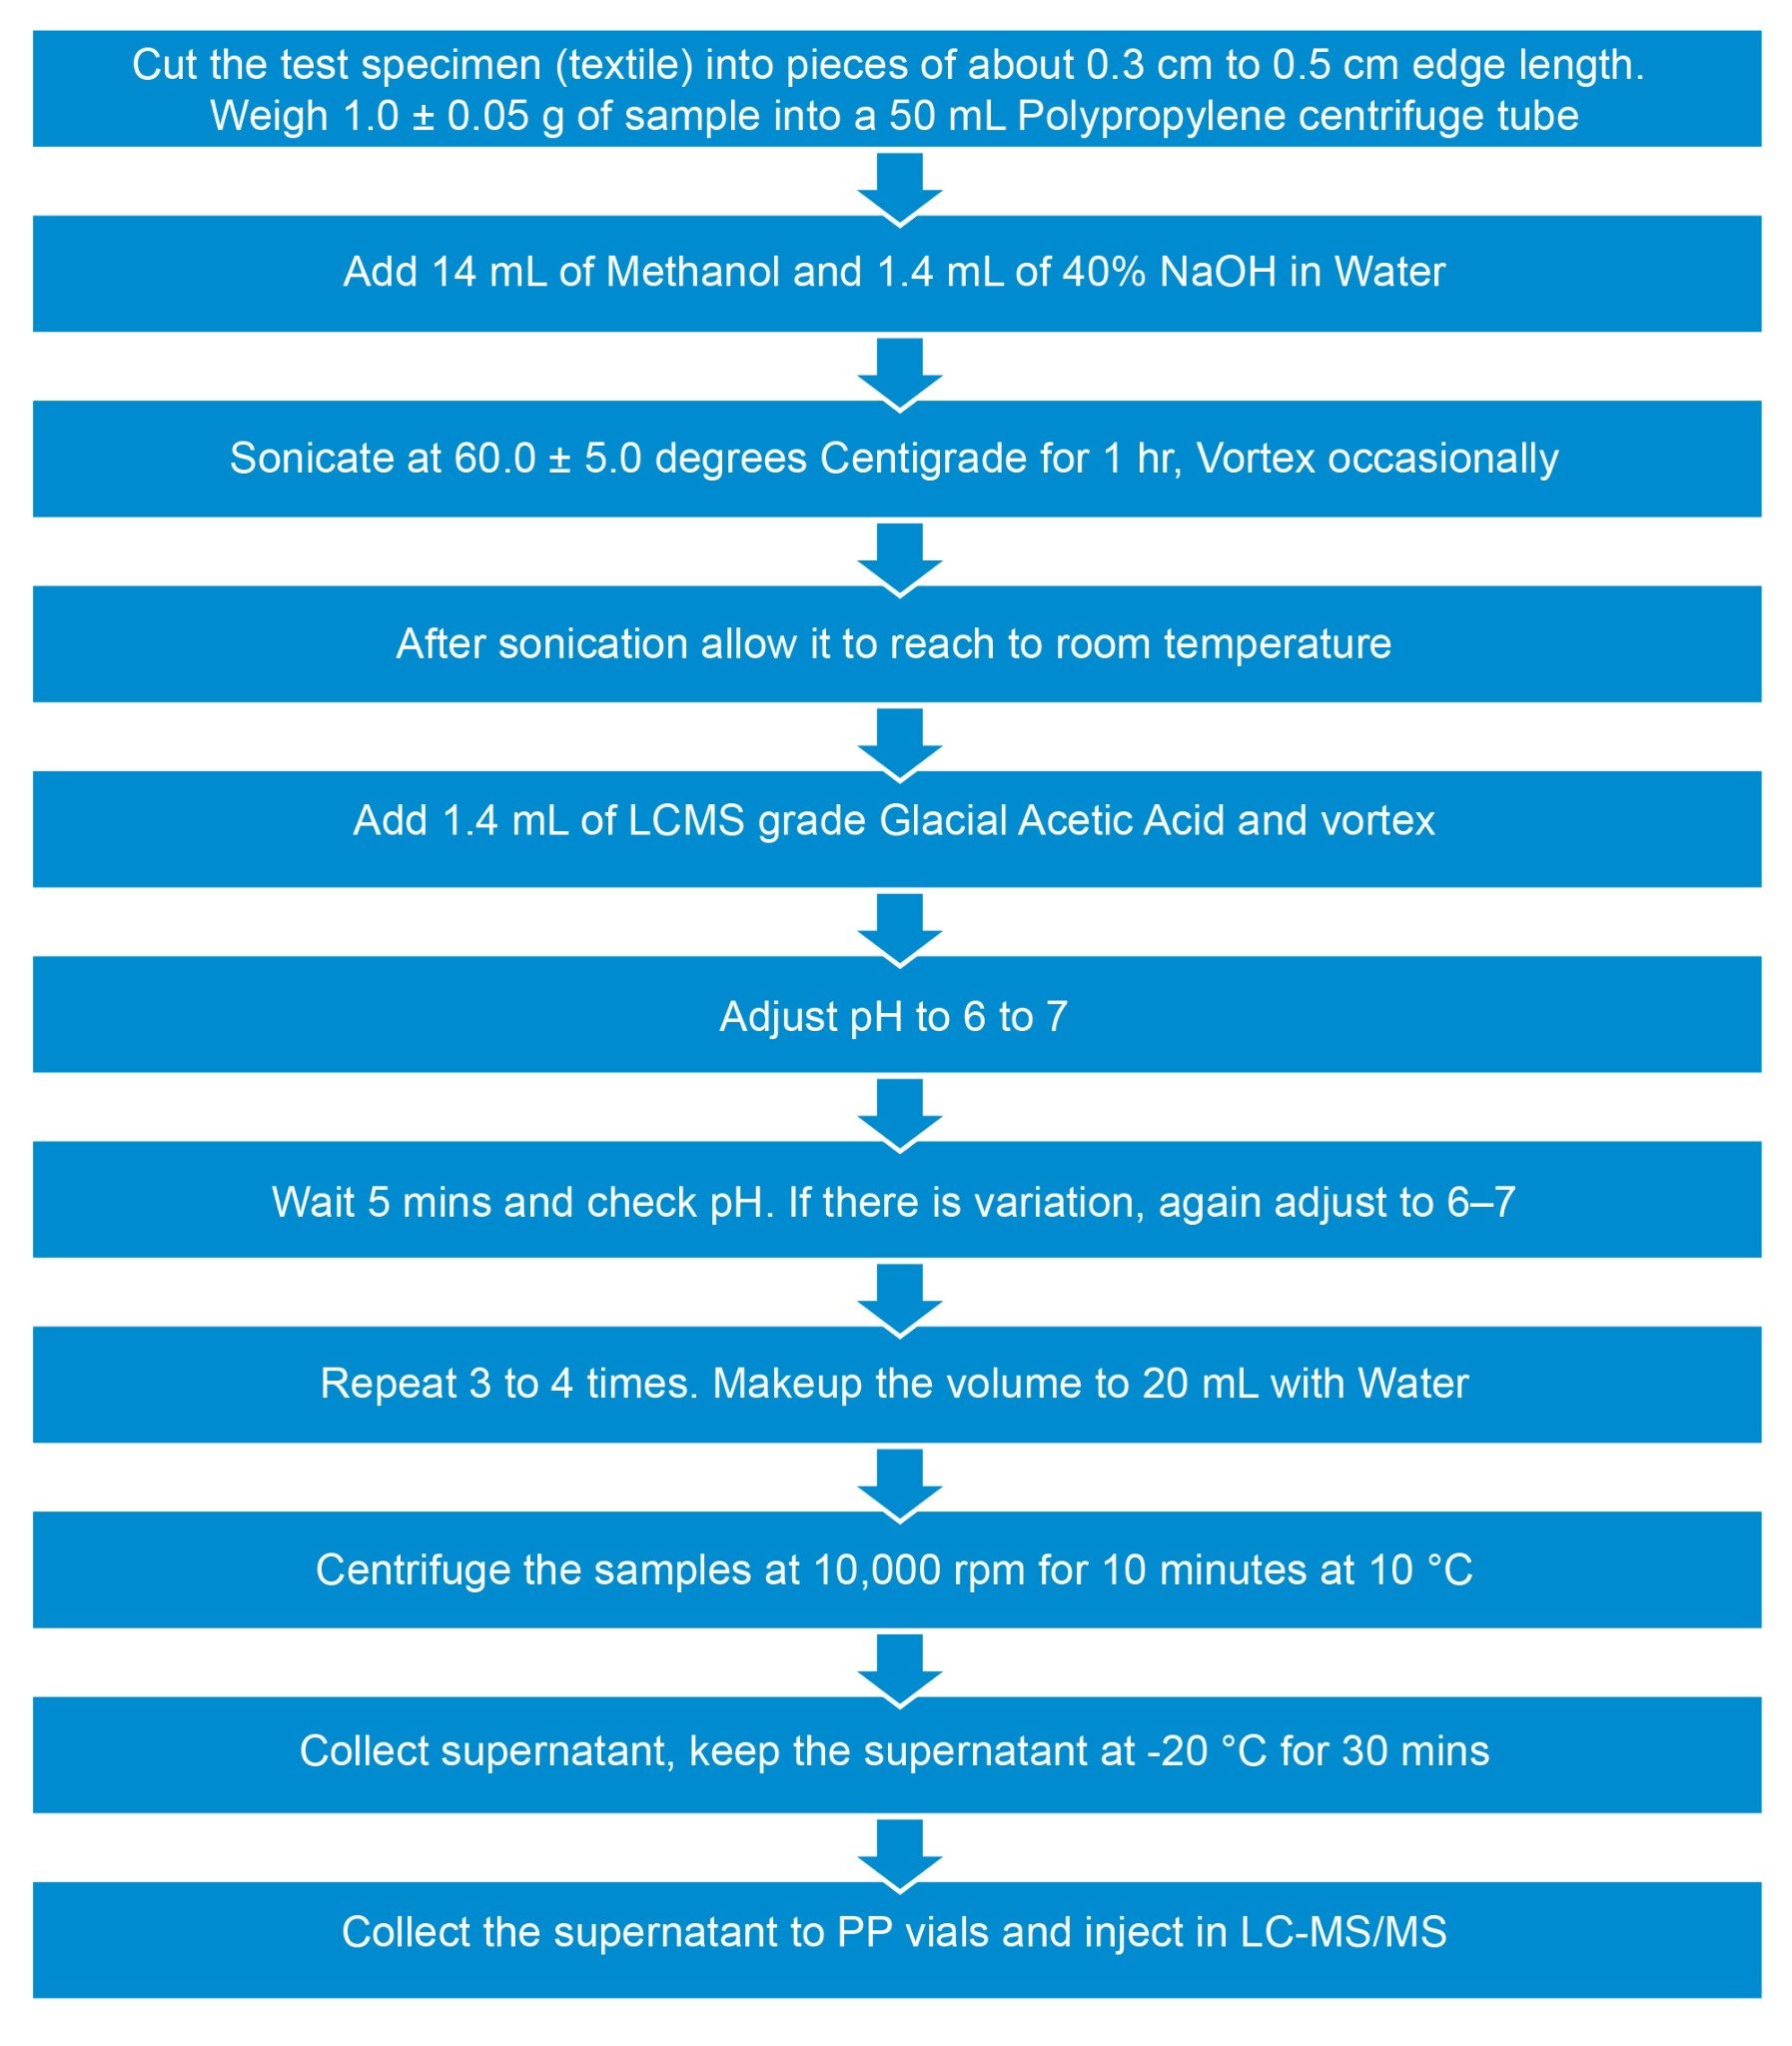
The optimized workflow resulted in a clear extract, minimizing sedimentation or suspension, thereby maintaining stability in the autosampler for extended analysis periods exceeding 24 hours (Figure 2).
Given that textile samples are chemically treated with various processing agents such as bleaching, mercerizing agents, dyes and pigments, crosslinkers, lubricants, light stabilizers, antioxidants, plasticizers, water/oil/soil repellents, preservatives etc., interference may occur. Specifically, mineralization caused by sodium hydroxide can lead to coagulation or coprecipitation during extraction, potentially masking analyte signals or affecting recovery.
LC Conditions
|
LC system: |
ACQUITY UPLC H-Class Plus System and SM-FTN fitted with PFAS kit |
|
Vials: |
Poly Propylene Vials and caps |
|
Column(s): |
XBridge™ BEH™ C18 5 µm Column, 4.6 x 100 mm (p/n: 186003115) |
|
Isolator column: |
ACQUITY BEH C18 AX Column, 5 µm, 2.1 x 100 mm (p/n: 186009407) |
|
Column temperature: |
40 °C |
|
Sample temperature: |
20 °C |
|
Injection volume: |
10 µL |
|
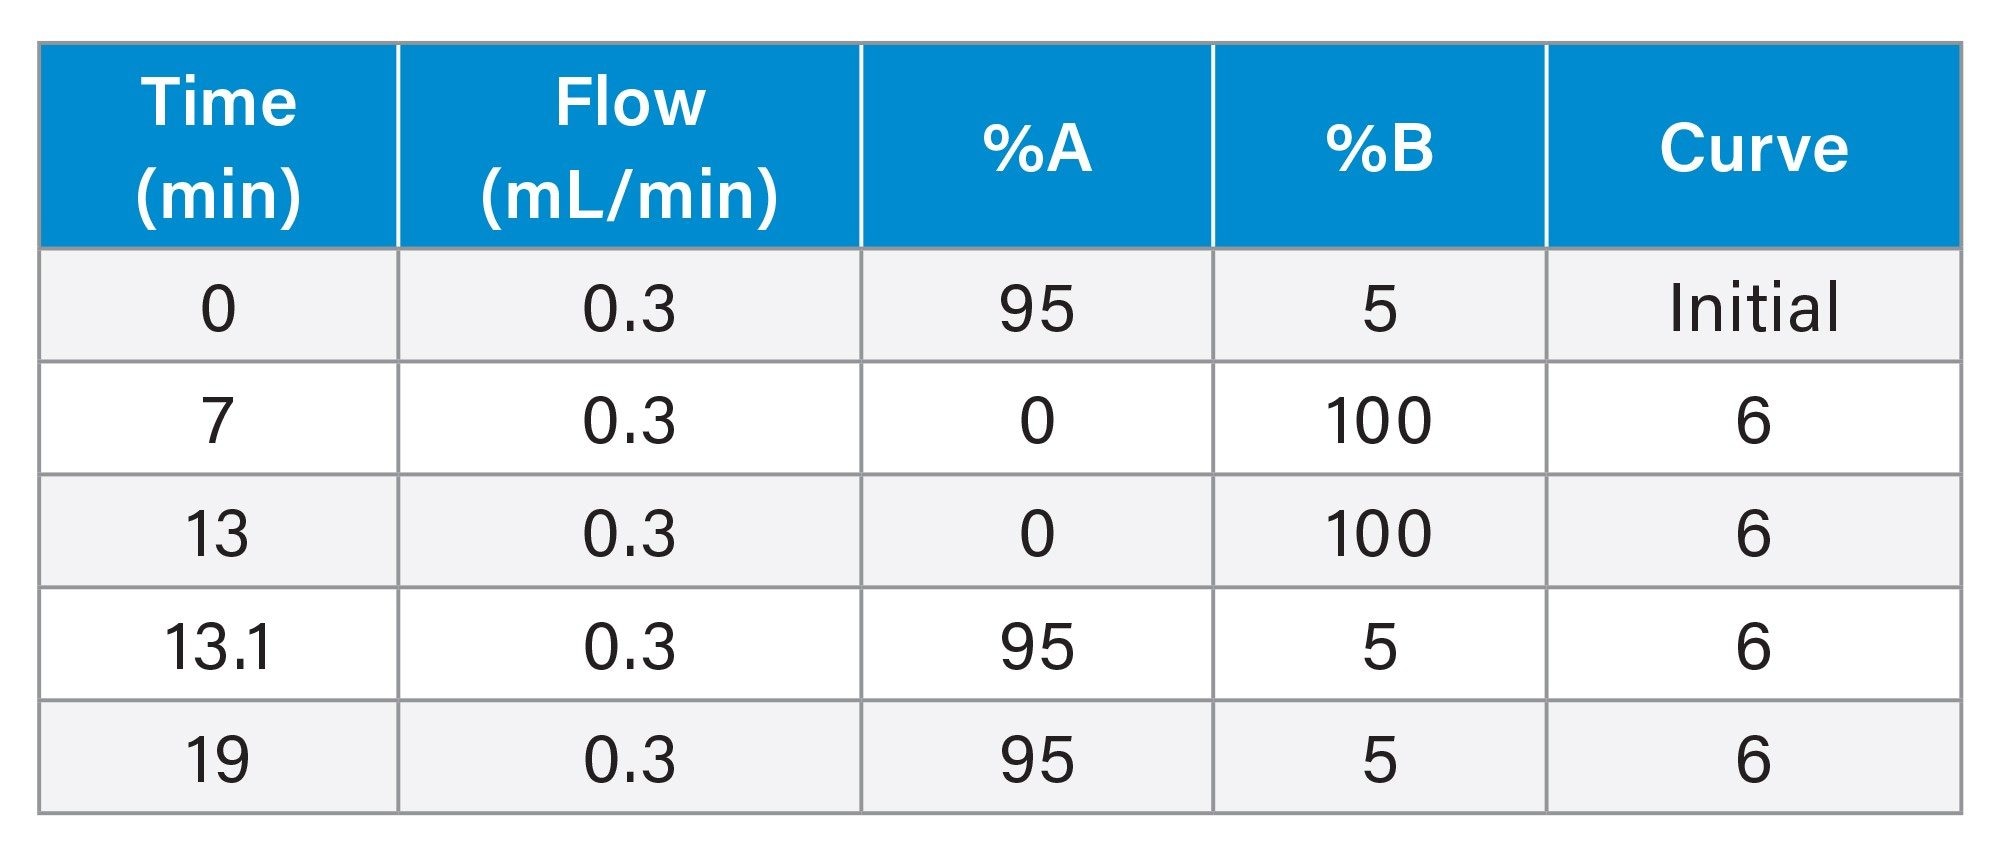
Flow rate: |
0.3 mL/min |
|
Mobile phase A: |
5 mM Ammonium Acetate in Water |
|
Mobile phase B: |
5 mM Ammonium Acetate in Acetonitrile |
Gradient Table
MS Conditions
|
MS system: |
Xevo TQ-S micro Mass Spectrometer |
|
Ionization mode: |
ESI -ve |
|
Acquisition mode: |
MRM |
|
Capillary voltage: |
0.5 kV |
|
Desolvation temperature: |
300 °C |
|
Desolvation gas flow: |
900 L/Hr |
|
Cone gas flow: |
50 L/Hr |
|
Source temperature: |
100 °C |
|
Data management: |
MassLynx™ SCN 1050 |
Results and Discussion
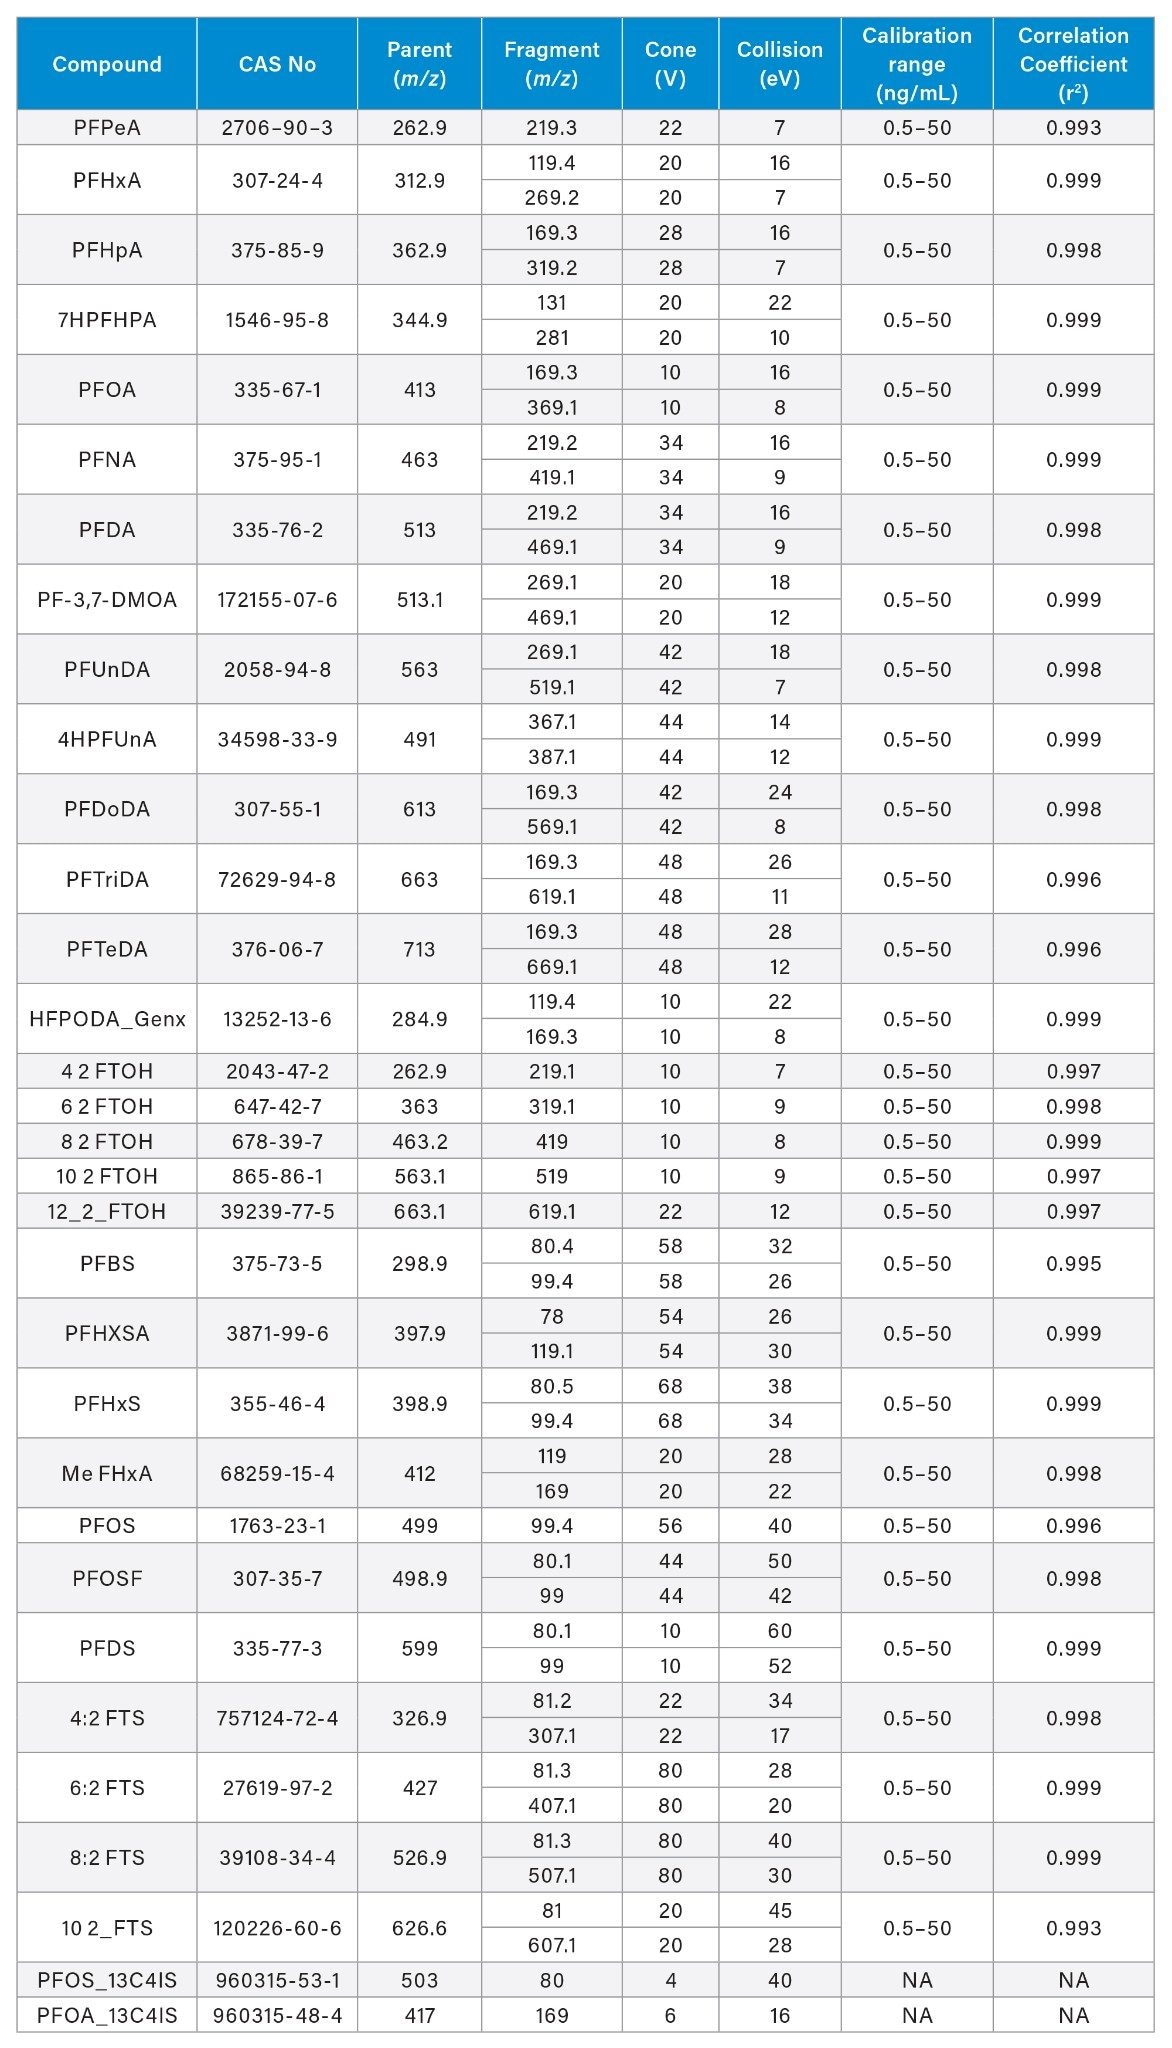
Using the Xevo TQ-S micro Mass Spectrometer, all 30 target PFAS compounds, representing major PFAS classes, were successfully detected within the studied calibration range in matrix, demonstrating good linearity and analytical performance. These findings confirm that the ACQUITY UPLC H-Class Plus System with PFAS kit and Xevo TQ-S micro System is well-suited for the comprehensive analysis of a broad range of PFAS compounds.
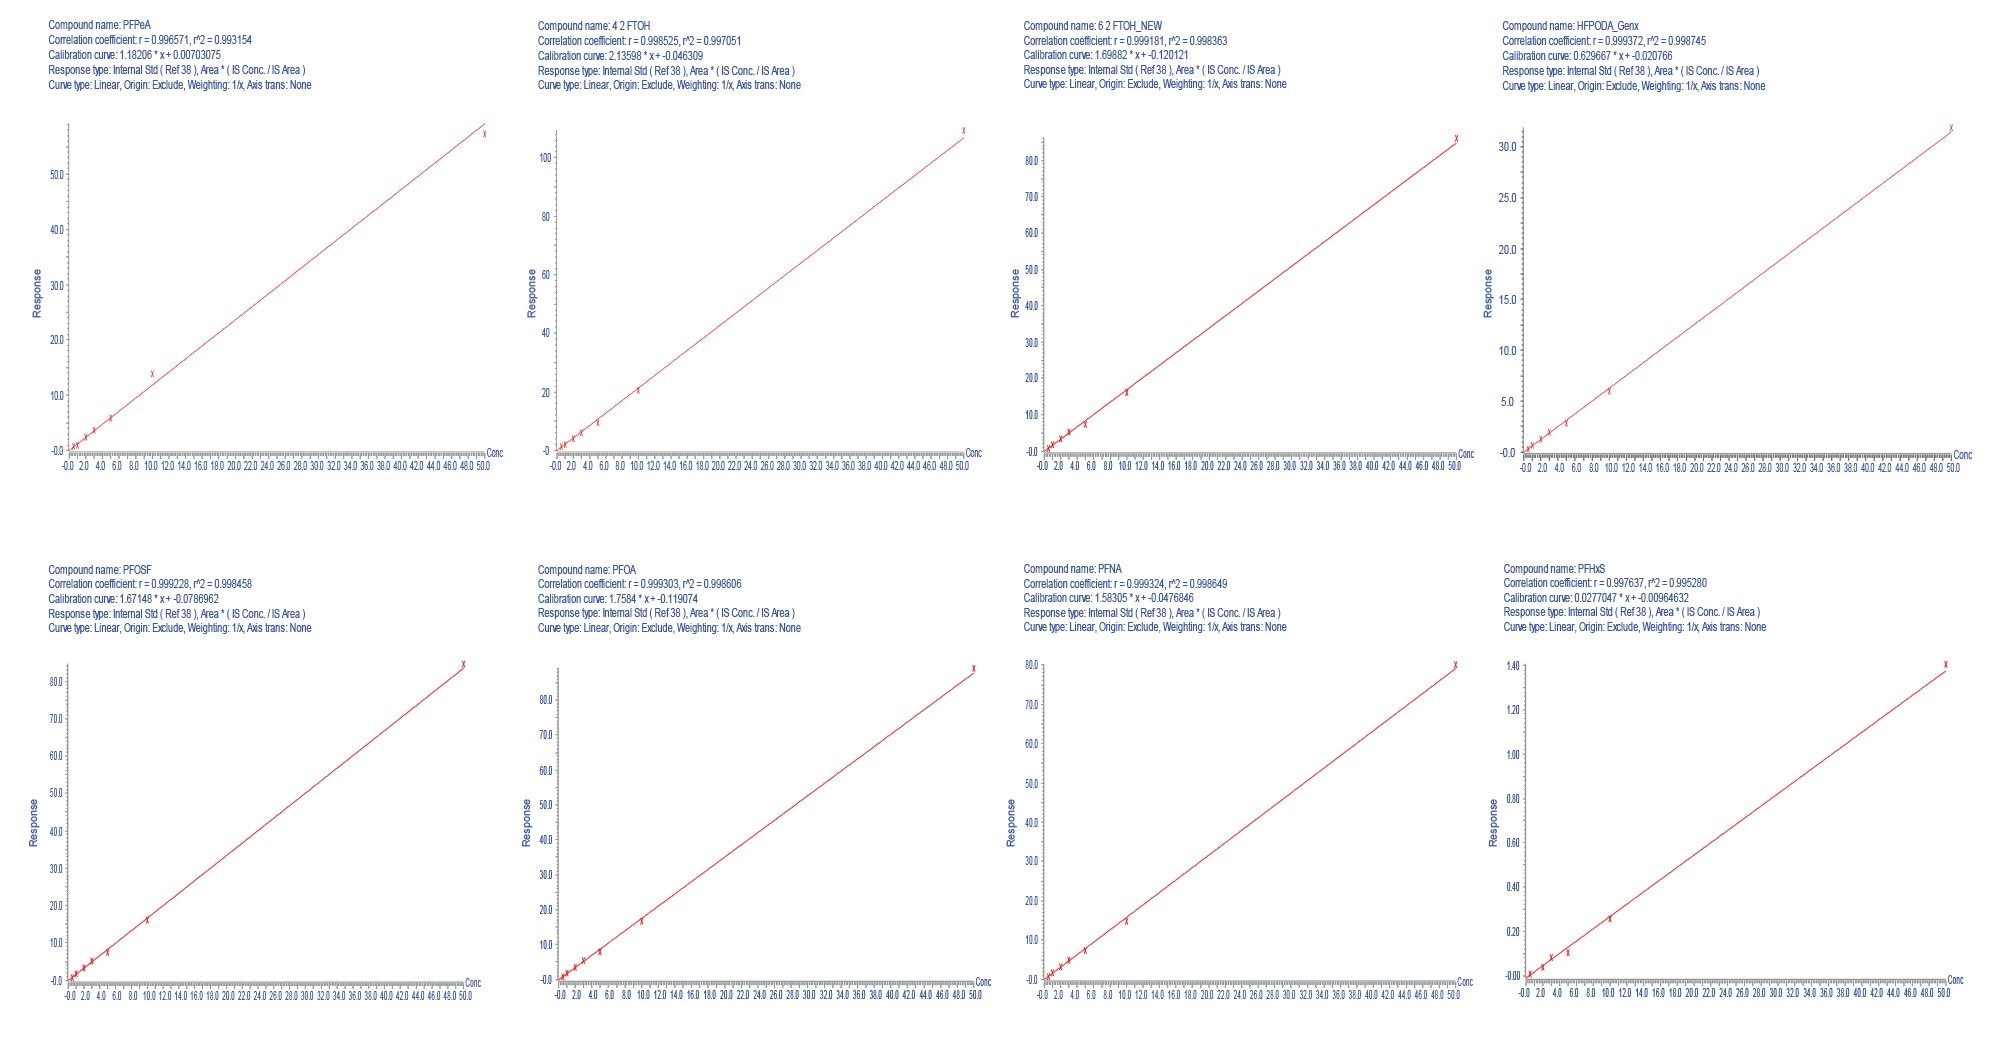
Table 1 summarizes the linearity and coefficient of determination (R²) values for the 30 PFAS analytes, plus two internal standards. The calibration range for the studied compounds was found to be from 0.5 to 50 µg/L. All compounds exhibited excellent linearity with R² values greater than 0.950 and residuals within ±15%, indicating robust quantification across the range. These results highlight the system’s capability to handle complex matrices with consistent and reliable detection of diverse PFAS structures.
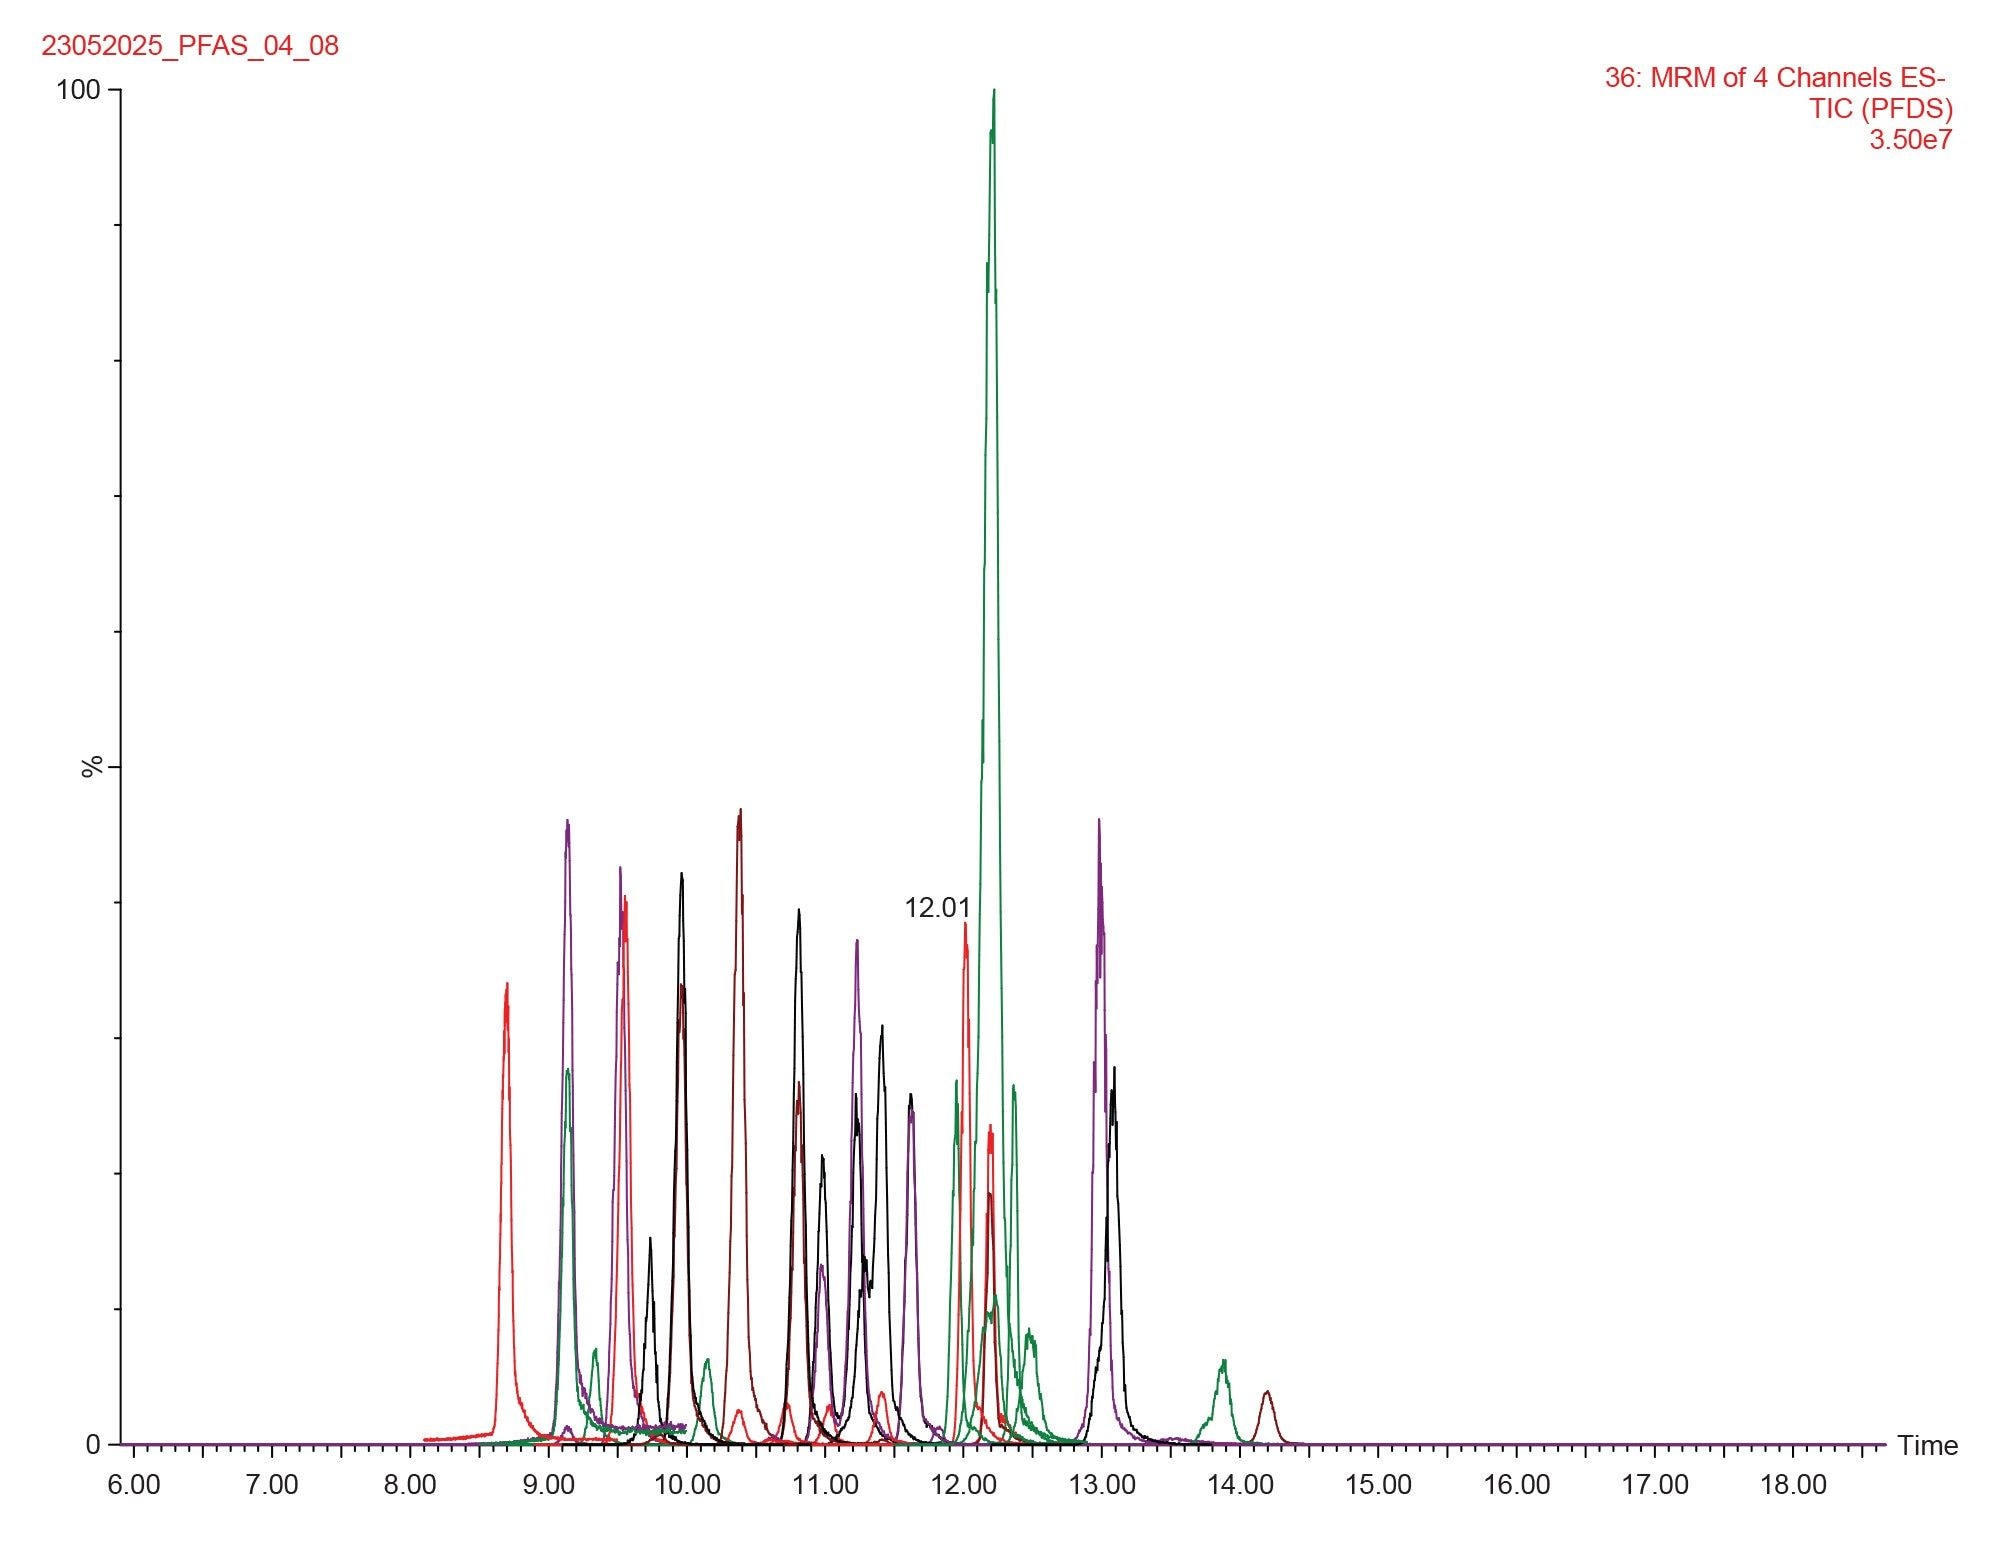
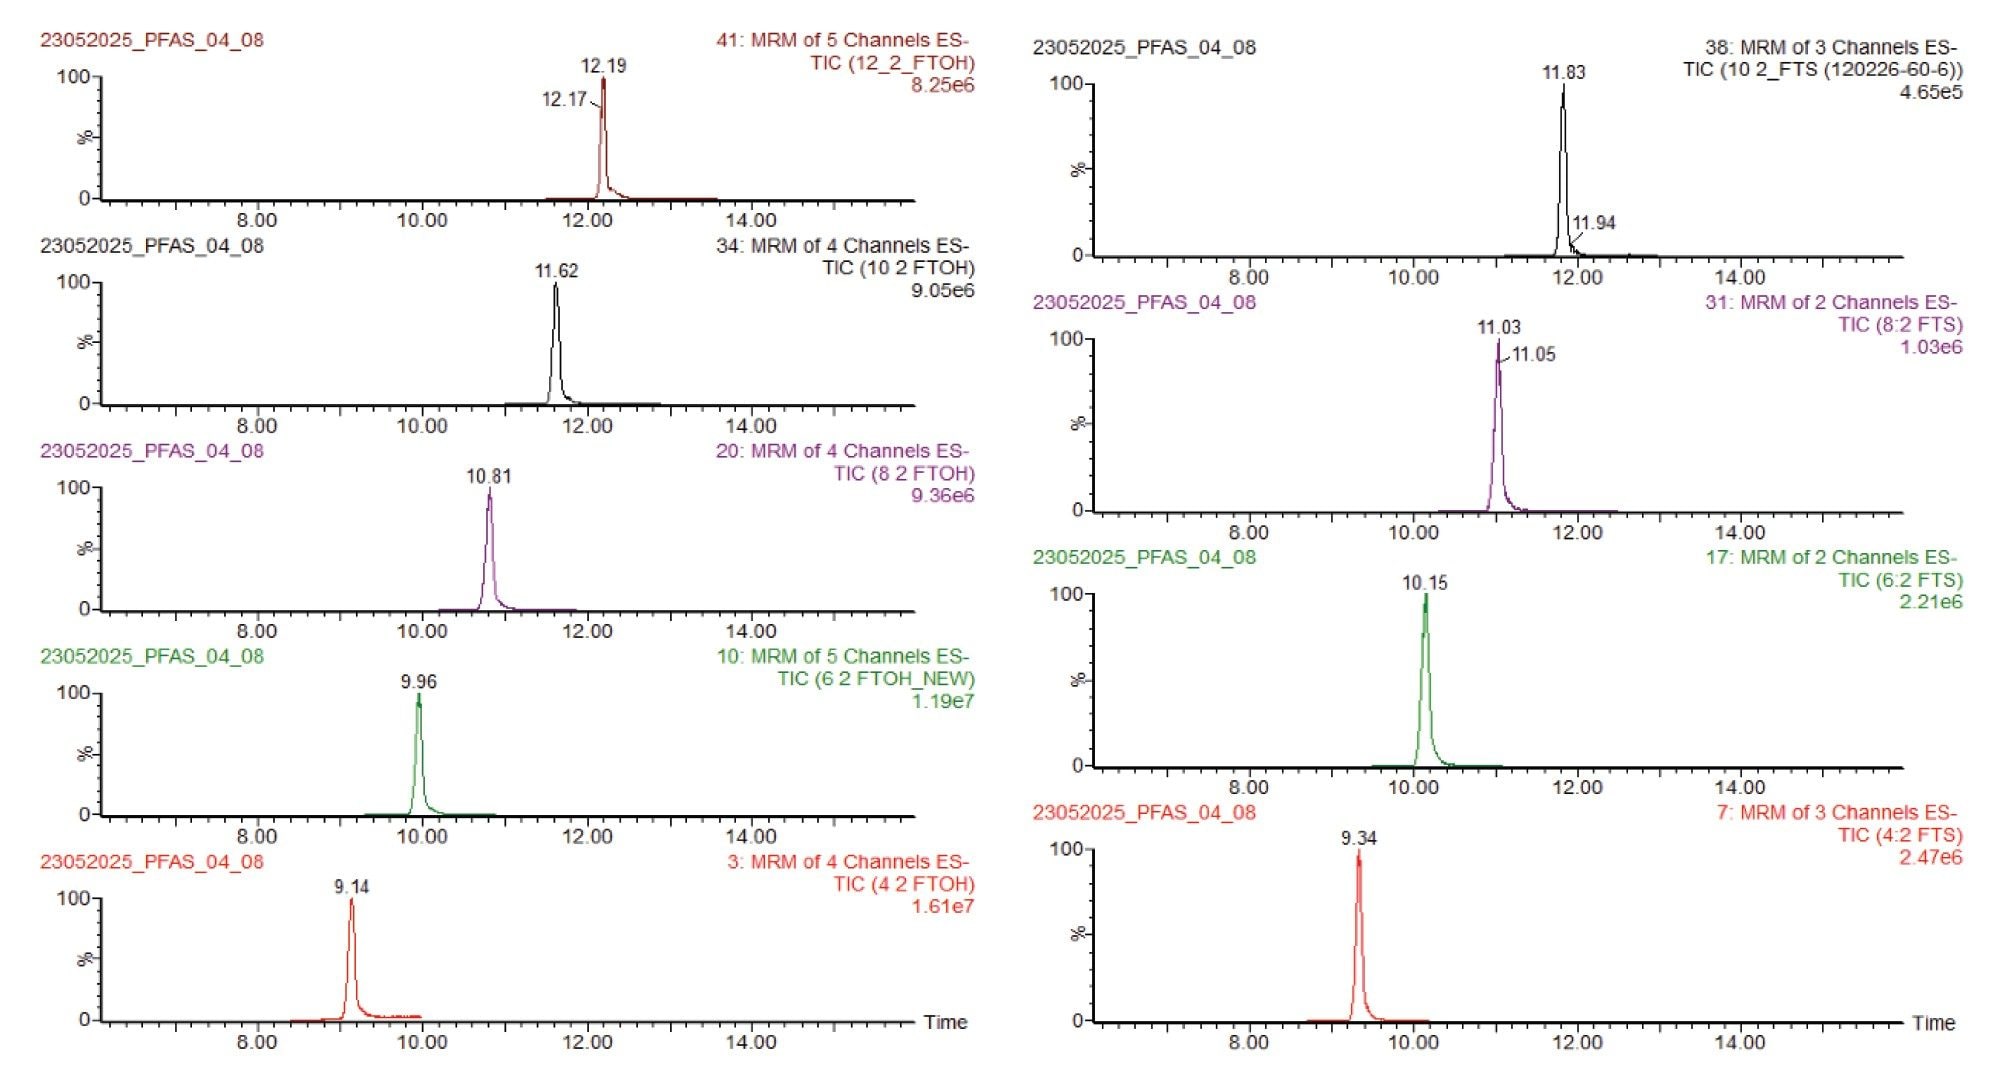
This chromatographic method has impressive separation efficiency for multiple analytes within a short time frame of 18 minutes. Figure 3 illustrates the overall chromatographic separation, and Figure 4 specifically focuses on the separation of two analytes: n:2 FTOH (fluorotelomer alcohol) and n:2 FTS (fluorotelomer sulfonic acid).
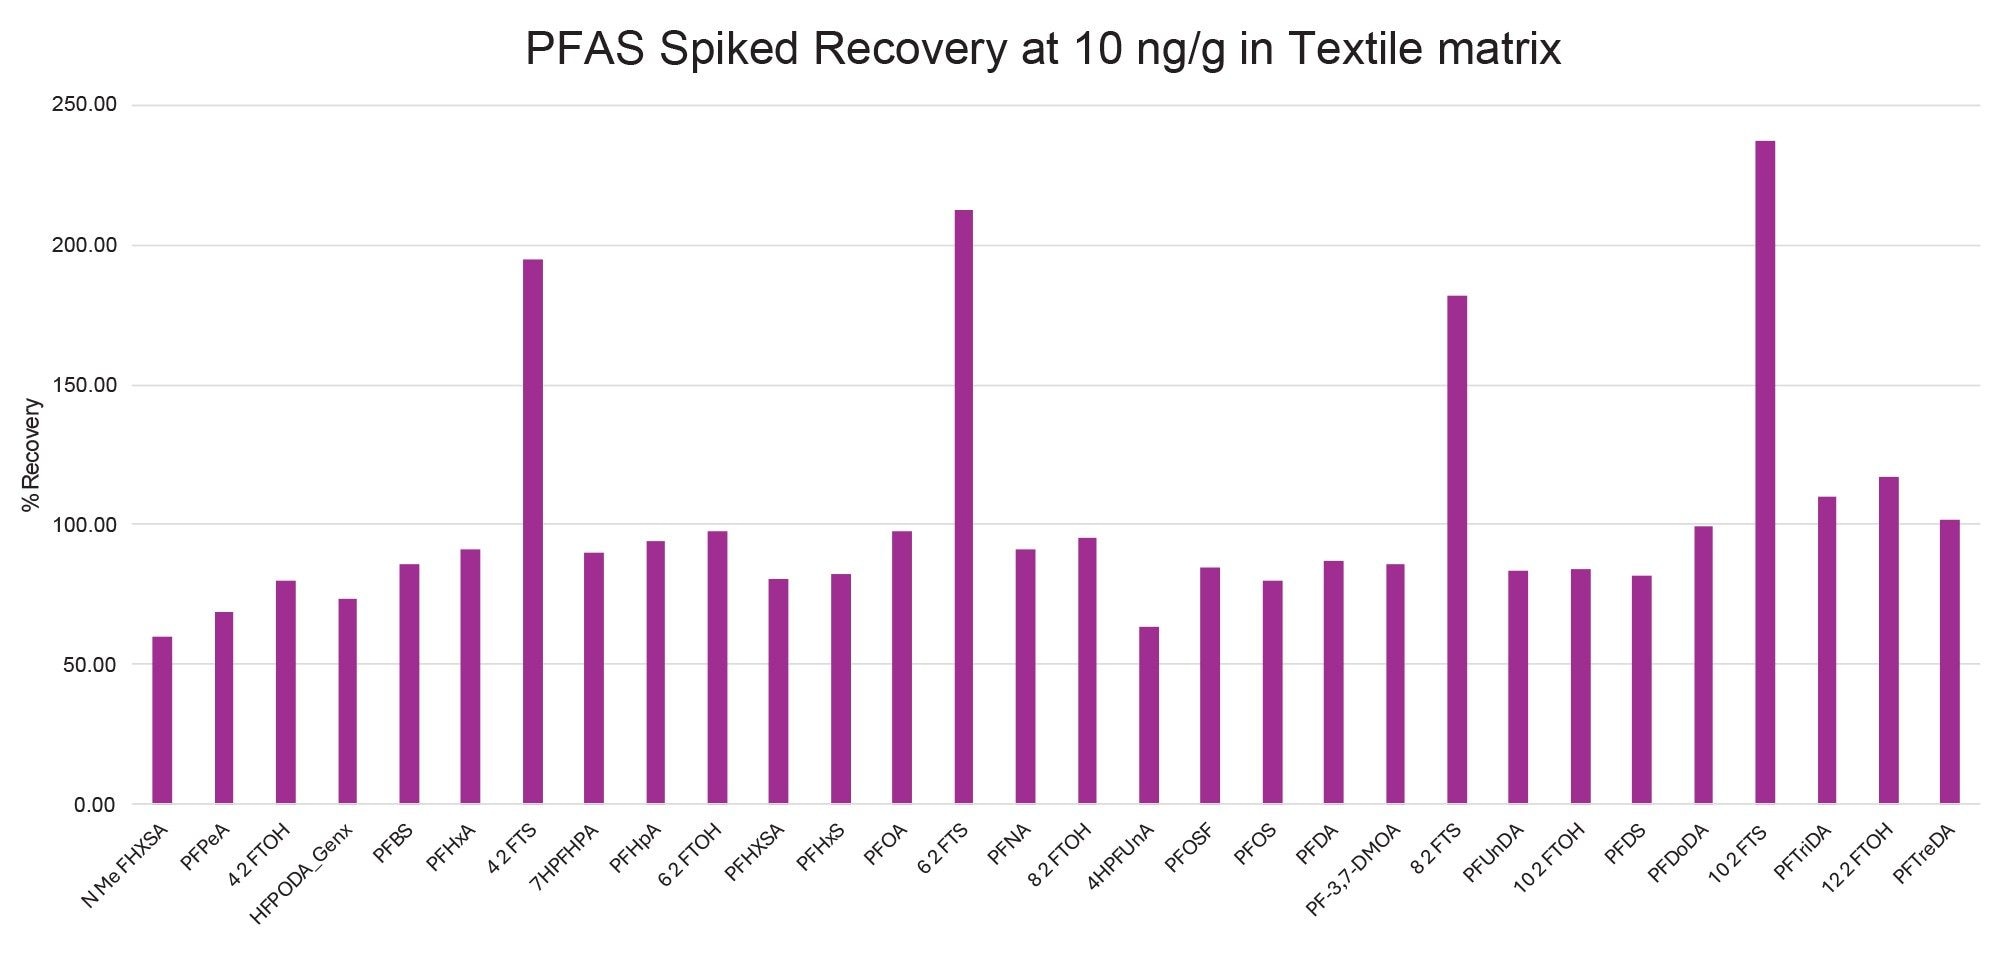
Calibration curves are typically used to establish the relationship between the concentration of an analyte and the response of the detector. These curves help ensure accurate quantification in the analysis by providing a standard reference. Figure 5 features represent calibration curves for the analytes, which are essential for quantifying them based on their peak areas. Figure 6 shows the results of the spiked recovery experiment where a known amount (10 µg/kg ) of a mixed standard was added to a processed sample to assess the method's recovery efficiency.
FTOHs, with their weaker carbon–carbon (C–C) bonds (comparatively weaker than C-F bonds), may undergo hydrolysis when present in precursor forms such as FTOH acrylates. This hydrolysis releases free FTOH from its ester-linked precursors but does not degrade the core fluorinated structure. The C–F backbone of the released FTOH remains chemically intact under these conditions adopted in this method. There will be several analytical artifacts such as volatilization, incomplete extraction from fluorinated coatings, material heterogeneity, adsorption losses to labwares, instrument sensitivity/matrix effects may potentially lead to influence the results.
In contrast, during methanolic aqueous NaOH treatment, perfluoro sulfonic acids (PFSAs), such as PFOS, PFHxS, and PFPeS, exhibit chemical stability due to their stronger carbon–fluorine (C–F) bonds. Any observed PFSA signal enhancement or reduction during sample preparation is generally attributed to analytical artifacts rather than true chemical degradation. The spike and recovery results for the four 4:2, 6:2, 8:2, and 10:2 FTS homologues are a typical example of enhanced signal response in this experiment. Although the calibration standards are prepared using the same diluent to minimize diluent-related effects, artificially elevated peak areas are still observed. This phenomenon may have been caused by co-extracted matrix components or the presence of multi-mix analytes of the same substance group in a single run or ionization source parameters, leading to overestimated recoveries exceeding 150% for the four FTS compounds. This observation has been cross-verified using another system, where the same enhanced response for FTS is observed in the spike and recovery study. To address this, it is recommended to use matrix-matched calibration curves with structurally similar or isotopically labeled internal standards to achieve accurate quantification. This can also be verified by selecting different product ions or the lab could also optimize the ESI source parameters to minimize the enhanced responses of such specific analytes.
Conclusion
By strictly following the critical steps of the alkaline hydrolysis method using methanolic aqueous sodium hydroxide (NaOH) both freely extractable PFAS and those previously bound within side-chain fluorinated polymers such as esters linked to fluorotelomer alcohols (n:2 FTOHs, where n = 4, 6, 8, 10, 12), can be effectively extracted. This approach also safeguards the LC-MS/MS instrumentation from blockages, damage, or contamination by preventing polymer accumulation and matrix interferences.
The analytical method using the ACQUITY UPLC H-Class Plus System and Xevo TQ-S micro LC-MS/MS System was found to be sensitive, reproducible and accurate, enabling cost-effective and time-efficient PFAS analysis in chemically processed textiles, coated textiles and textile products whilst maintaining high analytical quality even for challenging high-matrix samples.
References
- EN 17681-1-2025 Textiles and Textile products – Per and polyfluoroalkyl substances (PFAS) – Part 1: Analysis of an alkaline extract using liquid chromatography and tandem mass spectrometry.
- OECD 2021-Reconciling Terminology of the Universe of Per- and Polyfl uoroalkyl Substances: Recommendations and Practical Guidance.
- Organisation for Economic Co-operation and Development (OECD)_Synthesis Report on Understanding Side-Chain Fluorinated Polymers and their Life Cycle ENV/CBC/MONO(2022)35.
- Per- and Polyfluoroalkyl Substances (PFAS) in Consumer Products: An Overview of the Occurrence, Migration, and Exposure Assessment Molecules. 2025 Feb 21;30(5):994.
Acknowledgements
We sincerely acknowledge Ms. Meena Mariappan, Principal R&D-Global PS, TÜV SÜD, for her guidance in this collaborative study and appreciate her professionalism. We also gratefully acknowledge the support and contributions of the team at TÜV SÜD South Asia Pvt. Ltd., Ranipet, Tamilnadu in enabling the successful completion of the study
720009443, June 2026