Quantifying Oligonucleotide Deamination with Multi-Reflecting Time-of-Flight Mass Spectrometry
Jo-Anne Riley, Jonathan Fox, Laetitia Denbigh, Scott Berger, Nick Pittman, Ying Qing Yu
Waters Corporation, United States
Published on September 09, 2025
Abstract
In this study, the identification and quantification of deamination degradation products in an antisense oligonucleotide is demonstrated at levels below the conventional toxicity detection threshold of 1.5%. This is accomplished by analyzing high resolution mass spectrometry (HRMS) data (100,000 FWHM) acquired using the Waters™ Xevo™ MRT Mass Spectrometer (Figure 1) and applying two complementary approaches: isotope distribution analysis and MS/MS fragmentation.
Benefits
- Precise isotopic measurements enable accurate global quantification of low-level deamination impurities
- Rapid and reproducible isotope distribution analysis workflows utilize short run times (as little as 3 minutes per sample), delivering high-throughput analyses and accelerating time to actionable results
- High resolution MS/MS fragmentation data provides an orthogonal approach for deamination quantification and enables precise localization of deamination impurity sites
Introduction
Synthetic oligonucleotides have emerged as a powerful therapeutic modality, complementary to traditional small molecule and protein therapeutics. The manufacturing, quality control, and regulatory approval of oligonucleotide therapeutics require detailed knowledge of drug degradation pathways, which necessitate highly selective and sensitive analytical techniques to ensure the development and production of safe and efficient therapeutics.
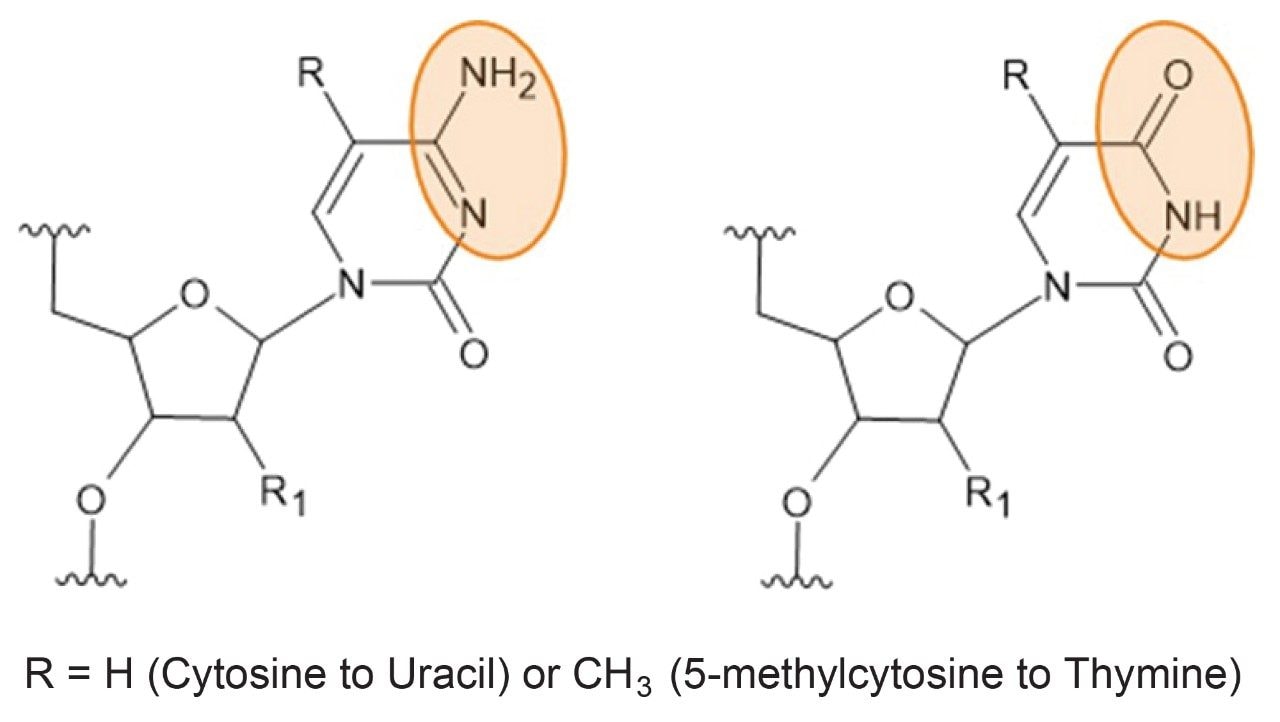
A primary degradation pathway for synthetic oligonucleotides is deamination (Figure 1). These reactions primarily occur at cytosine and 5-methylcytosine residues,3 where a loss of NH (−15.0146 Da) and a gain of O (+15.9994 Da) result in a mass difference of +0.9848 Da. This modification effectively converts the residue to uracil or methyl uracil (thymine), respectively, altering the oligonucleotide sequence and potentially reducing efficacy and/or increasing off-target activity. The deamination process can be influenced by sequence, temperature, and environmental factors,1–2 and is often driven by high-pH steps during oligonucleotide synthesis.
Understanding and monitoring deamination is therefore critical to ensuring the stability, efficacy, and safety of synthetic oligonucleotide therapeutics.
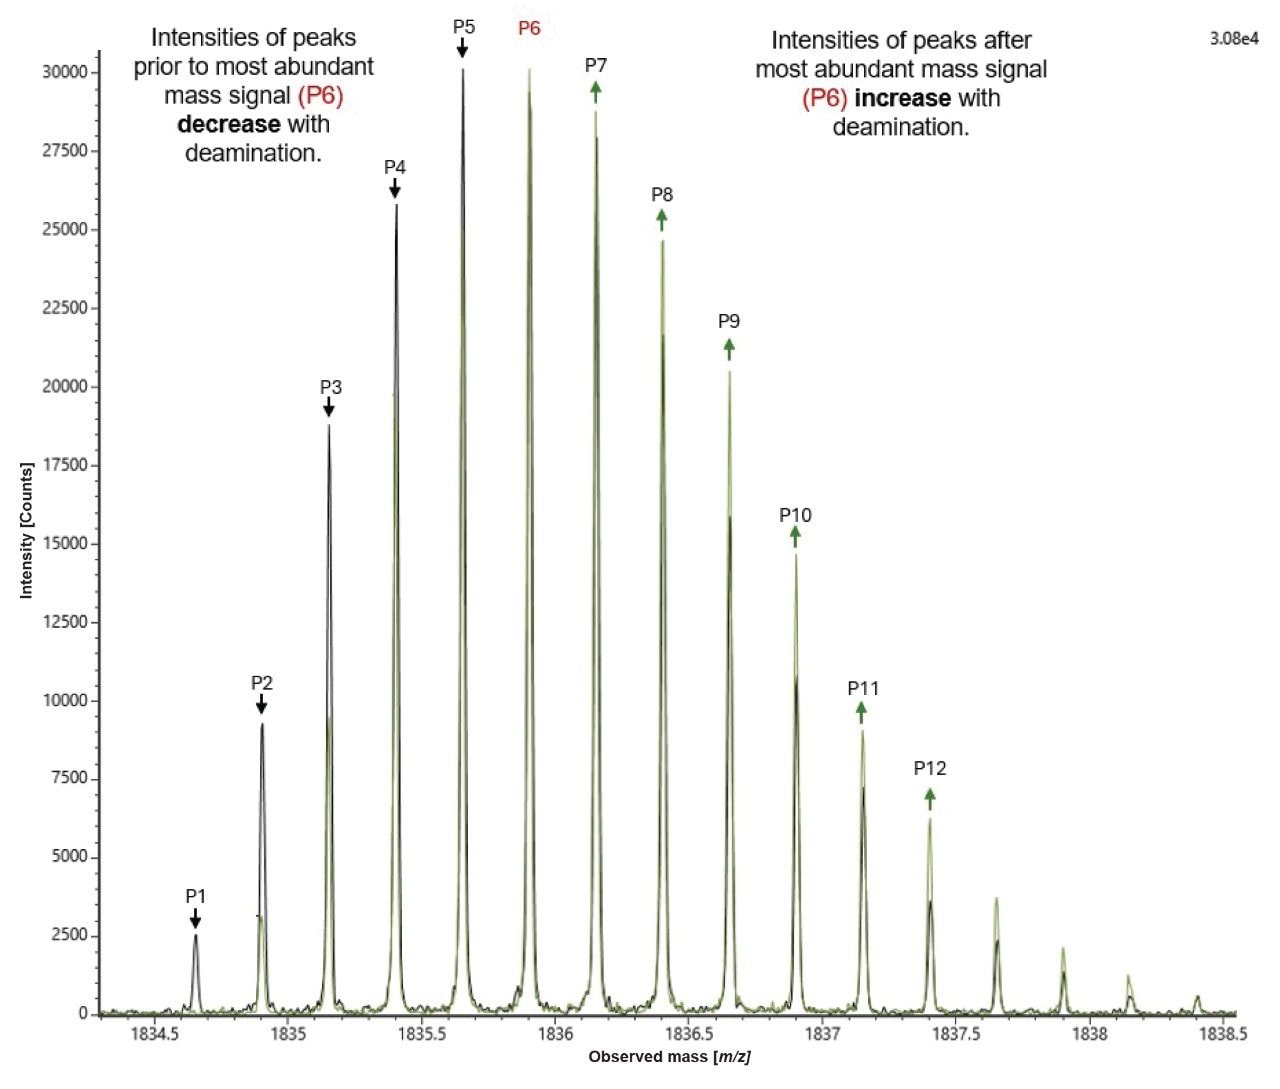
Detecting and monitoring deamination presents significant analytical challenges. Standalone chromatographic methods for quantifying deamination products are absent from the literature, likely due to the difficulty of separating these degradation impurities from the unmodified molecule. Additionally, MS analysis is complicated by overlapping isotopic distributions, as illustrated in Figure 2.
Here, the two complementary approaches for deamination analysis are shown: MS/MS fragmentation to localize the deamination site, and isotopic distribution analysis using Isotopic Distribution Factors (IDF).3 The latter approach uses IDFs—calculated from isotopic peak heights to quantify deamination levels as low as 0.5%.
![Combined ESI-MS spectra recorded on the Xevo MRT Mass Spectrometer for individual injections of the full-length product (FLP) and a deaminated oligonucleotide impurity with the same retention time. The quadruply charged state ([M-4H] -4 is shown](/content/dam/waters/en/app-notes/2025/720009000/720009000en-f2.jpg.82.resize/img.jpg)
Experimental
Sample Preparation
A synthetic antisense phosphorothioate oligonucleotide (FLP) and its corresponding deaminated impurity were both synthesized and supplied by Integrated DNA Technologies (IDT, Leuven, Belgium).
To evaluate detection sensitivity, the deaminated impurity was spiked into the FLP at seven concentration levels: 0.1%, 0.25%, 0.5%, 0.75%, 1.5%, 5.0%, and 10.0%. In all cases, the final concentration of the FLP–impurity mixture was maintained at 0.1 mg/mL.
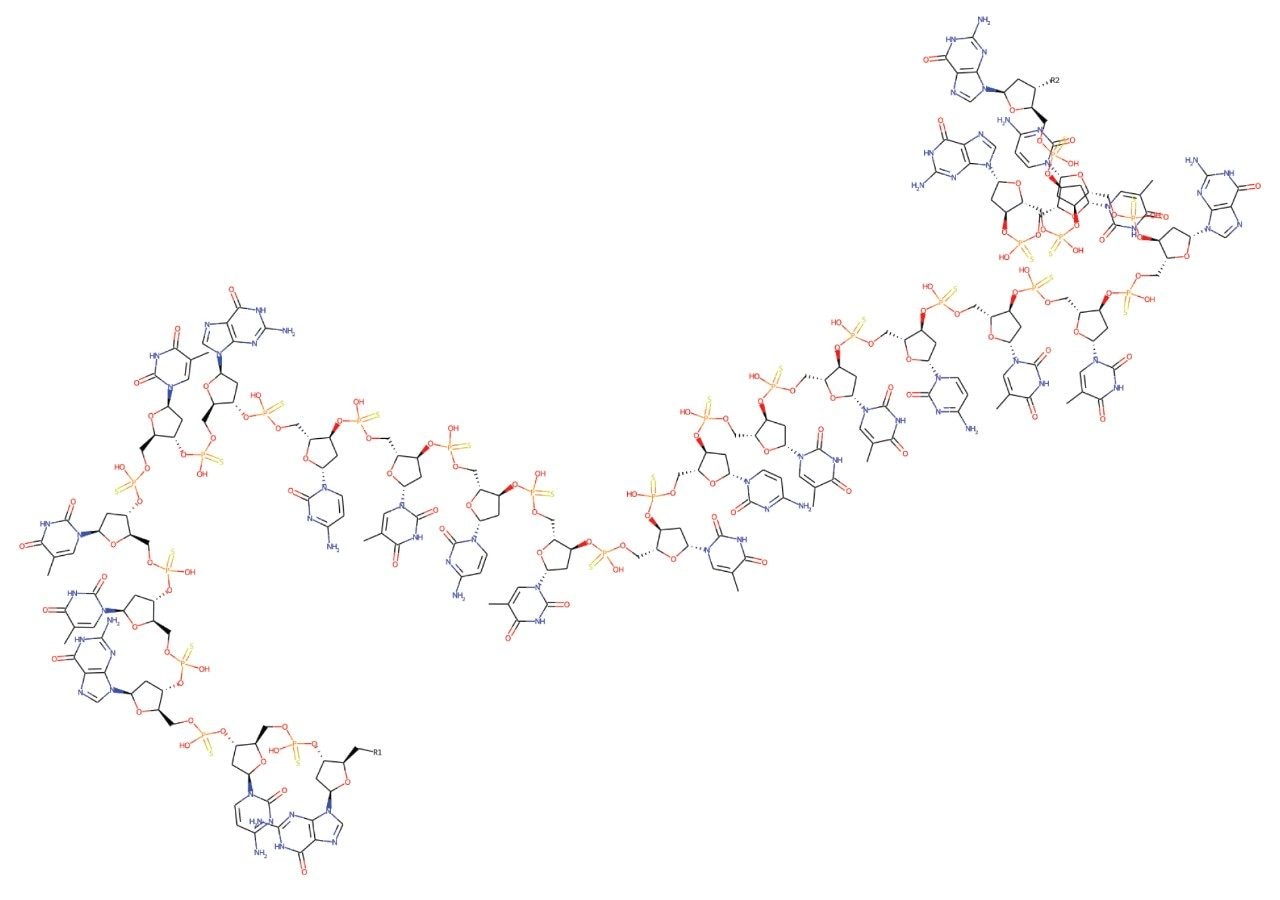
FLP Sequence: The antisense oligonucleotide consisted of 23 phosphorothioated deoxyribonucleotides (Figure 3) with the following base sequence:
dG* dC* dG* dT* dT* dT* dG* dC* dT* dC* dT* dT* dC* dT* dT* dC* dT* dT* dG* dC* dG* dT* dG*
Impurity Sequence: At position 2 in the impurity sequence, dC* was substituted with dU* in comparison to the FLP sequence.
dG* dU* dG* dT* dT* dT* dG* dC* dT* dC* dT* dT* dC* dT* dT* dC* dT* dT* dG* dC* dG* dT* dG*
The impurity dilution series was analyzed five times to provide a complete set of replicate injections for repeatability evaluation. For the isotope distribution method , the FLP was analyzed intact without fragmentation whereas for the MS/MS deamination localization measurements, the FLP was subjected to fragmentation. Data were collected for fragment-based analysis in MS/MS mode, targeting the most intense charge state observed.
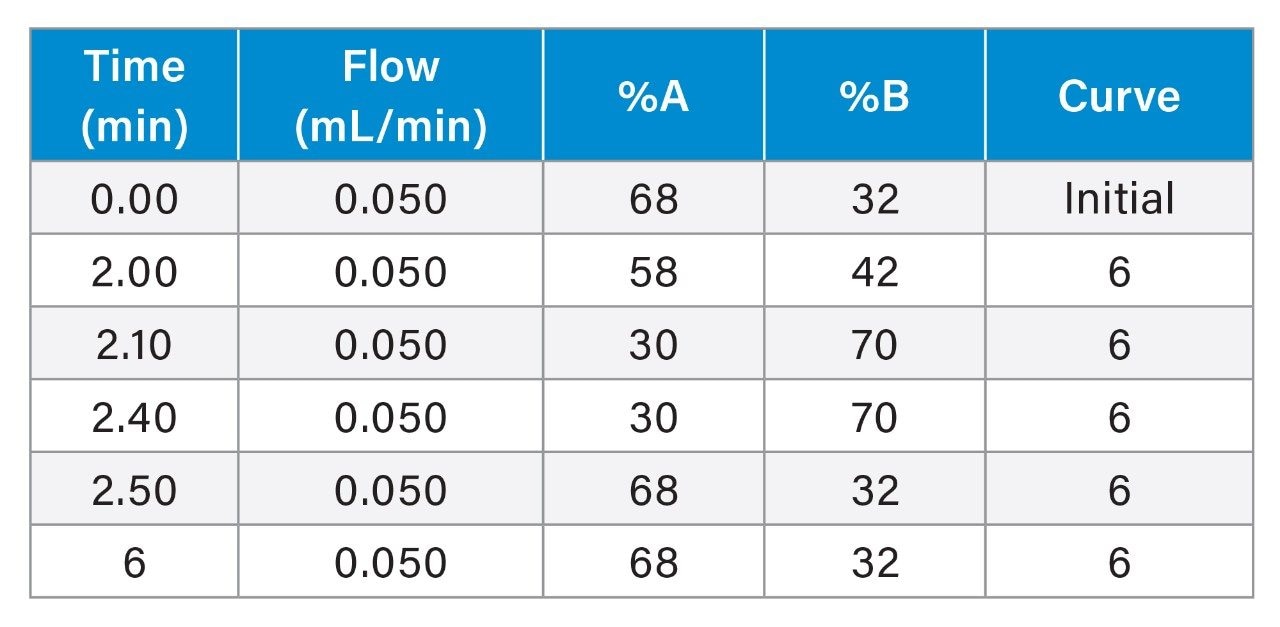
LC-MS Experimental Conditions
|
LC system: |
Waters ACQUITY™ Premier UPLC™ System (Binary) |
|
Vials: |
Waters QuanRecovery™ with MaxPeak™ HPS 12 x 32 mm Screw Neck Vials (p/n: 186009186) |
|
Column: |
ACQUITY Premier OST Column 1.7 µm, 2.1 x 50 mm ( p/n: 186009484) |
|
Column temperature: |
60.0 °C |
|
Sample temperature: |
6.0 °C |
|
Injection volume: |
4 µL |
|
Flow rate: |
0.050 mL/min |
|
Mobile phase A: |
H2O, 7 mM TEA, 80 mM HFIP |
|
Mobile phase B: |
3.5 mM TEA and 40 mM HFIP in 50% MeOH (v/v) with water |
Gradient Table
MS Conditions
|
MS system: |
Waters Xevo MRT Mass Spectrometer |
|
Mode: |
MS/MS |
|
Mass range: |
50–4000 m/z |
|
Polarity: |
Negative ion |
|
Scan rate: |
1 Hz |
|
Cone voltage: |
30 V |
|
IDF method collision energy: |
6 V |
|
Fragmentation method collision energy ramp: |
10–30 V |
|
Source temperature: |
120 °C |
|
Desolvation temperature: |
450 °C |
|
Desolvation gas: |
800 L/hr |
|
Capillary voltage: |
2.0 kV |
Informatics
Data acquisition and processing were performed using the UNIFI™ Application within the waters_connect™ Software Platform. The ESI-MS spectra of oligonucleotides were centroided with the Mass Measure option. MS/MS data processing was conducted using the CONFIRM Sequence application.
Results and Discussion
Two orthogonal methodologies were evaluated for their effectiveness in quantifying deamination levels in a 23-mer ASO molecule. The first method employed MS/MS fragmentation to detect, localize, and quantify deamination events, while the second used a global assessment strategy based on changes in isotopic distribution—referred to as the IDF.3 A single configuration of the ACQUITY Premier UPLC and Xevo MRT System, and 6-minute LC method were used to acquire data for both analytical approaches.
MS/MS Fragmentation Method
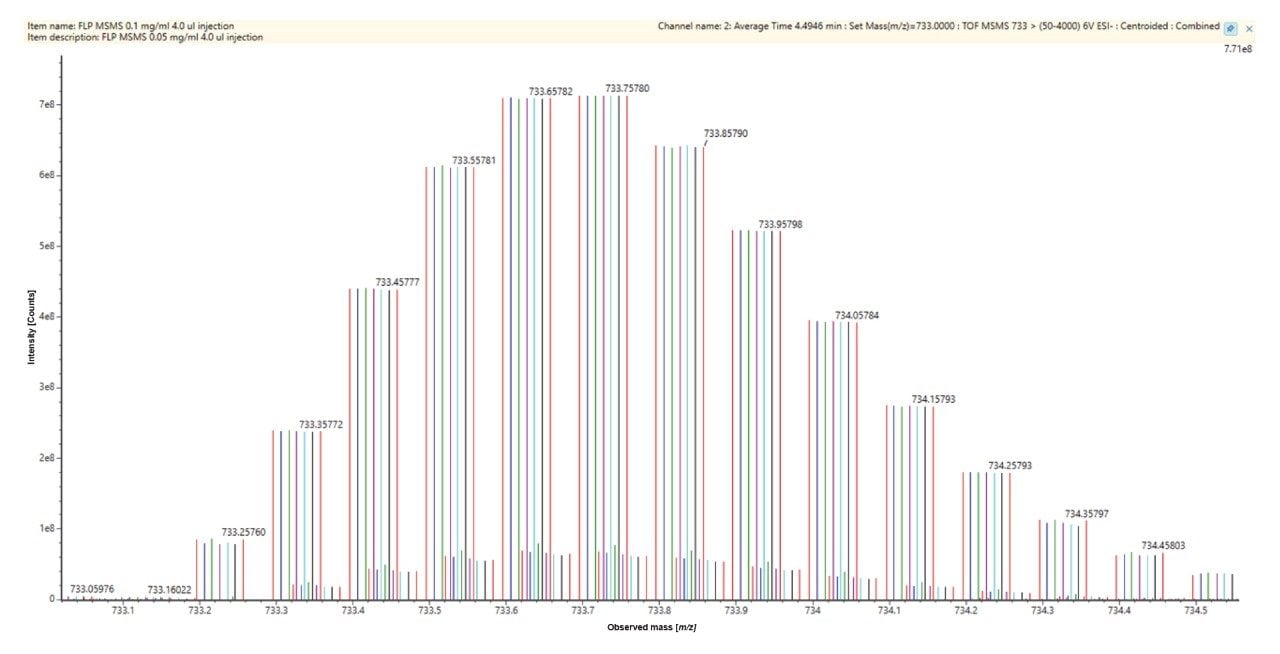
The MS/MS acquisition was performed on the 10⁻ charge state ([M−10H]¹⁰⁻, m/z 733), which was selected for its optimal signal intensity. A generic collision energy ramp of 10–30 eV was applied, providing full sequence coverage without the need for further optimization. Data were analyzed using the CONFIRM Sequence application workflow to identify unique fragment ions suitable for quantifying and localizing deamination (Figure 4). In the acquired dataset, the 5ʹ dG* dC* fragment (b₂ ion) was selected for measuring cytosine deamination at position 2.
![MS/MS fragmentation spectrum (Bottom) of m/z 733, the [M-10H]10− charge state, with the CONFIRM Sequence application Dotmap view (Top) of assigned fragments](/content/dam/waters/en/app-notes/2025/720009000/720009000en-f4.jpg.82.resize/img.jpg)
The MS/MS fragmentation of the pure FLP oligonucleotide standard produced the dG* dC b2 fragment at m/z 571.11, while the deaminated standard produced a dG* dU b2 fragment at m/z 572.09. Accurate quantification of deamination can be potentially complicated by the 13C isotopic peak of the FLP dG* dC* fragment at m/z 572.11 (Figure 5).
![MS/MS fragmentation analysis of m/z 733 [M-10H]10−, for the pure FLP standard and pure deaminated sample](/content/dam/waters/en/app-notes/2025/720009000/720009000en-f5.jpg.82.resize/img.jpg)
Despite this challenge, the high resolution (100,000 FWHM) of the Xevo MRT Mass Spectrometer enables clear separation of the 12C deaminated product from the 13C isotopic peak of the FLP, demonstrating its capability to measure deamination at 1.5% and 0.5% levels (Figure 6).
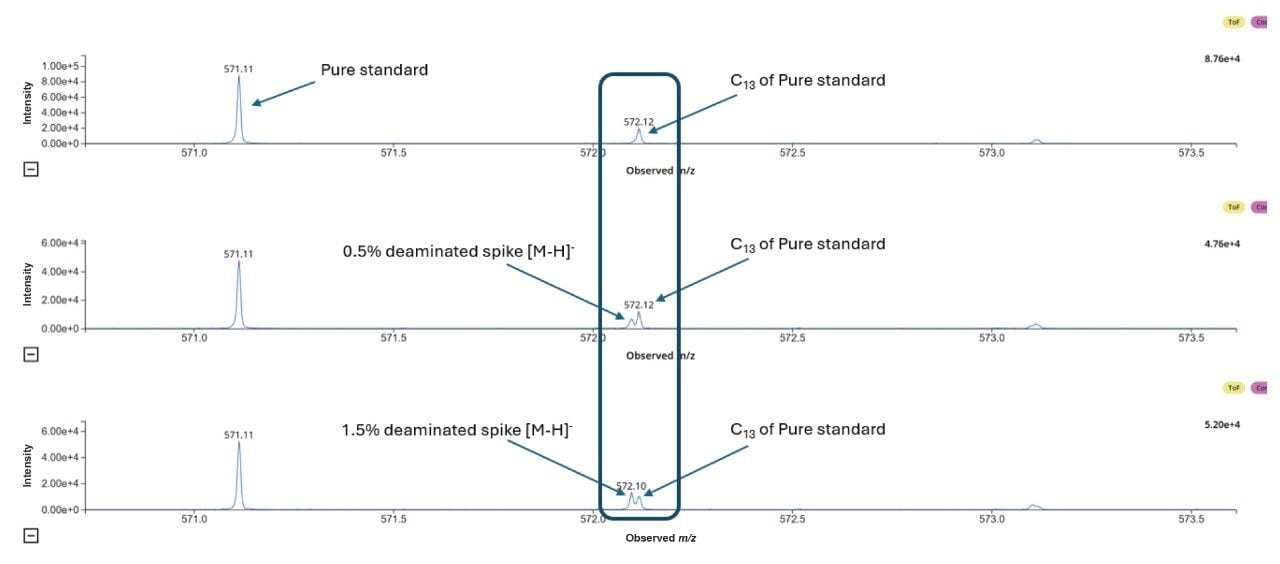
Figure 6 illustrates how high-resolution MS/MS and enhanced sensitivity in product ion detection enable effective separation of the deaminated impurity signal from the near isobaric interference of the ¹³C isotope of the FLP. This capability allows confident localization of the deaminated impurity when spiked into the FLP at levels of 1.5% and 0.5%.
IDF Method
The presence of a deaminated degradation product (+0.9848 Da higher in mass than the unmodified FLP) results in overlap of isotopes for both molecules within the co-eluted peak, resulting in the appearance of small shift in peak height of each isotope peak starting with the 13C isotopic peak of the FLP. These subtle changes in isotope abundance have been reported to allow estimation of the relative amounts of FLP and a deaminated impurity3 (Figure 7).
The amount of deamination can be derived directly from the isotope peak heights in the form of an IDF, which is calculated using the equation:
IDF= ∑ (Isotopic peaks 7 to 12〗- ∑ (Isotopic Peaks 1 to 5)
Reproducible isotope measurements are crucial for the IDF method to reliably determine deamination levels. Figure 8 shows combined centroided isotopic distributions from five replicate injections, demonstrating near-perfect repeatability and highlighting the robustness of mass detection and the optimized LC-MS method.
This approach utilizes sample loadings that are ten times lower than those reported in previous studies,3 combined with reduced LC flow rates and a significantly shortened analysis time of just 6 minutes—down from 33 minutes—while maintaining high repeatability. The complete analysis and data processing of 15 injections (five replicates each of a pure standard, a 1.5% impurity sample, and an unknown batch) was completed in under 2 hours, offering a substantial improvement in sample throughput.
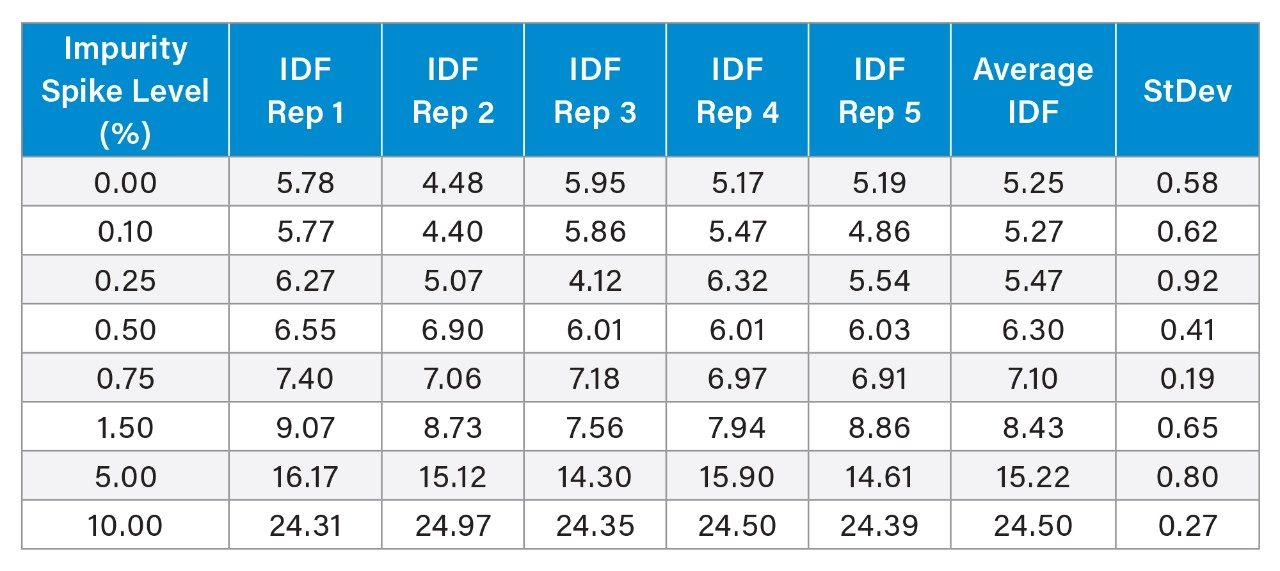
IDF values calculated using the area of each isotope along with their standard deviations from five replicate injections for both control samples (FLP oligo only) and spiked samples (FLP with added deaminated impurity) are shown in Table 1.
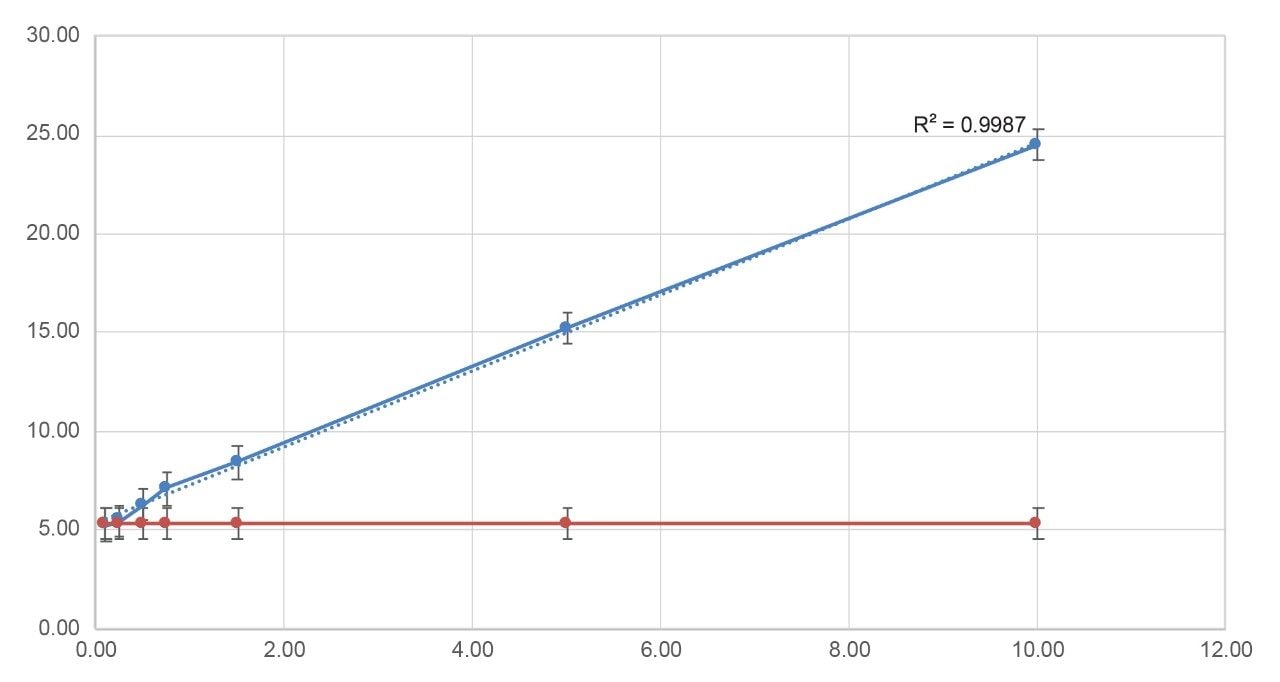
The reported IDF values are also plotted as Figure 9, demonstrating excellent linearity (R2 0.998) across entire deaminated impurity spike range of 0.10% to 10.00%.
Statistically significant differences in IDF values between spiked samples and the FLP control, relative to standard deviation, are evident from the 0.5% spike level onward.
IDF Values Across Impurity Spike Levels
Conclusion
Deamination of nucleic acids can alter the oligonucleotide sequence, potentially reducing therapeutic efficacy and/or increasing off-target activity. As such, monitoring deamination levels is crucial in both quality control (QC) and development settings. However, measuring deamination presents a significant analytical challenge due to the subtle mass shift (+0.98 Da) and the difficulty in chromatographically resolving modified species from their unmodified counterparts.
This study demonstrates the capability of the Xevo MRT System to reliably detect and quantify deamination in a 23-mer antisense oligonucleotide using two orthogonal analytical strategies:
1. Localization and Confirmation through MS/MS Fragmentation
Complementing the IDF approach, high-resolution MS/MS fragmentation provides an orthogonal means of confirming deamination using isotope resolved lower mass fragment ions and allows precise localization of the modification site within the oligonucleotide sequence.
2. Robust Quantification via Isotopic Distribution Factor (IDF)
Leveraging high-resolution and reproducible isotopic measurements of the combined isotopic envelope of the modified and unmodified oligo, the IDF method enables accurate global quantification of deamination. This approach requires minimal sequence-specific information and exhibits excellent linearity across a 0.1%–10% range (R² = 0.998), making it highly suitable for routine analytical workflows.
Together, these two complementary methodologies offer a fast, reliable, and versatile solution for both quality control and product/process development characterization of oligonucleotide therapeutics, streamlining the assessment of deamination impurities.
References
- Capaldi, DC. “Stress Testing of Oligonucleotides”, book chapter in: Baertski SW, Alsante KM, Reed RA (Editors) of Pharmaceutical Stress Testing, second edition, Informa Healthcare, London, UK, 2011, 391–425.
- International Council on Harmonization of Technical Requirements for Registration of Pharmaceuticals for Human Use (ICH); Guideline Q1A(R2) Stability Testing of New Drug Substances and Products, February 2003.
- Rentel C, DaCosta J, Roussis S, Chan J, Capaldi DC, Mai B. J Pharm Biomed Anal, 2019, 173, 56–61.
Featured Products
720009000, August 2025