Evaluation of System Robustness of the Alliance™ iS Bio System Using Peptide Mapping Analysis
Andrew Steere, Corey E. Reed, Kimberly Martin, Paula Hong
Waters Corporation, United States
Published on May 30, 2025
Abstract
Peptide mapping analysis of protein digestions is a critical component of biopharmaceutical development and manufacturing. The demanding method conditions required to perform these complex separations can be used to evaluate system performance. The Alliance iS Bio HPLC System is a liquid chromatography (LC) system designed for use in biopharmaceutical QC labs. It features MaxPeak™ High Performance Surfaces (HPS) Technology to reduce non-specific adsorption. In this study, the Alliance iS Bio HPLC System is evaluated for robustness over a period of 30 days using a long, shallow gradient peptide mapping method. Retention time and resolution remained consistent over the entire time range, and the area percent relative standard deviation (RSD) remained below 2% for eight peaks of interest in a complex digest.
Benefits
- Alliance iS Bio HPLC System produces reproducible results over extended periods of testing for a difficult gradient method.
- Biocompatible design maximizes performance for biomolecules.
Introduction
Peptide mapping analysis is a critical component to biologics development in the pharmaceutical industry for assays such as impurity monitoring. The complexity of protein digest samples also makes them ideal for LC system performance evaluation.1 This is due to the demanding method conditions required to achieve separation of the many digestion products. These samples, along with many other biological samples, often have high levels of interactivity with the metal components in LC systems. These non-specific adsorption interactions are problematic in chromatography because they may result in peak broadening, large precision differences, and long passivation times.2
The Alliance iS Bio HPLC System is a modern solution to the challenges presented by these samples. The system contains an inert flow path to minimize interaction between sample and system. Components designed to resist corrosion include a titanium mixer and MP35N tubing. These allow for the best performance on applications that employ high salt concentrations and harsh pH conditions, commonly found in bio methods. Components designed to reduce non-specific adsorption include a PEEK needle and MaxPeak HPS tubing. The 680 µL mixer and reduced default stroke volume of 66 µL minimize noise and provide a flatter and more consistent baseline, particularly when using applications that use mobile phase additives such as trifluoroacetic acid.3 These instrument characteristics are ideal in a QC environment where it is critical to achieve repeatable results and minimize errors.4
The robustness of a system is most challenged with demanding method conditions such as small changes in gradient composition per unit time, particularly for low pressure pumps. Low pressure quaternary pumps contain a gradient proportioning valve with four independent channels which send small packets of solvent along the flow path. With a long shallow gradient, each channel can be open for only fractions of a second for packet delivery, and this must be done repeatedly over the course of long run times and multiple injections. In contrast, binary pumps contain only two solvent lines, but undergo high pressure mixing in the mixer which can yield more consistent performance. Therefore, a quaternary system must exhibit high performance to be suitable for these applications.
In this study, a peptide mapping method with a long, shallow gradient (0.5% B/min) is used and injections of an enolase digest standard are completed repeatedly for 30 days. The standard used serves as a representative complex sample commonly found in biopharmaceutical applications. This extended timeframe allows for observations about the stability of the HPS technology and the ability of the gradient composition delivery to remain consistent.
Experimental
Sample Description
Waters™ MassPREP™ Enolase Digestion Standard (p/n: 186002325) was reconstituted using 100 µL of Mobile Phase A. Samples were pooled as necessary to yield sufficient volume to minimize variability within a sample set and distributed into Total Recovery Vials (p/n: 186005663CV). Vials were used for two sample sets prior to fresh sample being prepared. Each sample set contained three replicate injections of the enolase digest standard along with blanks and other performance standards. Sample sets ran for approximately 29 hours, and 25 sample sets were completed over the 30 days of study.
LC Conditions
|
LC system: |
Alliance iS Bio HPLC System |
|
Column: |
XSelect™ CSH™ C18, 130Å 2.5 µm, 4,6 x 150 mm (p/n: 186006729) |
|
Mobile phase A: |
0.1% Trifluoroacetic acid in Water |
|
Mobile phase B: |
0.1% Trifluoroacetic acid in Acetonitrile |
|
Needle wash: |
50/50 Mobile Phase A/Mobile Phase B |
|
Seal wash: |
90/10 Water/Methanol |
|
Flow rate: |
0.500 mL/min |
|
Injection volume: |
25 µL |
|
Sample temperature: |
10 °C |
|
Column temperature: |
60 °C |
|
Wavelength: |
214 nm |
|
Sampling rate: |
10 Hz |
Gradient Table
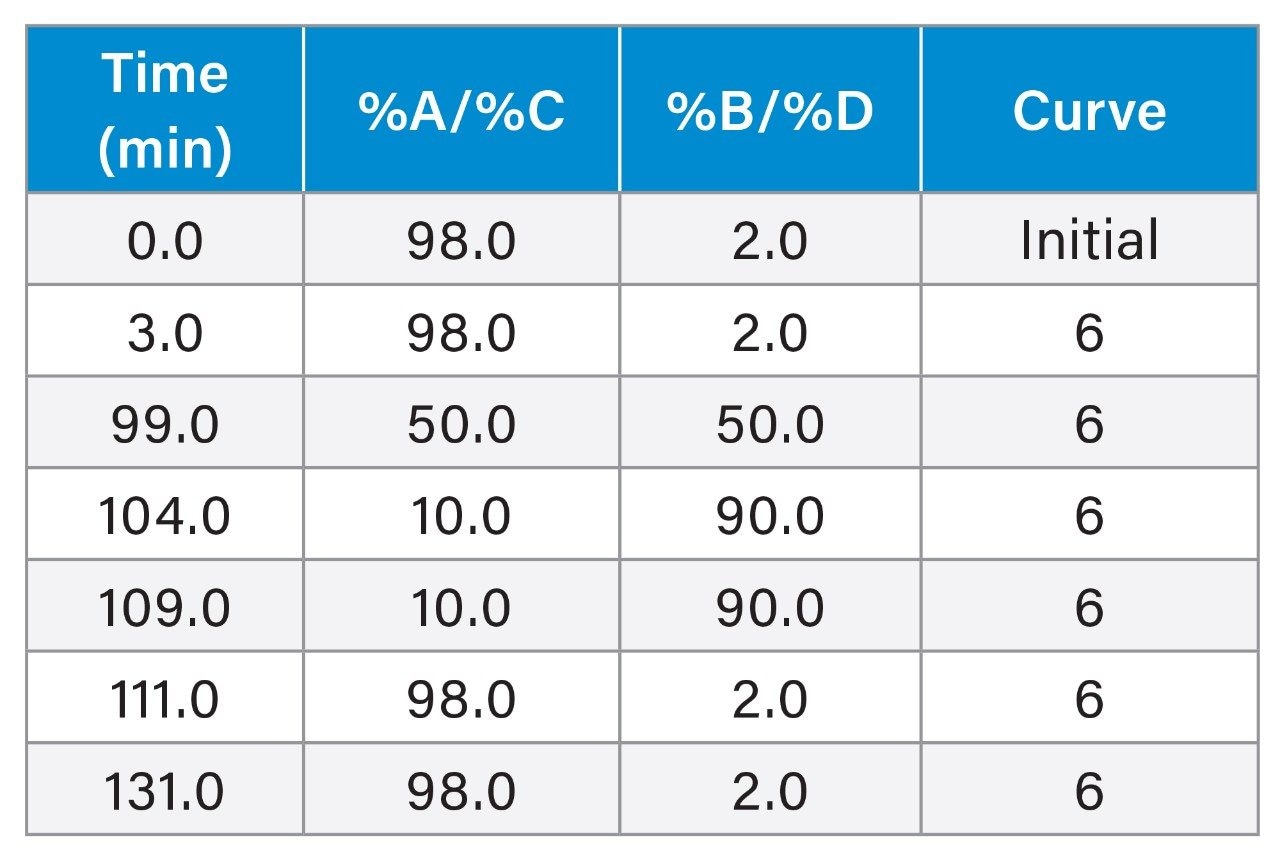
Sample sets alternated using the A/B and C/D lines over the 30 day period. This was done to enable continuous use of the system throughout the study without the need for system downtime to swap mobile phases.
Data Management
|
Chromatography software: |
Empower™ 3.8.0.1 |
Results and Discussion
The total injection time for this method is 131 minutes, with the linear gradient portion lasting 96 minutes and changing by 48% B, yielding a rate of 0.5% B/min. A sample chromatogram of the enolase digest standard is shown in Figure 1 below and includes all peaks of interest used throughout the study.
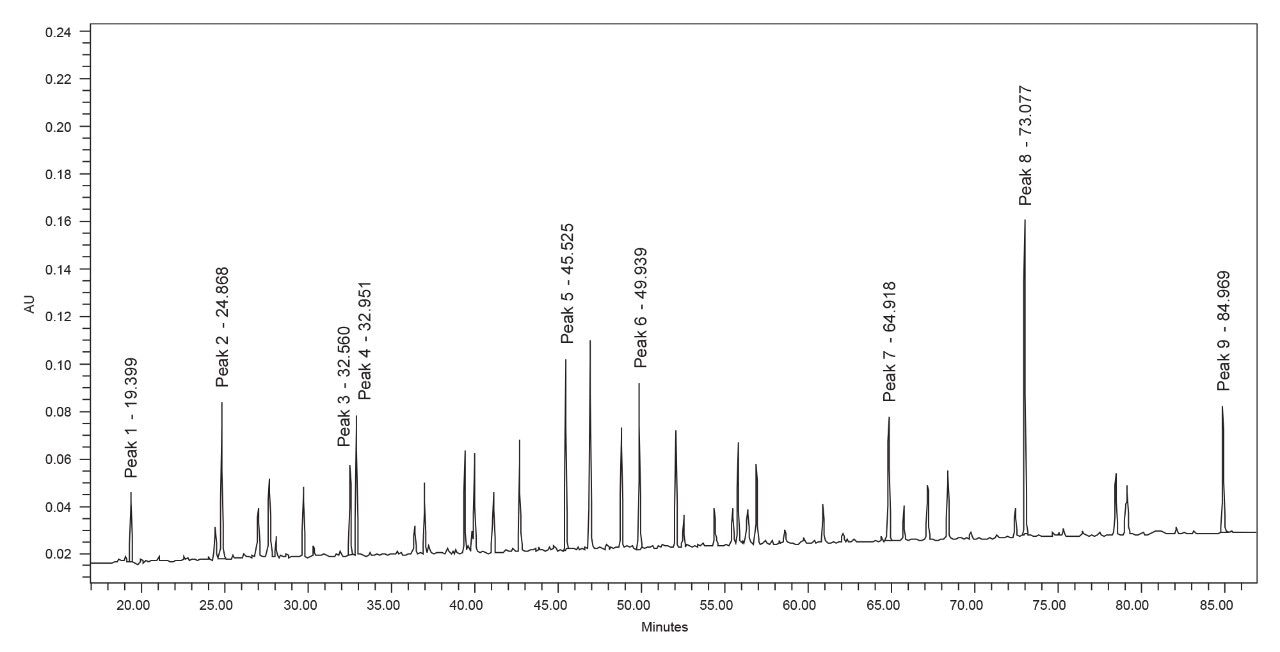
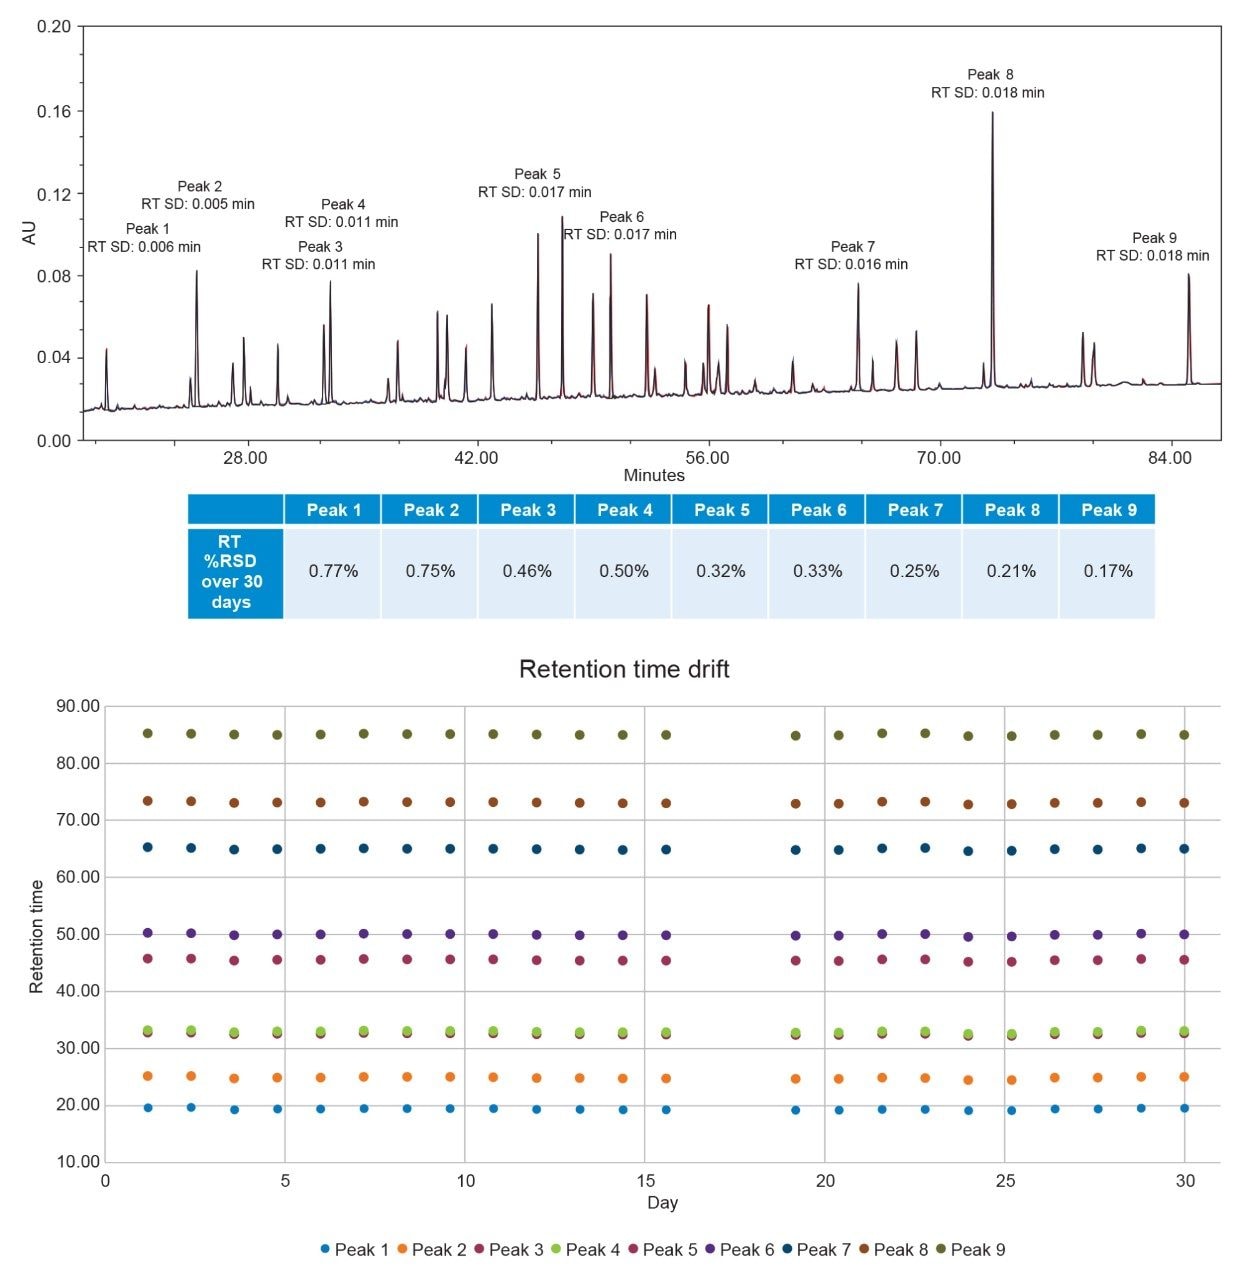
The enolase digest standard is a complex sample that contains peptides with a wide range of chemical properties. Nine peaks were selected to use for quantitative analysis. Peak 1 was the first fully resolved peak in the chromatogram, while Peak 9 was the last. The other seven chosen peaks span the range of the gradient to better observe the behavior at different mobile phase solvent ratios from approximately 10% mobile phase B (Peak 1) to approximately 43% mobile phase B (Peak 9). Additionally, Peaks 3 and 4 are used for resolution calculations due to their close elution. Peptides are very sensitive to organic content within mobile phases, making them ideal to observe consistent delivery across injections. The stroke volume and flow rate determine packet volumes for solvent delivery in the quaternary pump. The Alliance iS Bio HPLC System has a default stroke volume of 66 µL, and the method has a flow rate of 0.500 mL/min. This leads to a duty cycle of 7.9 seconds, and at the initial conditions of 5% B the valve is only open for 0.395 seconds. A binary pump would instead slowly deliver 25 µL/min at initial conditions. The quaternary pump in the Alliance iS Bio HPLC System shows high repeatability both within a sample set and over the course of the 30 days of study. An overlay of the three injections in one sample set, as well as the average retention time standard deviation, is shown in Figure 2 below.
The overlay of three consecutive injections shows strong repeatability within a sample set throughout the entire chromatogram, spanning the range of organic content delivered. The average retention time standard deviation within the sample set for each of the peaks is shown on the chromatogram. No peak has a retention time standard deviation above 0.018 minutes. The retention time %RSD data over the entire 30 days is also shown. Every peak has a %RSD below 0.8%. This shows excellent repeatability within a sample set and very small retention time drift over the entire study. As the peptides measured in this study are very sensitive to organic content delivery, the pump delivered accurate and precise packets throughout the 30 days. This is shown visually through the retention time drift results shown in Figure 2.
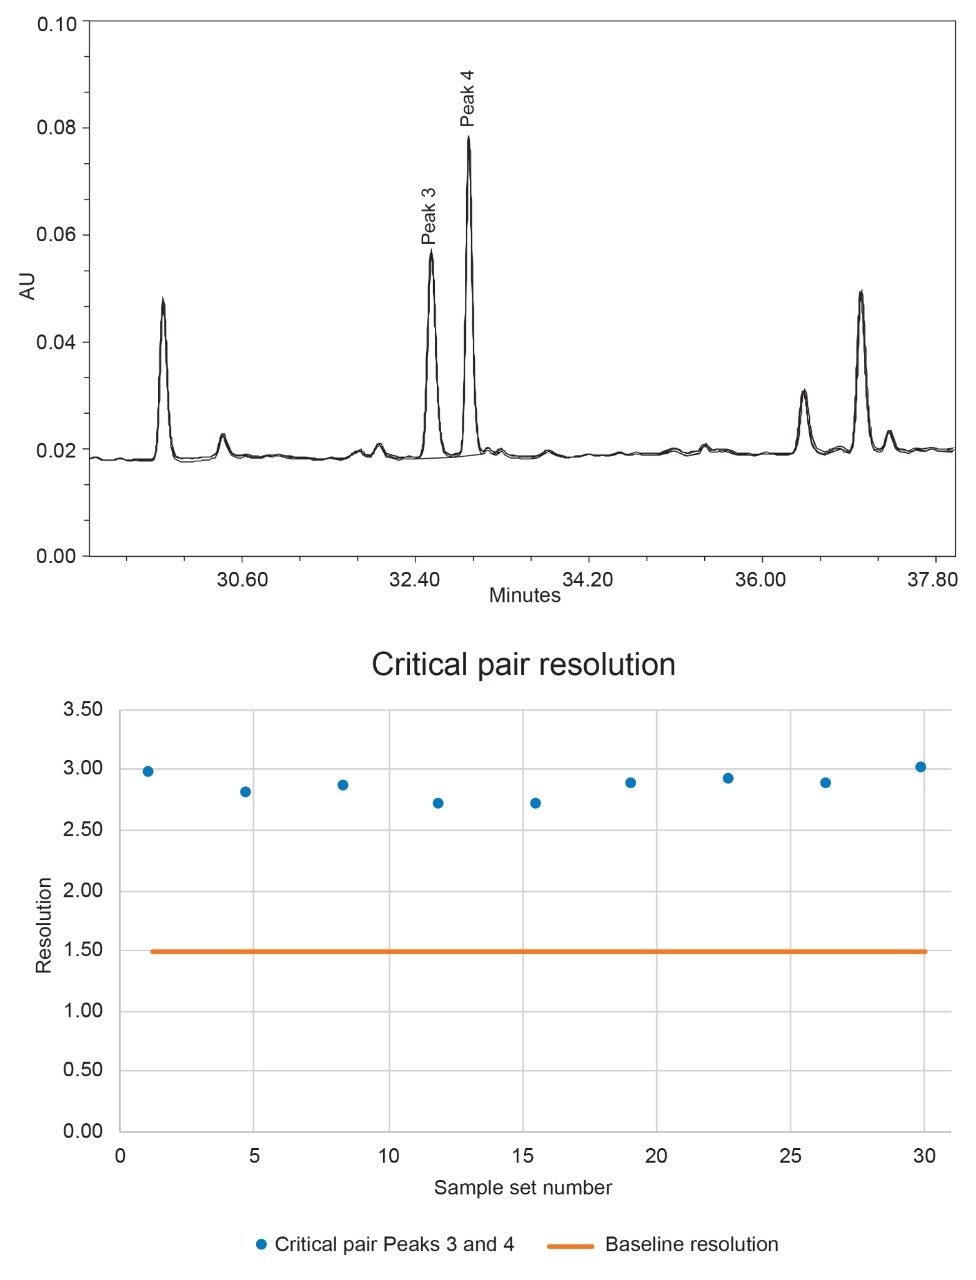
Retention time is critical for peak identification, so small shifts could lead to misidentification from drift or selectivity changes. This is illustrated with peaks 3 and 4, closely eluting peaks where any small shifts could lead to a loss in resolution or clear peak definition. Figure 3 below shows a zoomed in overlay of these two peaks as well as the resolution results throughout the study.
It is essential for quantitative measurement that two peaks remain above 1.5 resolution, ensuring there is baseline separation between the two. As these two peaks exhibit the lowest resolution of the peaks used for quantitation, they are considered the critical pair for this data set. Resolution can be impacted by changing retention times, addressed previously in the results, or by changing peak shape from injection to injection. As shown in Figure 3, the resolution between the two peaks remains above 1.5 for the entire 30 day period. There is also no trend of increasing or decreasing resolution, suggesting the system is performing similarly throughout the entire study without the need for any conditioning or passivation.
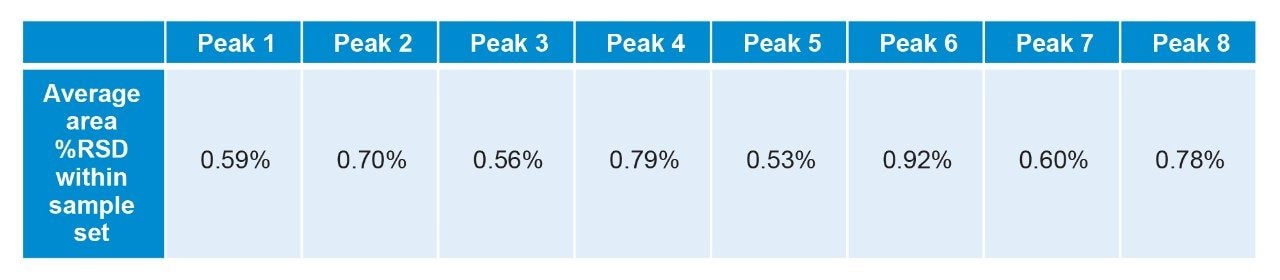
Evaluation of the retention and area reproducibility over the entire 30 days also demonstrates the ability of the system to deliver consistent results as shown in the average area precision for the 30 day results (Figure 4). The eight peaks shown in Figure 4 all have an area %RSD under 1% within a sample set throughout the study. Unlike the retention time data presented previously, area counts are highly dependent on individual sample preparation and make it more difficult to compare across sample sets where different preparations are used. Peak 9 was not included in area results due to a baseline feature leading to inconsistent integrations. These results mirror the robust performance observed with the retention time standard deviation.
Conclusion
Pharmaceutical testing, including peptide mapping analysis, requires demanding method conditions to achieve separation such as long, shallow gradients. The Alliance iS Bio HPLC System displayed robust performance over an extended 30 day period of study for these challenging conditions. Results included retention time standard deviation within sample sets of not more than 0.018 minutes, overall retention time %RSD not more than 0.77%, critical pair resolution above baseline resolution for the entire study, and area %RSD within sample set not more than 0.92%. These results demonstrate a system that is fully capable of handling difficult applications while maintaining a high level of performance.
References
- Steere A, Wong N, Hong P. Evaluation of Arc™ Premier Pump Performance for Long Shallow Gradient Peptide Mapping Analysis. Waters Application Note, 720007709, September 2022.
- Han D, Birdsall RE, Nyholm K. Leveraging the Alliance™ iS Bio HPLC System as a Modern HPLC for Peptide Drug Substances Analysis in QC Environments. Waters Application Note, 720008345, May 2024.
- Martin K, Gauthier L, Hong P. Improved Sensitivity for Trifluoroacetic Acid Gradients on the Alliance™ iS HPLC Systems. Waters Application Note, 720008550, October 2024.
- Reed C, Hong P. Extended Analysis of mAbs Using Ion-Exchange Chromatography on the Alliance™ iS Bio HPLC System. Waters Application Note, 720008527, September 2024.
Featured Products
720008829, May 2025