Automated Multiple Reaction Monitoring (MRM) Method Development for Peptide Drugs Using waters_connect for Quantitation Software
Robert Plumb, Nikunj Tanna
Waters Corporation, United States
Published on November 07, 2025
Abstract
The development of sensitive, specific multiple reaction monitoring (MRM) methods for peptide drug bioanalysis is complicated by the formation of precursor ions with multiple charge states, each of which require precursor ion → product ion optimization and comparison. The MRM Optimization tool in waters_connect™ for Quantitation Software has been specifically designed to address this challenge, facilitating the detection multiple charge state precursor ions, product ion generation, cone voltage – collision energy optimization, and data visualization. The optimized transitions are then directly transferred to the MS acquisition method, thus mitigating transcription errors.
Benefits
- Rapid evaluation and optimization of MRM conditions freeing up bioanalysts to perform other valuable tasks.
- Interactive graphical review of results facilitating informed decision making.
- Elimination of transcription errors via direct transfer of MRM results to the LC-MS method editor.
Introduction
LC-MS/MS is the technology of choice for the quantification of drugs, metabolites, and biomarkers in biofluids, typically employing tandem quadrupole mass spectrometry (MS) with detection via MRM. MRM method development for classic small molecule drugs involves the selection of the best precursor and product ion followed by optimization of cone voltages and collision energies. This is achieved by infusion or LC injection of the analyte(s) of interest. For small molecule drug compounds, this process is usually straightforward and lends itself to automation as they largely generate singly charged ions. However, in electrospray mass spectrometry, biomolecules such as peptides, oligonucleotides, and proteins normally form several multiply charged precursor ions, e.g., M+3H3+, M+4H4+. This significantly complicates MRM method development, as each charge state can generate multiple fragment ions, all of which need to be compared both within and across each charge state to choose the best transition or transitions for analyte measurement.
The MRM Optimization tool with the waters_connect for Quantification Software has been specifically designed to address the challenge of MRM method development for multiply charged biomolecules. The Optimization tool facilitates the automatic acquisition of data from multiple precursor and product ion and collision energy combinations across several charge states, with the results reviewed via an interactive graphical interface. Here, the use of this optimization is illustrated, using the GLP-1 peptide, semaglutide, as an example.
Experimental
Chemicals
Semaglutide authentic standard was dissolved in methanol to yield a 1 mg/mL solution and further diluted in 50:50 methanol:0.1% aqueous formic acid to 100 ng/mL.
Mass Spectrometry
Mass spectrometry was performed on a Waters Xevo™ TQ Absolute XR Mass Spectrometer, operated in positive ion electrospray ionization mode (ESI). Nitrogen was used as the nebulizer gas and argon as the collision gas. The cone voltage, collision energy, and MS/MS transitions were adjusted and evaluated using the waters_connect MRM Optimization tool.
Informatics
The mass spectrometer was controlled and resulting data evaluated using waters_connect for Quantitation Application Manager version 1.9.
Results and Discussion
Semaglutide is a peptide similar to the hormone glucagon-like peptide-1 (GLP-1) used for the treatment of type 2 diabetes and obesity. It has an empirical formula of C187H291N45O59 and a M.W. 4113.641 g.mol−1. Infusion of a 100 ng/mL solution into the Xevo TQ Absolute XR Mass Spectrometer showed that it was detected in positive ion electrospray mode, and formed 5 major peaks at m/z = 1372.01, 1029.26, 823.53, 686.47, and 588.03 corresponding to the [M+3H]3+, [M+4H]4+, [M+5H]5+, [M+6H]6+, [M+7H]7+ ions.
The dominant charge state of peptides observed in the MS can be significantly impacted by mobile phase flow rate and composition. To mitigate this issue, the MRM optimization was operated in combined flow path mode, in which the semaglutide 100 ng/mL solution was infused at a flow rate of 15 µL/minute. This was combined with the LC mobile phase, 80:20 0.1% formic acid (aq):acetonitrile, at a flow rate of 0.2 mL/minute.
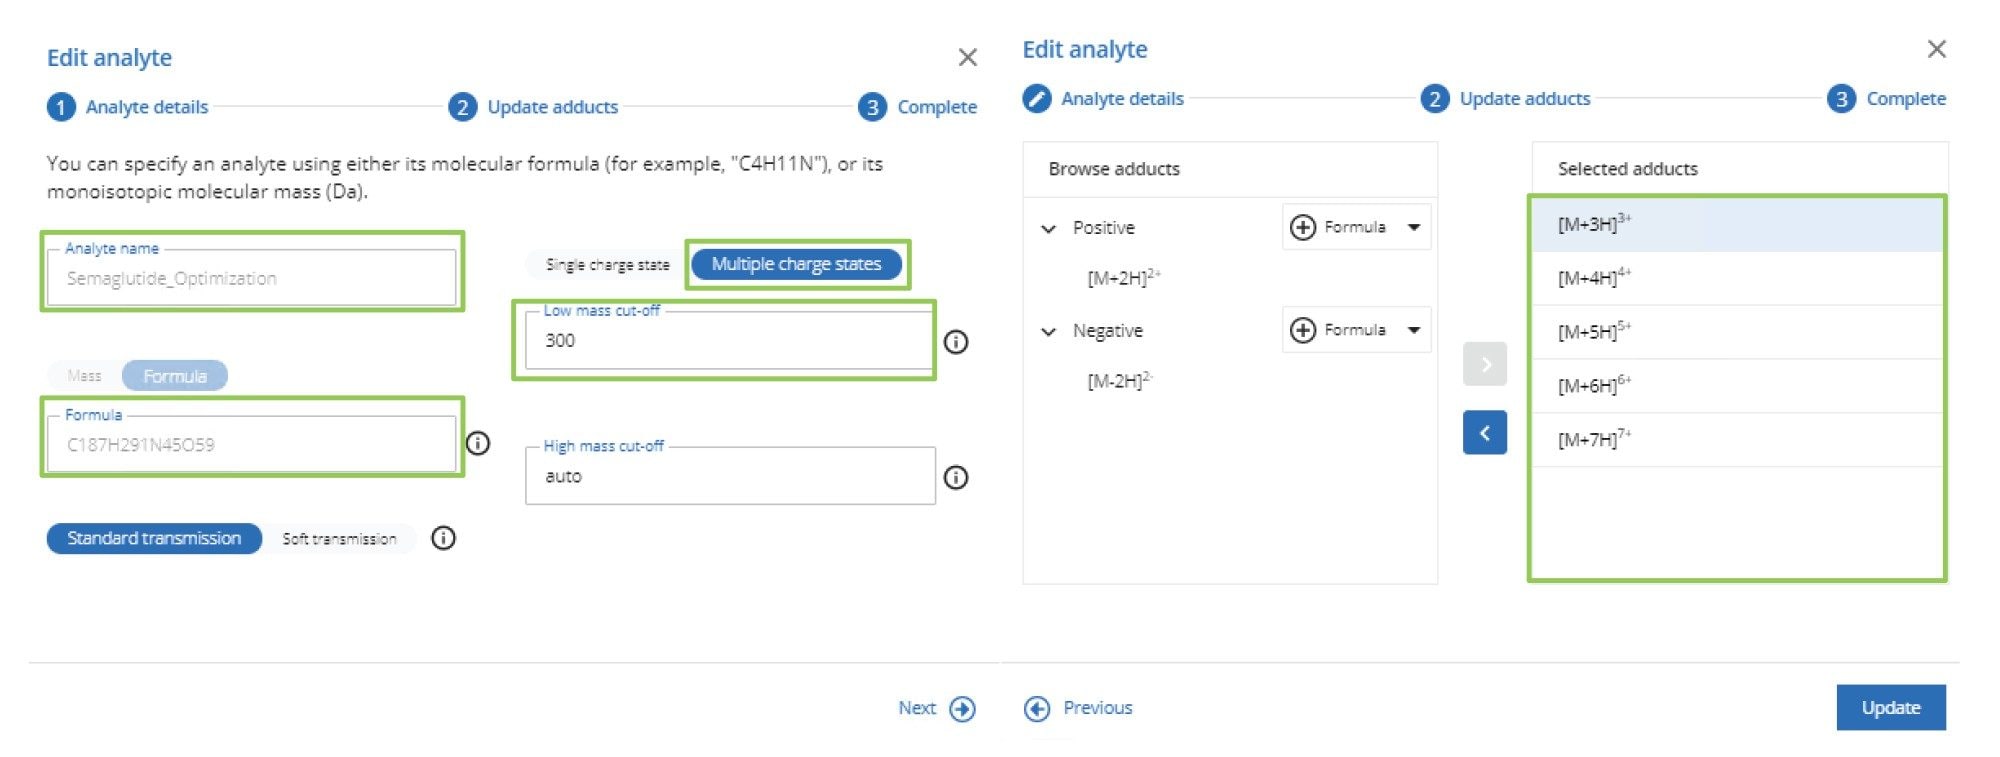
Automated MRM optimization of semaglutide was performed using the Optimization tool within waters_connect for Quantitation Application Manager MS tune page. Details of the analyte name, formula, single or multiple charge state, low-high mass cut-off, and charge states to be evaluated were input into the optimization tool, as shown in Figure 1.
Once the optimization process has been initiated, the MS system will automatically evaluate the MRM parameters. This optimization process is divided into three steps. The first step in the process is precursor ion detection. Here, the MS system will discover ions relating to the various charge state m/z values and the cone volage profile obtained for each precursor ion. Following precursor ion detection, the next step is to perform product ion discovery. At this stage, the precursor m/z → product m/z pairs are identified. Finally, product ion optimization is performed, where the collision energy for the precursor m/z → product m/z pairs is profiled and optimized.
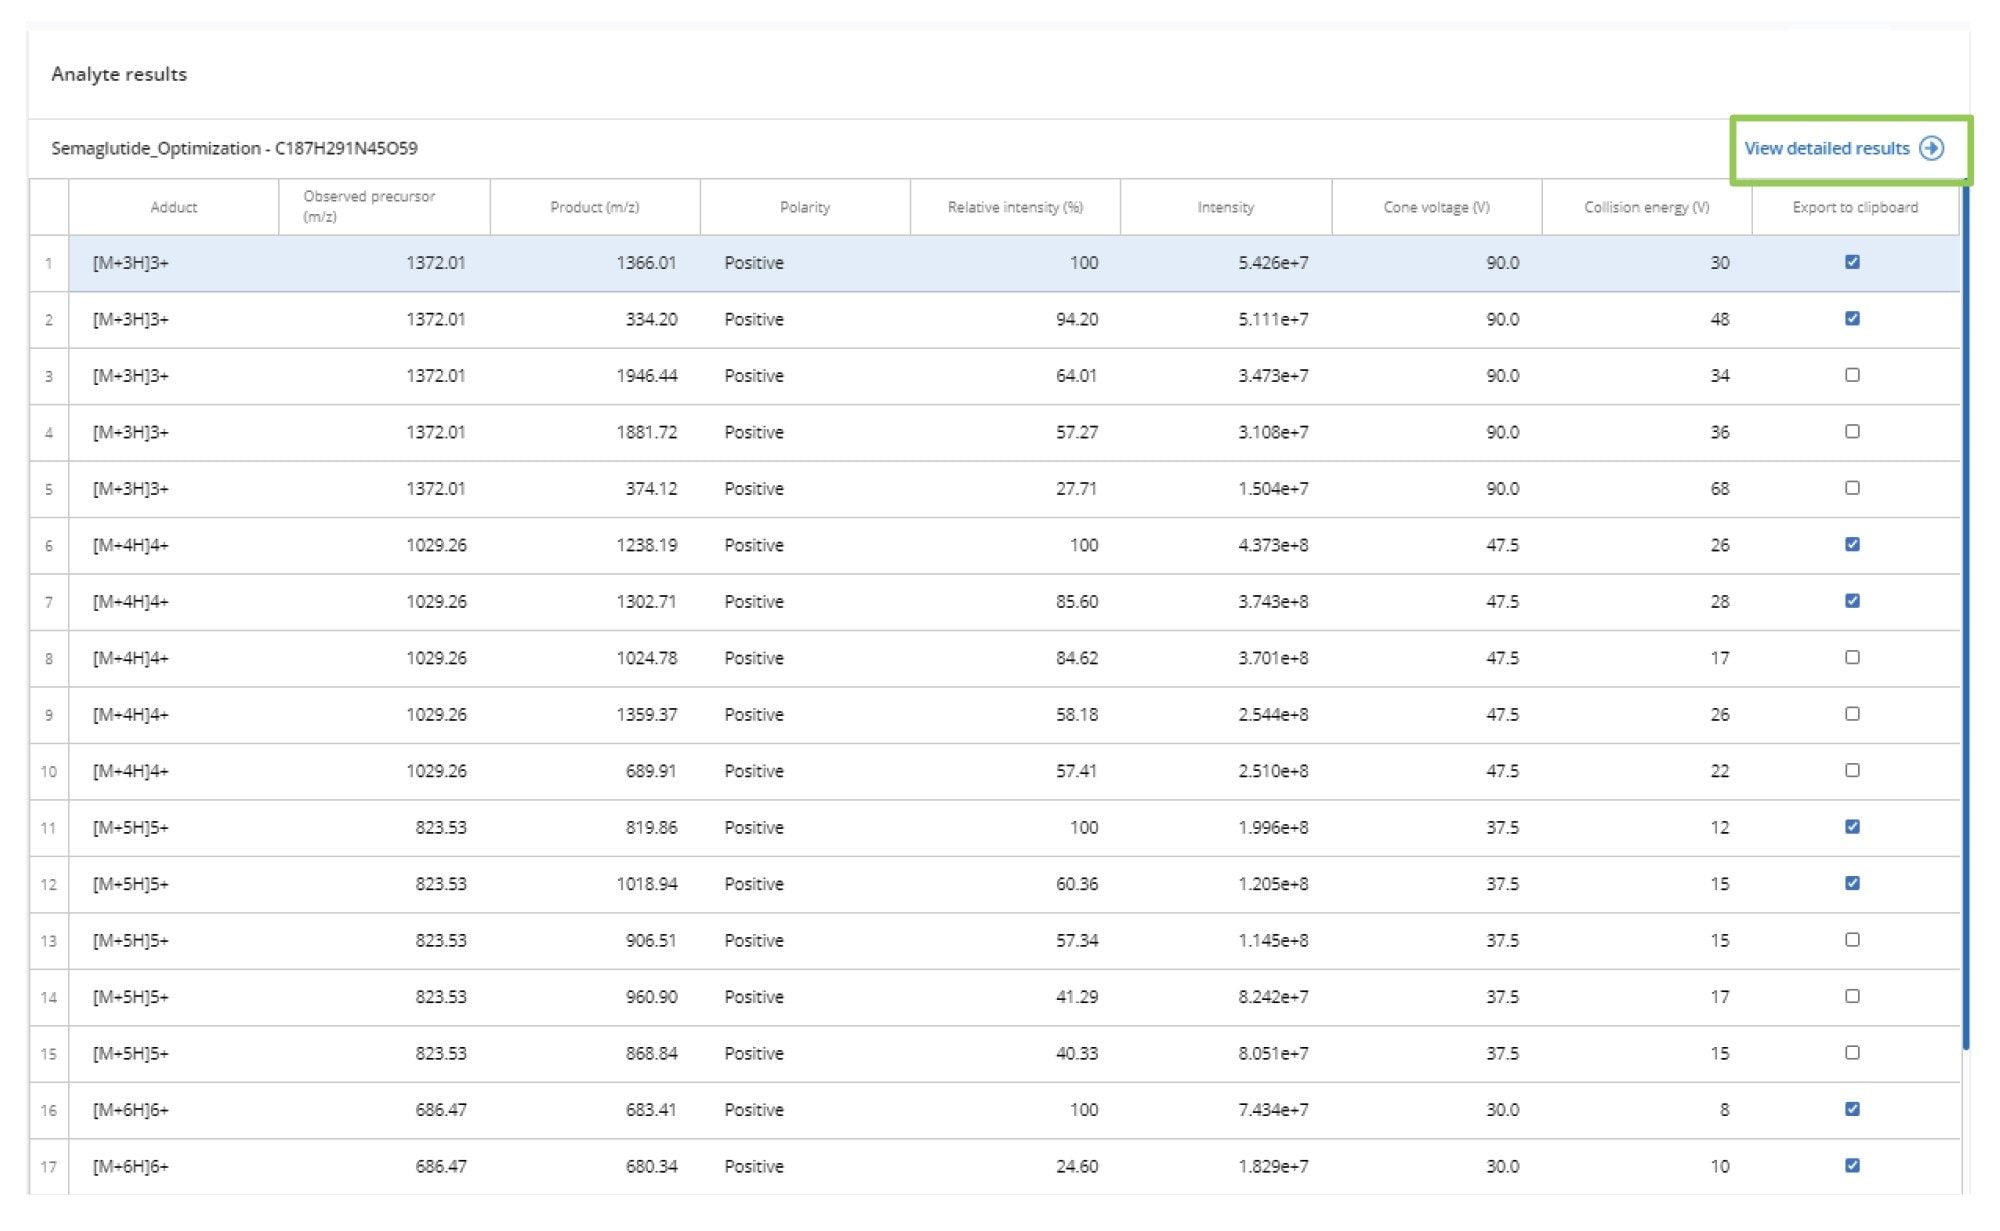
The derived data can be reviewed in the interactive results viewer. The optimized precursor m/z → product m/z pairs and associated CE values are displayed in the summary page with the transitions ranked in terms of intensity for each charge state, as shown in Figure 2.
Precursor Ion Detection
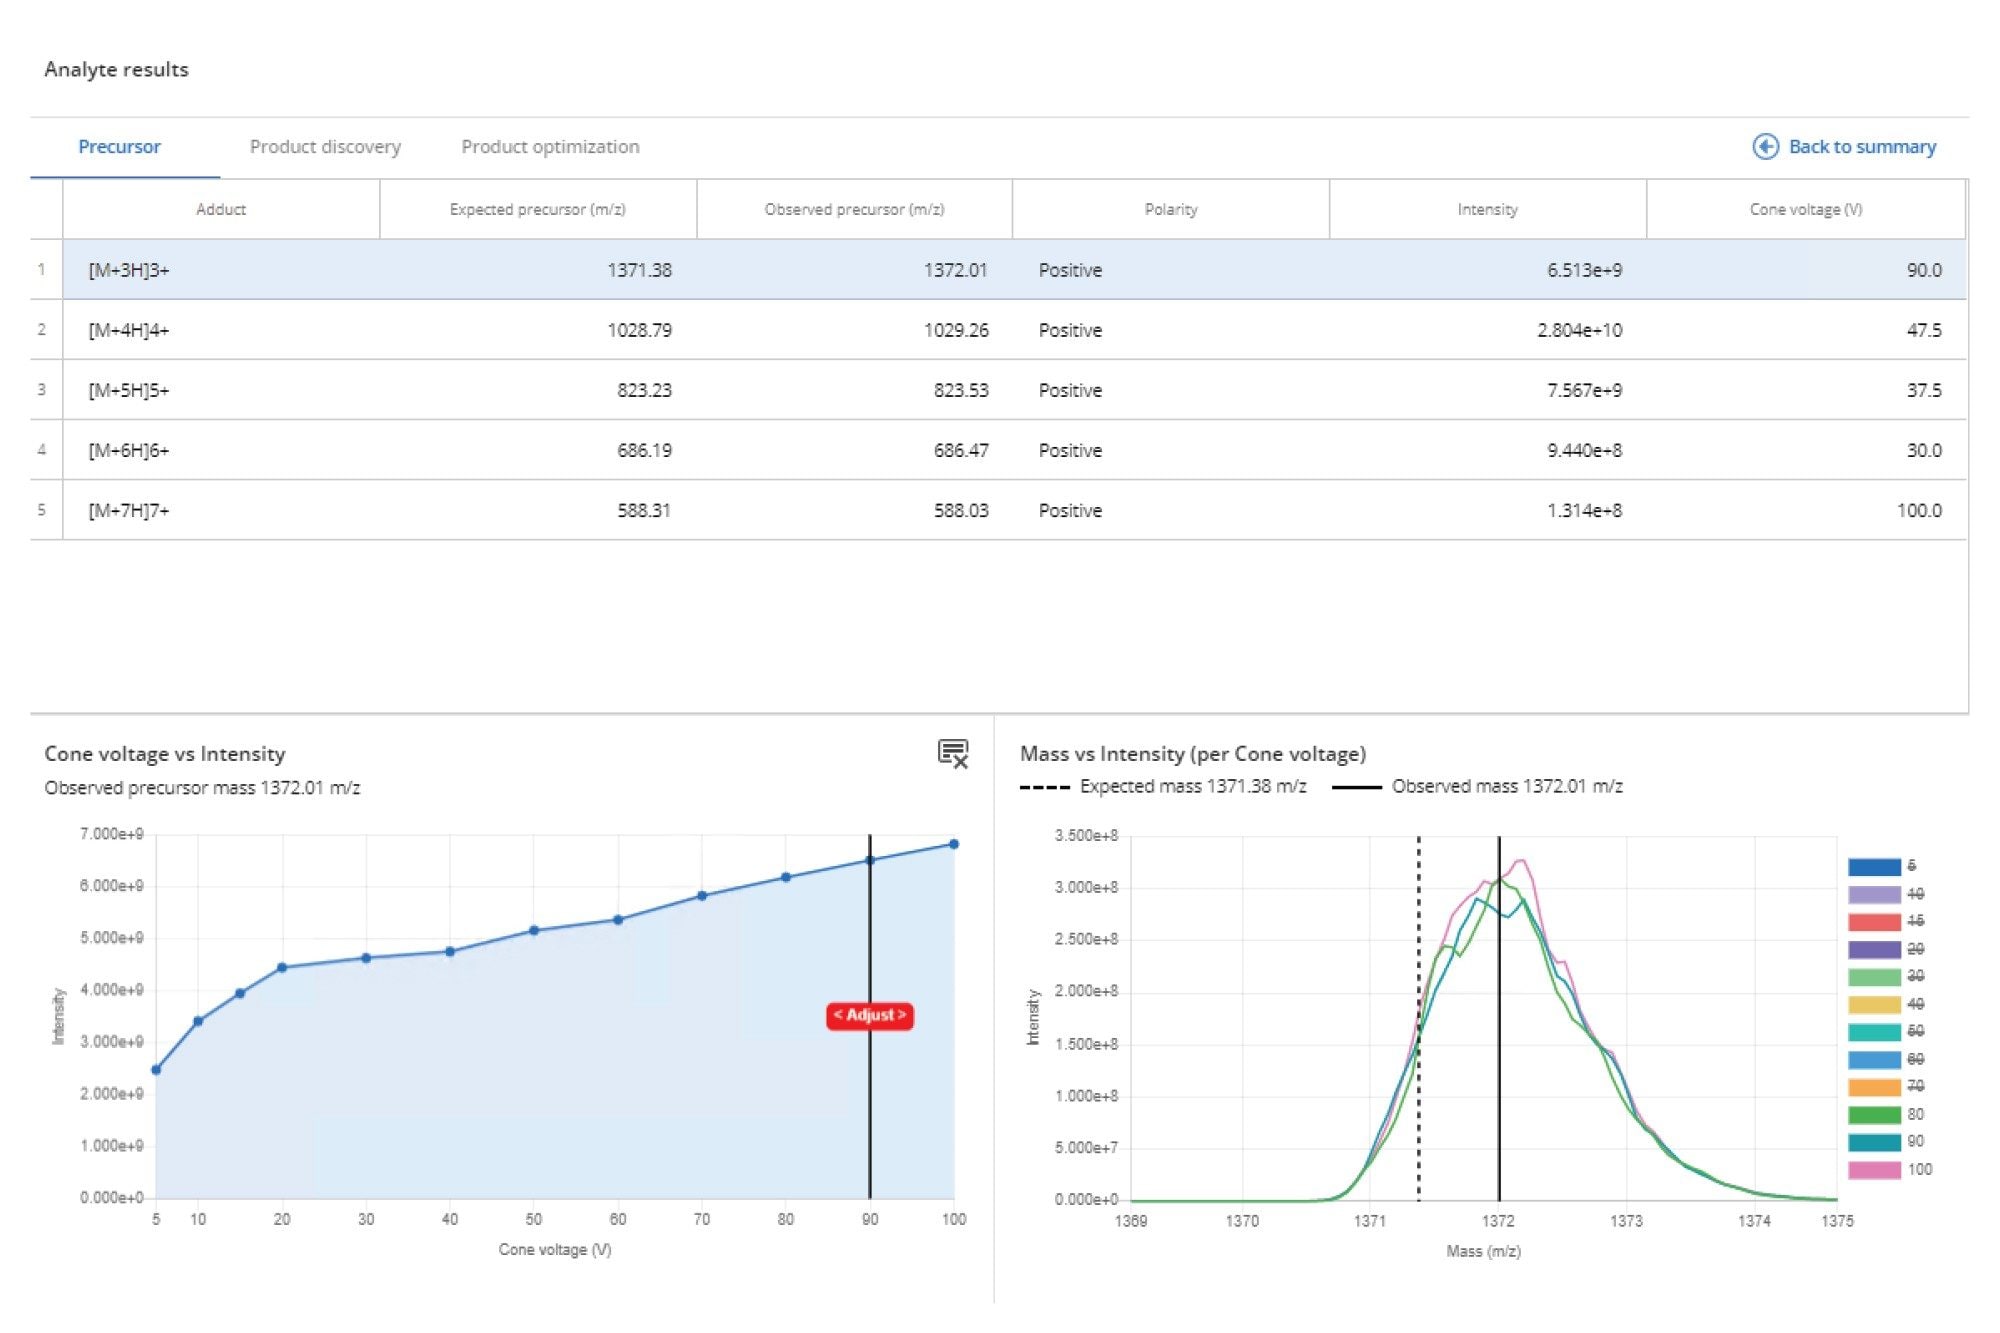
The precursor ion data can be investigated by selecting view detailed results (green box) on the Analyte results page, followed by the Precursor Ion tab, as shown in Figure 3. This window displays all the detected precursor ions, their charge state, observed mass, and cone voltage, as well as signal intensity. This interactive data viewer allows the various cone voltages to be selected to enable deeper investigation of the data.
Product Ion Discovery
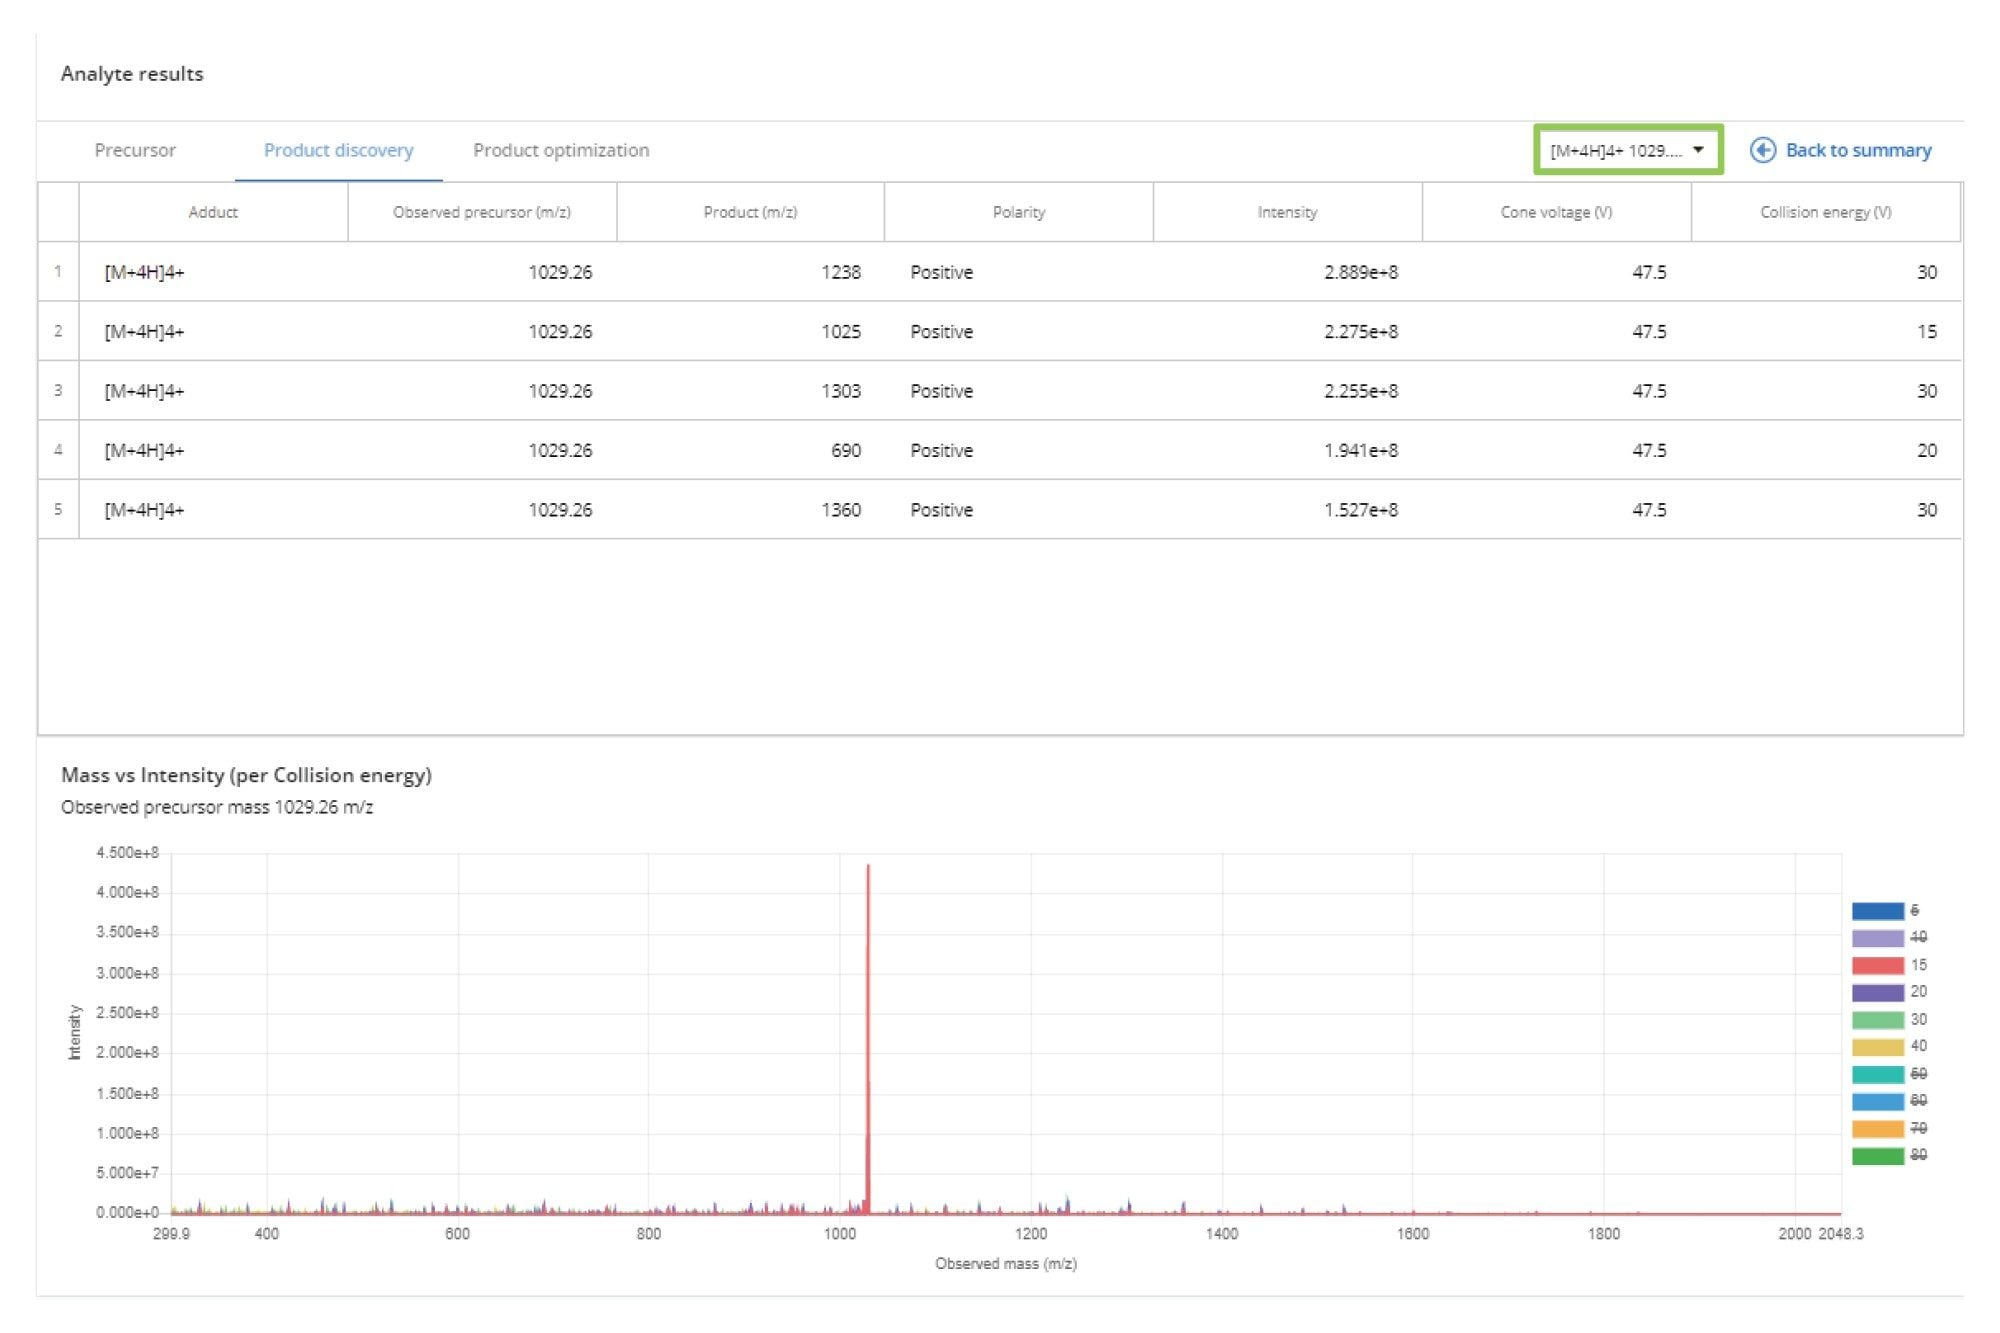
The product ions detected for each precursor ion can be reviewed and compared using the Product Discovery tab, as shown in Figure 4. The data for each individual charge state can be selected from the dropdown menu. The results for all product ions, at the selected precursor ion and at the optimized collision energy (CE), are displayed in descending order of intensity. The resulting MS/MS signal can be reviewed at each CE by selecting or deselecting the CE values from the colored icons on the side of the MS spectrum panel.
Product Ion Optimization
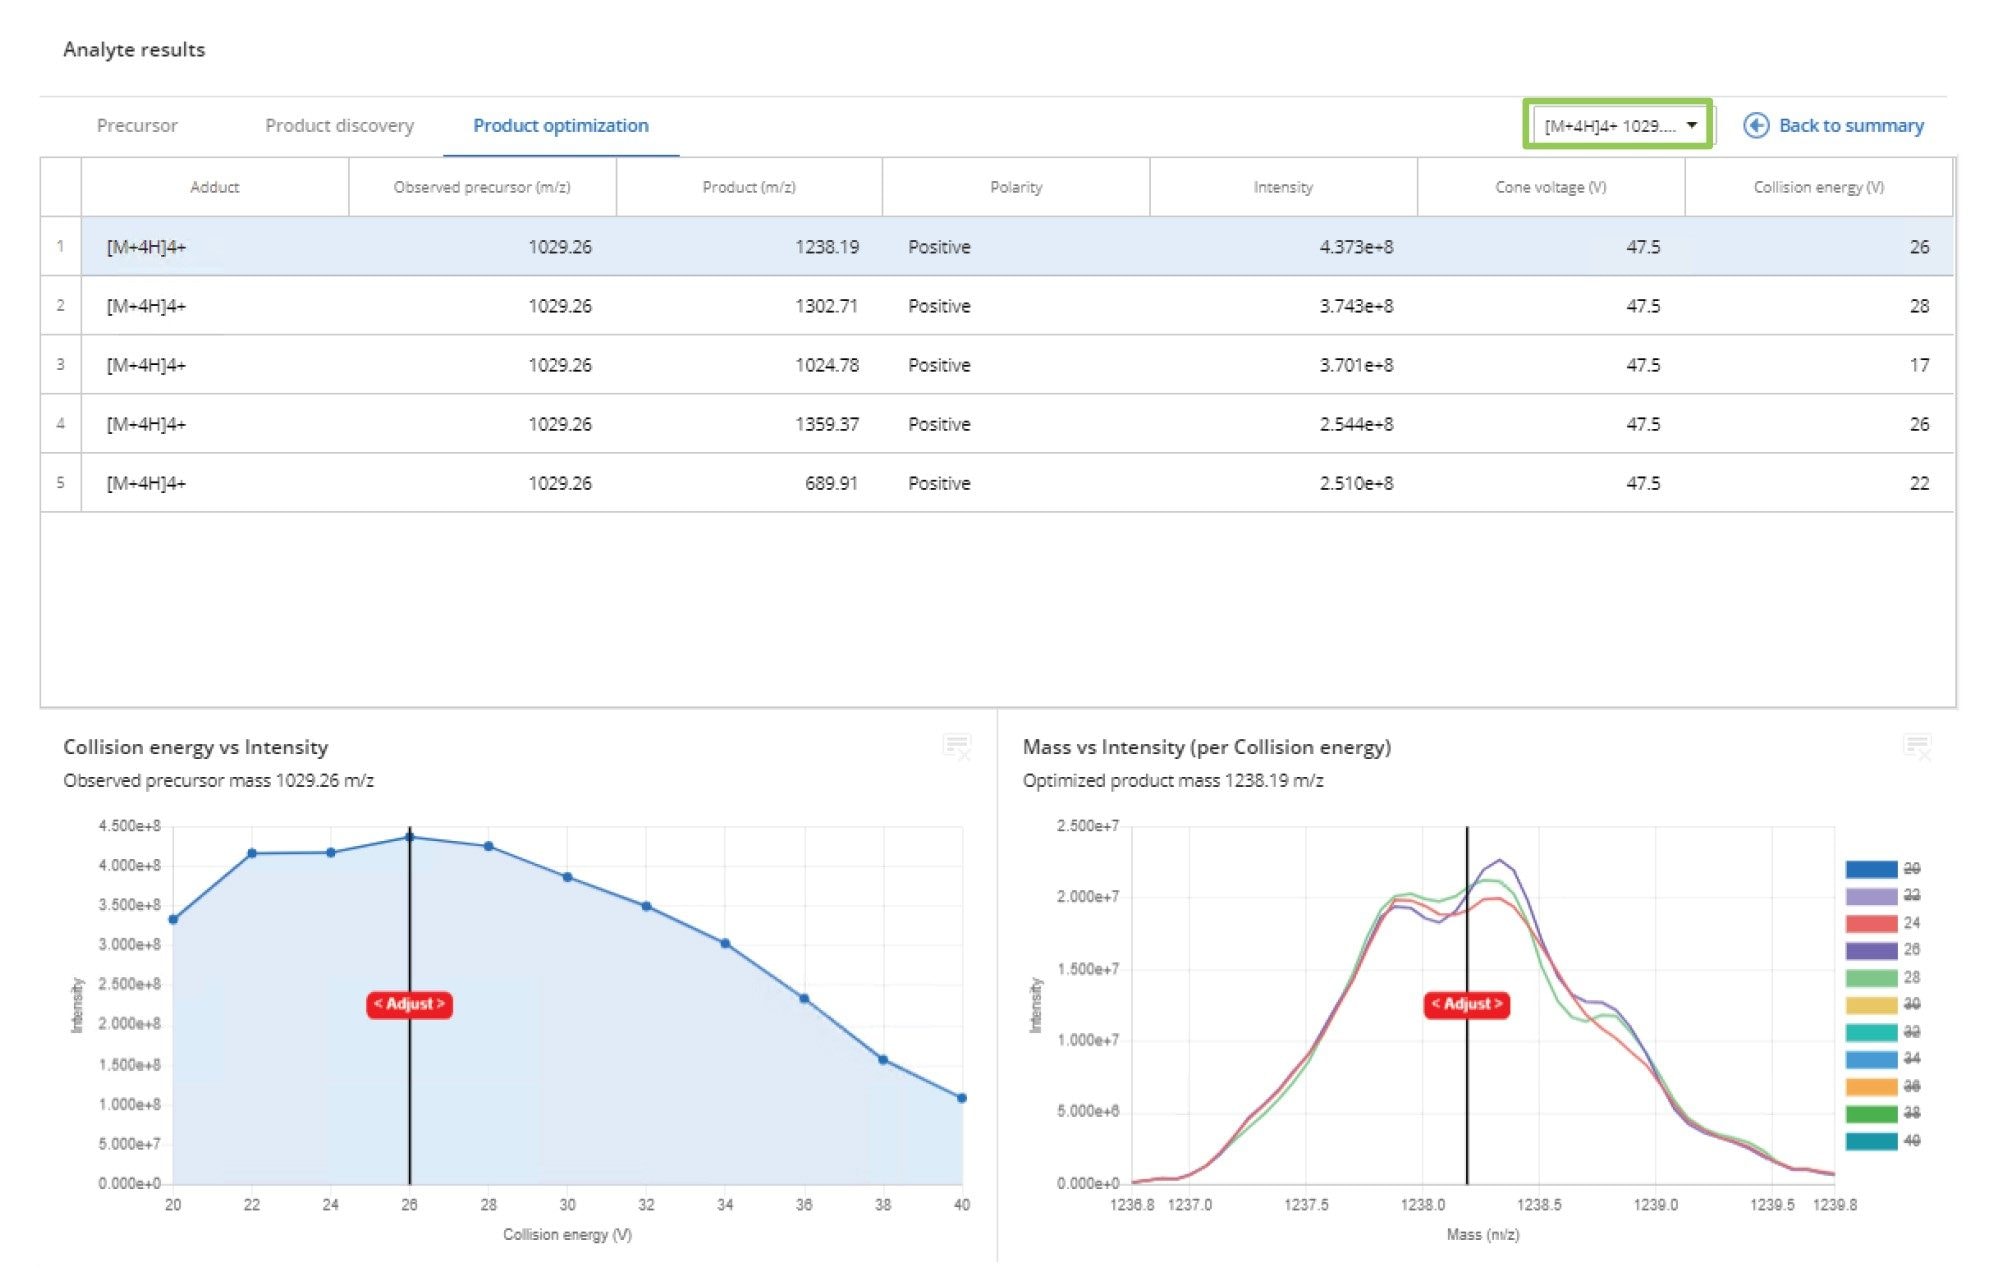
The product ion optimization data is summarized in the Product Optimization tab, as shown in Figure 5. Here, the results of the collision energy optimization for all the product ions at each of the precursor ion charge states is displayed. Once a particular precursor ion → product ion pair has been selected, the collision energy profile can be reviewed for both collision energy vs. peak intensity and mass vs. intensity for each of the selected collision energy values. This data can be used to select not only the most intense transition value, but also the most robust or specific.
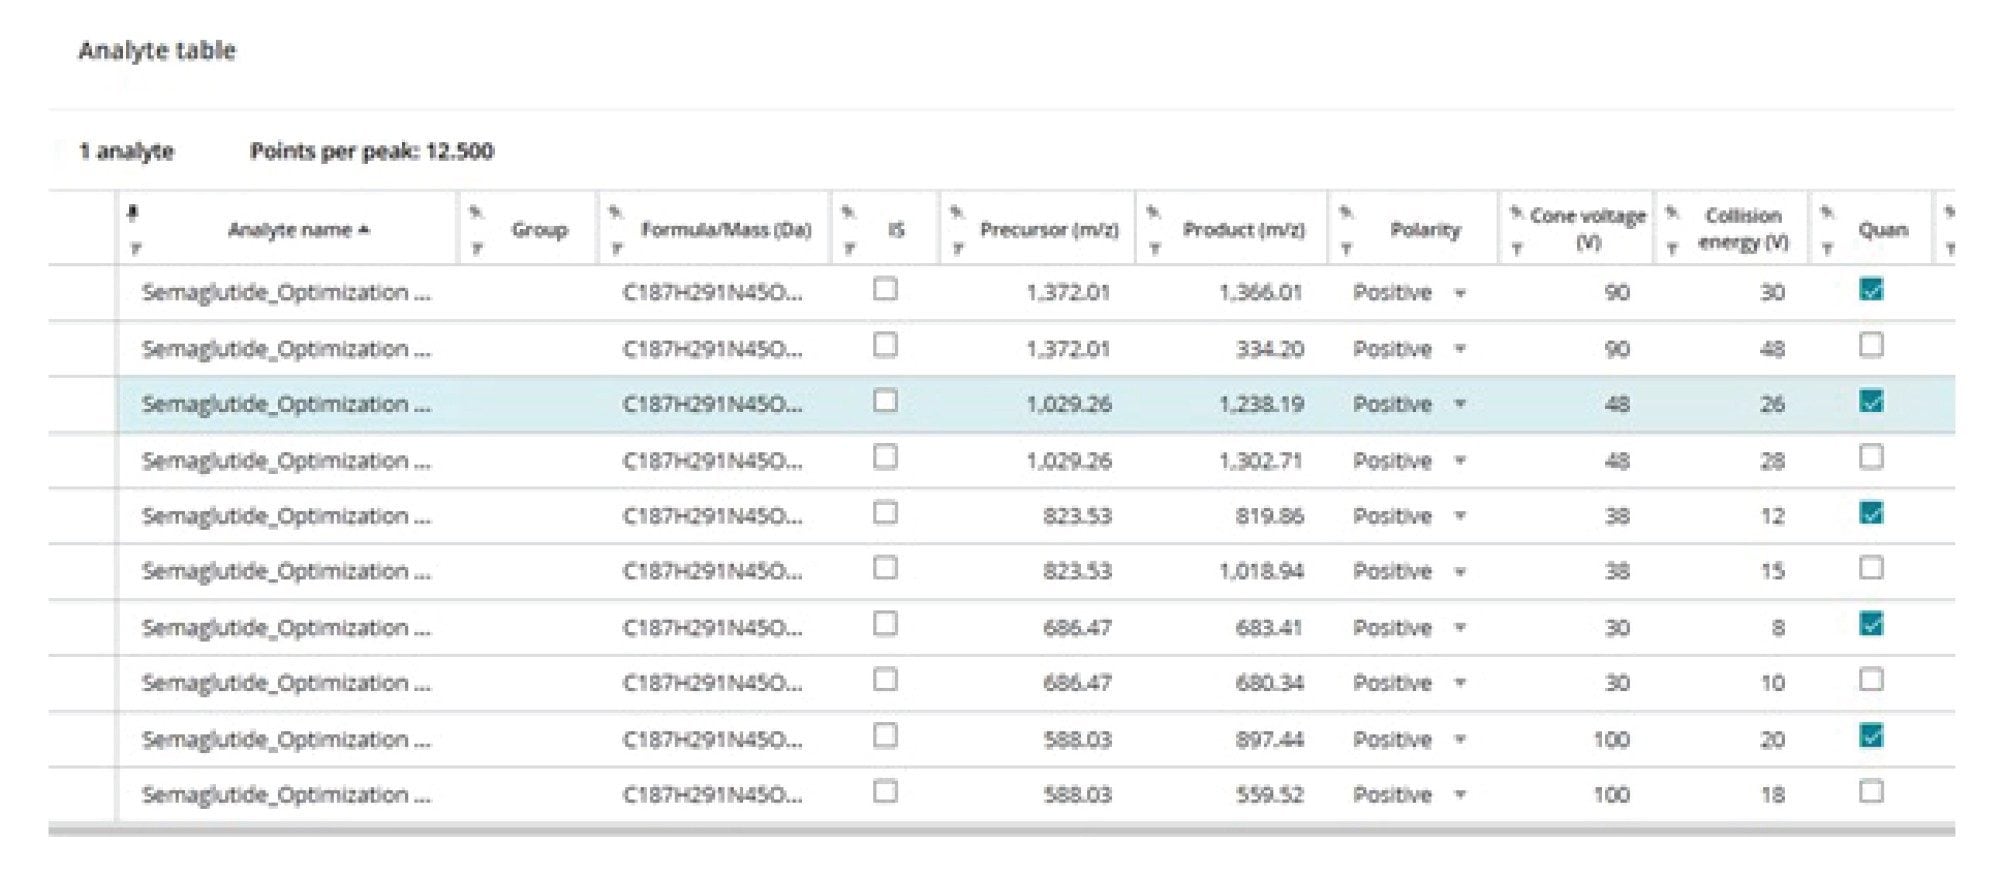
Transfer to Acquisition Method Editor
The results generated using the MRM Optimization tool provide information on the best precursor ion → product ion CE value combinations for further evaluation. The selection of the best transition(s) to be used in sample analysis must be made by evaluating the specificity, selectivity, and background noise with an extracted real sample under chromatographic separation conditions. To simplify the transfer of transitions of interest to the LC method, the precursor ion → product ion pairs of interest can be selected in the results summary via the “export to clipboard” check list, as shown in Figure 2. These MRM transitions can then be exported to, via the export function, and imported into the Acquisition Method Editor for chromatographic evaluation, thus eliminating any potential transcription errors, as shown in Figure 6.
Conclusion
The number of candidate biomolecule drugs, peptides, oligonucleotides, and proteins in pharmaceutical discovery and development is steadily increasing. These biomolecules require the development of quantitative LC-MS/MS assays to support discovery, preclinical, and human DMPK studies. Unlike small molecules, these biomolecules form multiply charged ions in the MS source, making MRM method development more challenging, as multiple charge state–product ion combinations must be evaluated and compared. The Optimization tool in waters_connect for Quantitation Software provides an automated, fast platform for the optimization and evaluation of the precursor ion → product ion pairs formed at each charge state, simplifying the process of LC-MS/MS method development for biomolecules.
720009123, November 2025