Routine Comprehensive Tissue Imaging on the Xevo™ G3 QTof Mass Spectrometer Using a DESI™ XS Source
Abstract
Investigating the performance of the Xevo G3 QTof Mass Spectrometer coupled with a DESI XS source, equipped with the Waters™ high performance sprayer and heated transfer line, to rapidly acquire whole murine brain images. We demonstrate that sensitive, comprehensive data can be acquired irrespective of scan speed.
Benefits
- A QTof platform offering superior sensitivity for DESI analysis
- Imaging speed can be increased whilst retaining excellent data quality for routine MS imaging applications
- Robust, reproducible, and flexible MS Imaging, discovery and characterization instrument
Introduction
With mass spectrometry tissue imaging experiments, a limiting factor can be the time required for a full tissue image to be created. It has often been observed that the lower the scan rate during image acquisition, the intensity of the data achieved is higher and therefore, historically, the data richer.
We demonstrate here, that although increasing the data acquisition speed results in a proportional reduction of peak intensity, this has little effect on data quality in terms of the relative abundances of lipids, number of detected features, and overall analyte distribution.
The Waters Xevo G3 QTof Mass Spectrometer provides a powerful, robust, and flexible platform for MS imaging analyses. It offers great sensitivity, a dynamic range of up to five orders of magnitude, a ~30,000 FWHM mass resolution, and routinely provides sub 2 ppm mass accuracy.
Being a QTof Mass Spectrometer, it has the option of multiple data acquisition modes including but not limited to: MS, MSMS, and SONAR. Making this an ideal platform for MS imaging applications as well as classical discovery and characterization analyses, allowing each laboratory to tailor their experiments to their specific needs.
Experimental
A murine brain was sectioned at 18 µm onto glass microscope slides. These sections were analyzed with no further treatment on a Xevo G3 QTof Mass Spectrometer coupled to a DESI XS source with high-performance sprayer and heated transfer line.
MS Conditions
|
MS system: |
Xevo G3 QTof Mass Spectrometer |
|
Source type: |
DESI-XS |
|
Cone voltage: |
30 V |
|
Source temperature: |
150 °C |
|
Acquisition range: |
50–1200 |
|
Analyzer mode: |
Sensitivity, negative ionization mode |
|
Experiment type: |
MS |
DESI Setup
|
Capillary voltage: |
0.6 V |
|
Nitrogen flow: |
15 psi |
|
Solvent: |
98% Methanol 2% Water |
|
Solvent flow rate: |
2 µL/min |
|
Heated transfer line temperature: |
450 °C |
|
Pixel size: |
50 µm |
|
Step rate: |
100, 250, 500, and 1000 µm/s |
|
Equivalent scan speed: |
2, 5, 10, and 20 scans per second |
Data Processing
MS data were manually assessed using MassLynx™ Software prior to being processed in High-Definition™ Imaging (HDI™) Software for image visualization.
Results and Discussion
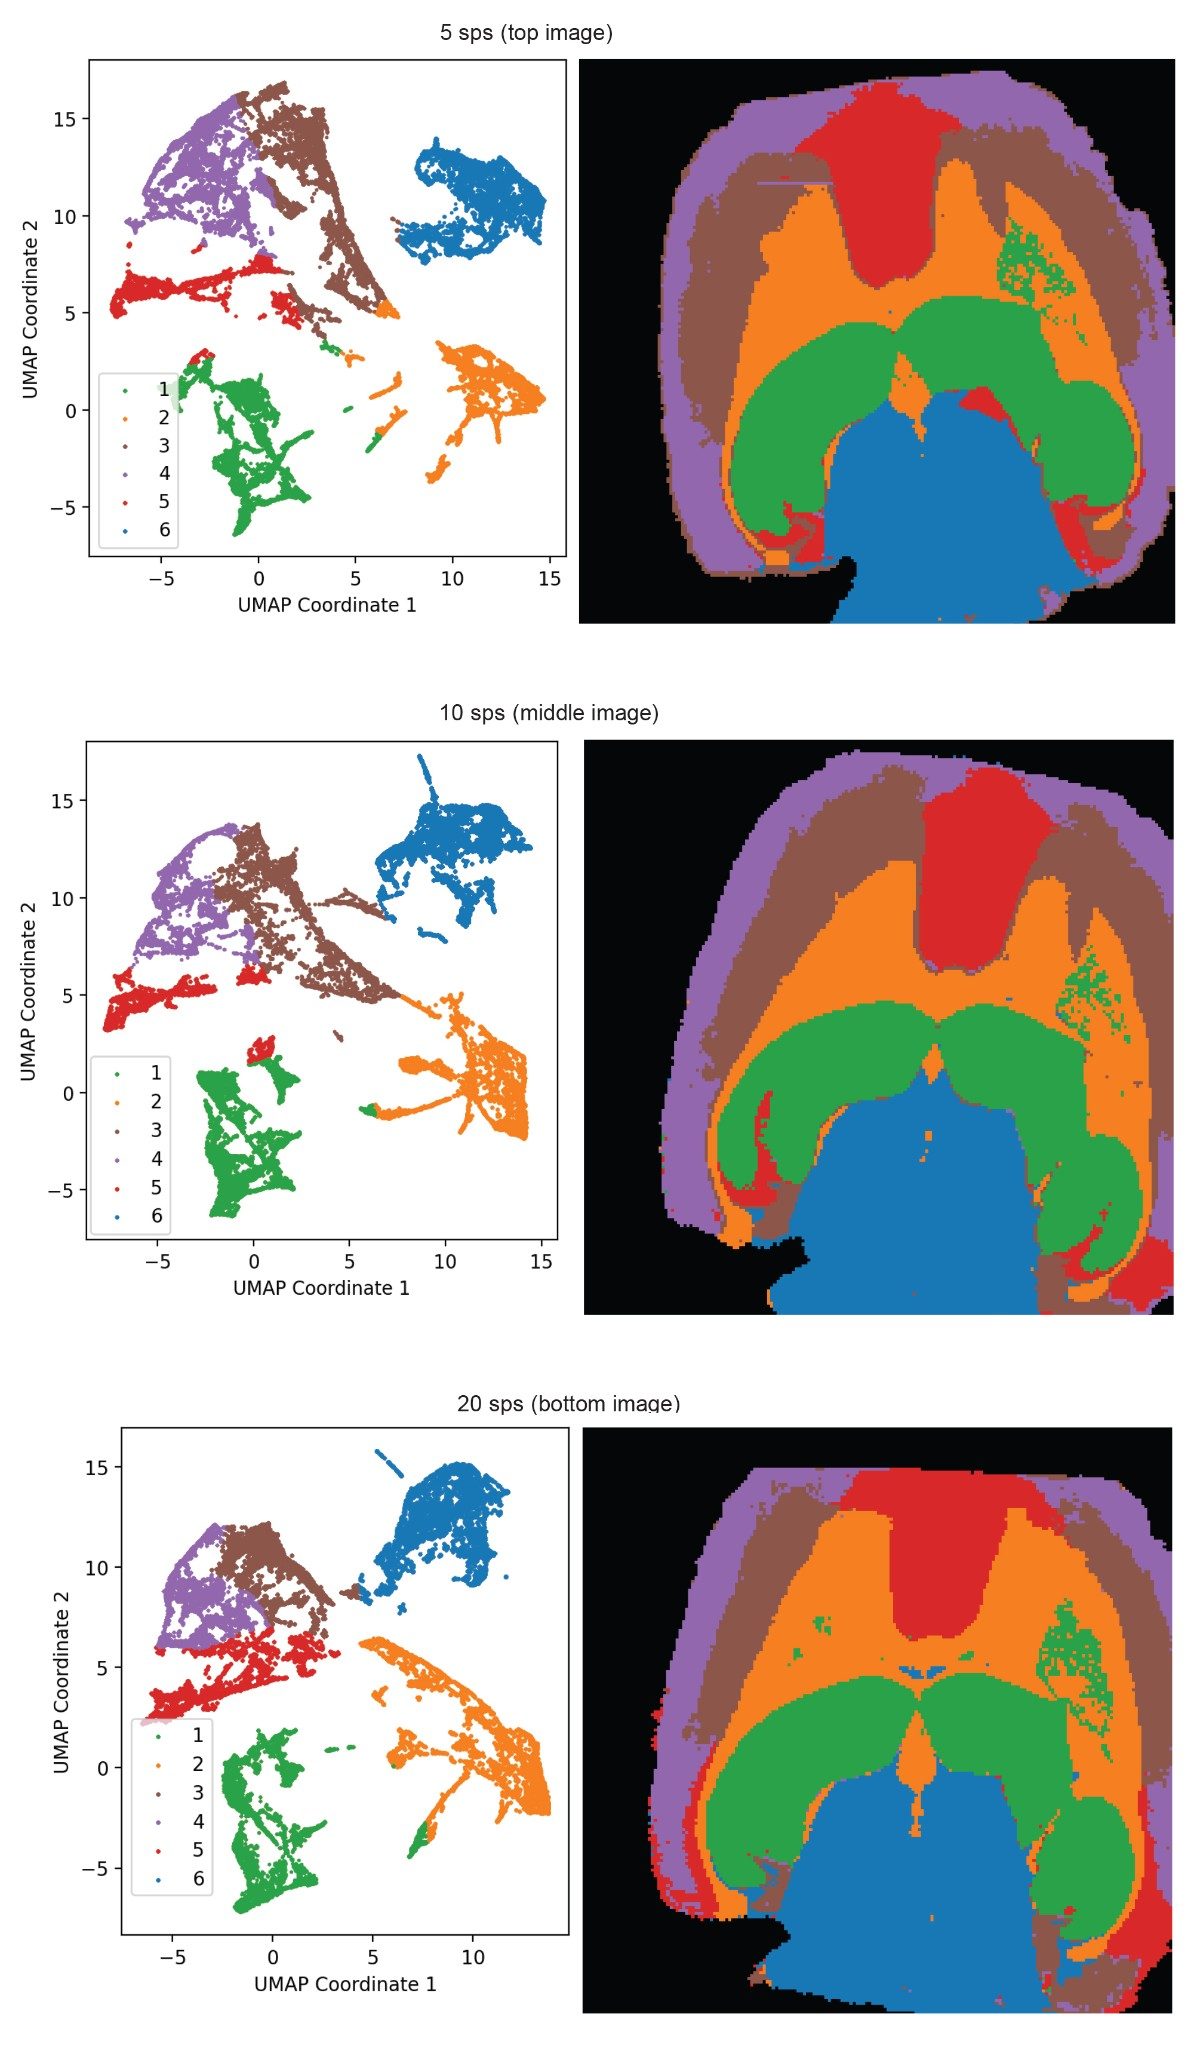
For each data set, acquired with differing acquisition speeds, distinct structures within the tissues were identified by segmentation mapping using the MSI segmentation MicroApp Waters Microapp Store. This utilizes UMAP (Uniform Manifold Approximation and Projection) and HBDSCAN (Hierarchical Density-Based Spatial Clustering of Applications with Noise) for rapid spectral segmentation.
The segmentation analysis results were used to indicate structural boundaries within the tissues, and it is shown that these do not change significantly when data is acquired at differing acquisition speeds. The images seen within Figure 1 show a high degree of visual similarity between the three different scan speeds, indicating that the segmentation software processes the three acquisitions comparably. Each scan speed was performed upon a consecutive tissue section and therefore slight variations within segment shape are likely due to biological variance between the consecutive brain sections.
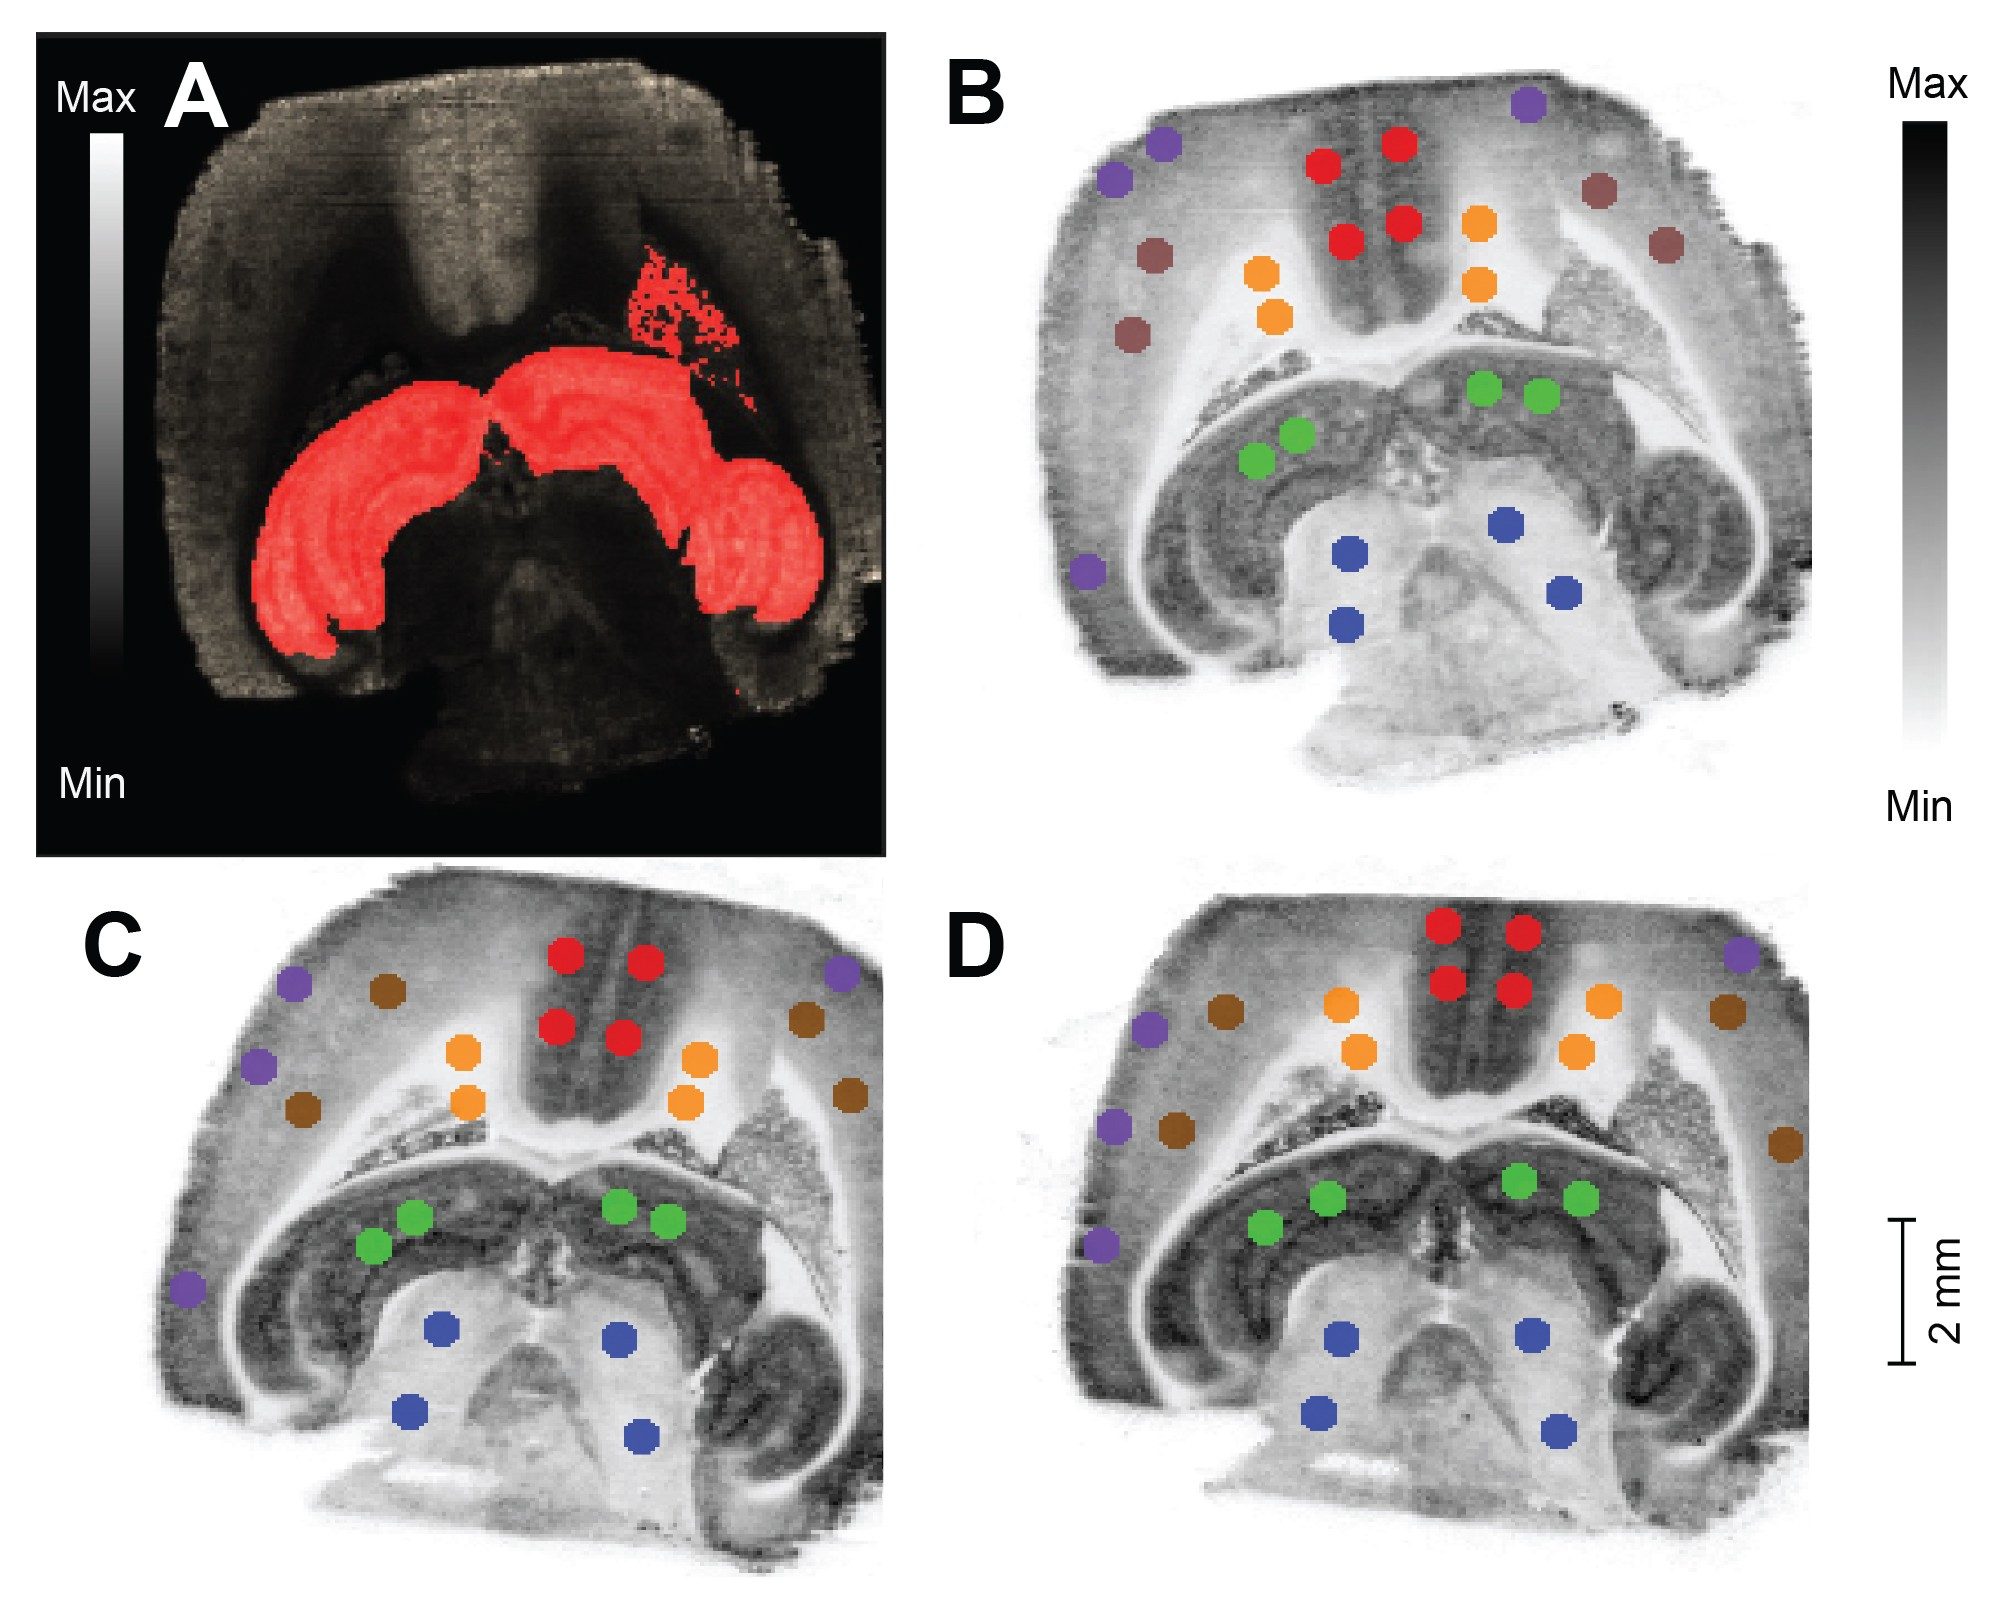
Utilizing the information provided by the segmentation tool four regions of interest (ROIs) were manually drawn and exported from each tissue structure/segment, for each of the acquisition speed datasets Figure 2. Each of the colored circles indicates an ROI exported for further analysis. The first image (A) shows a typical segment view in HDI when imported from the segmentation tool, the further three images (B-D) show the ROIs exported from each segment for each scan speed.
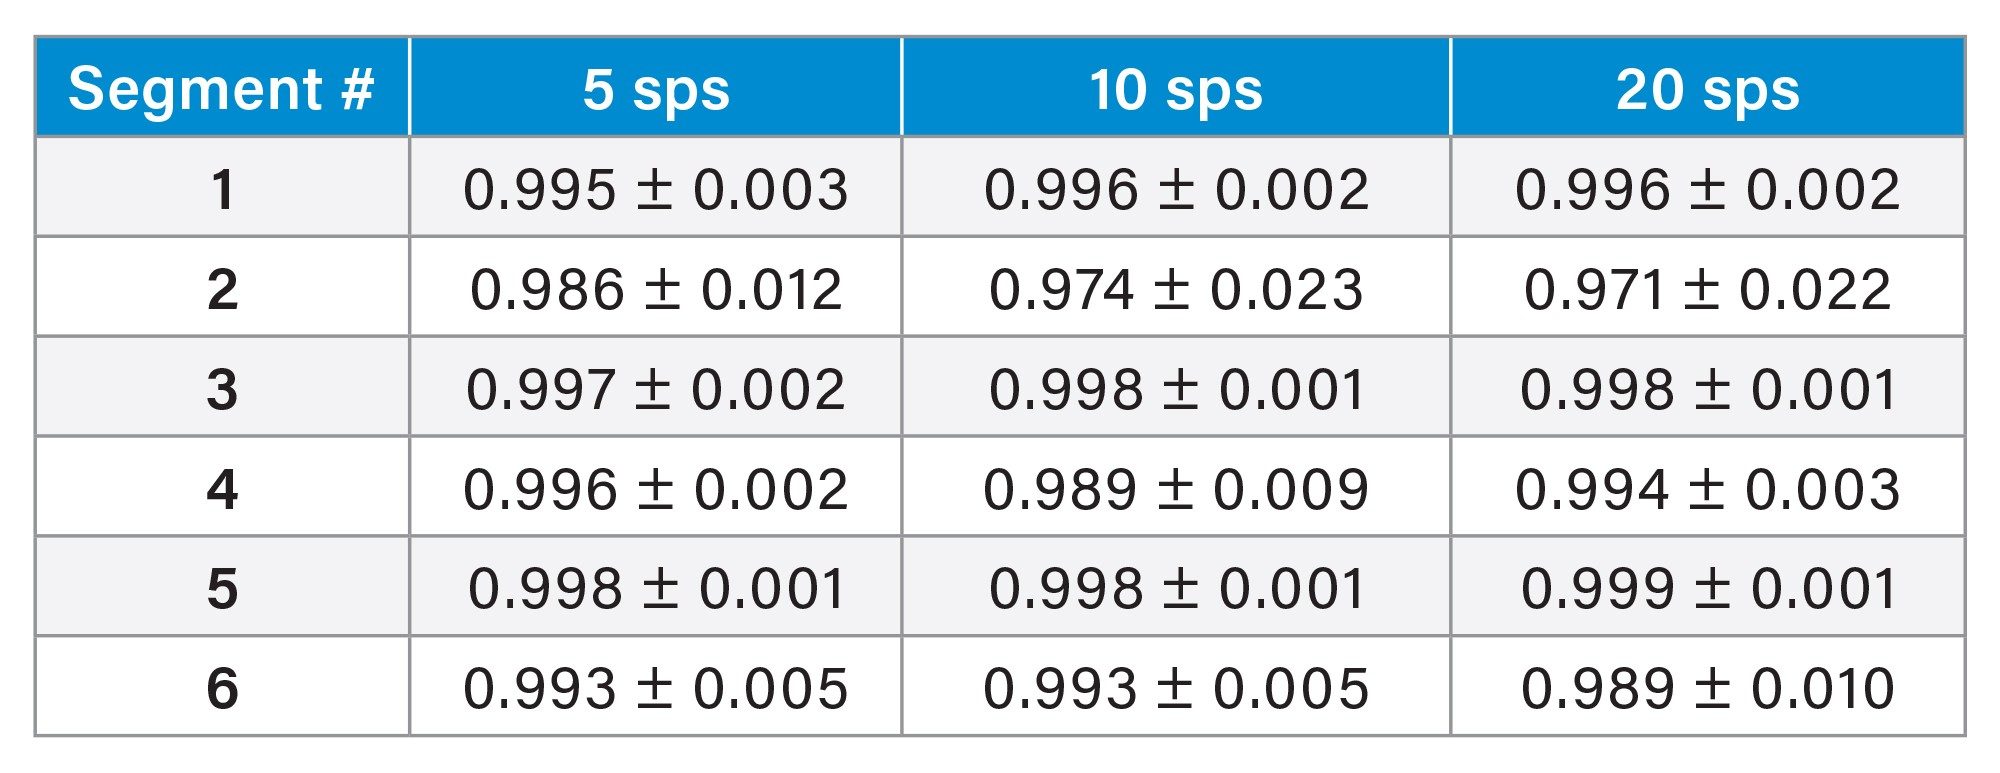
Spectra from the matching regions of interest showed a high degree of correlation between the different acquisition speeds. To demonstrate this the resulting peak profiles were plotted against each other as a graph and assessed for similarity, by examining the slope and correlation (R2) value of the generated plots.
Firstly, the normal biological variation within the tissue sections was compared to establish a normal expected deviation value for the tissue, this is displayed in Table 1. This is the variation seen within each of the four exported ROIs for each segment (as seen in Figure 2) and highlights the very small biological variation.
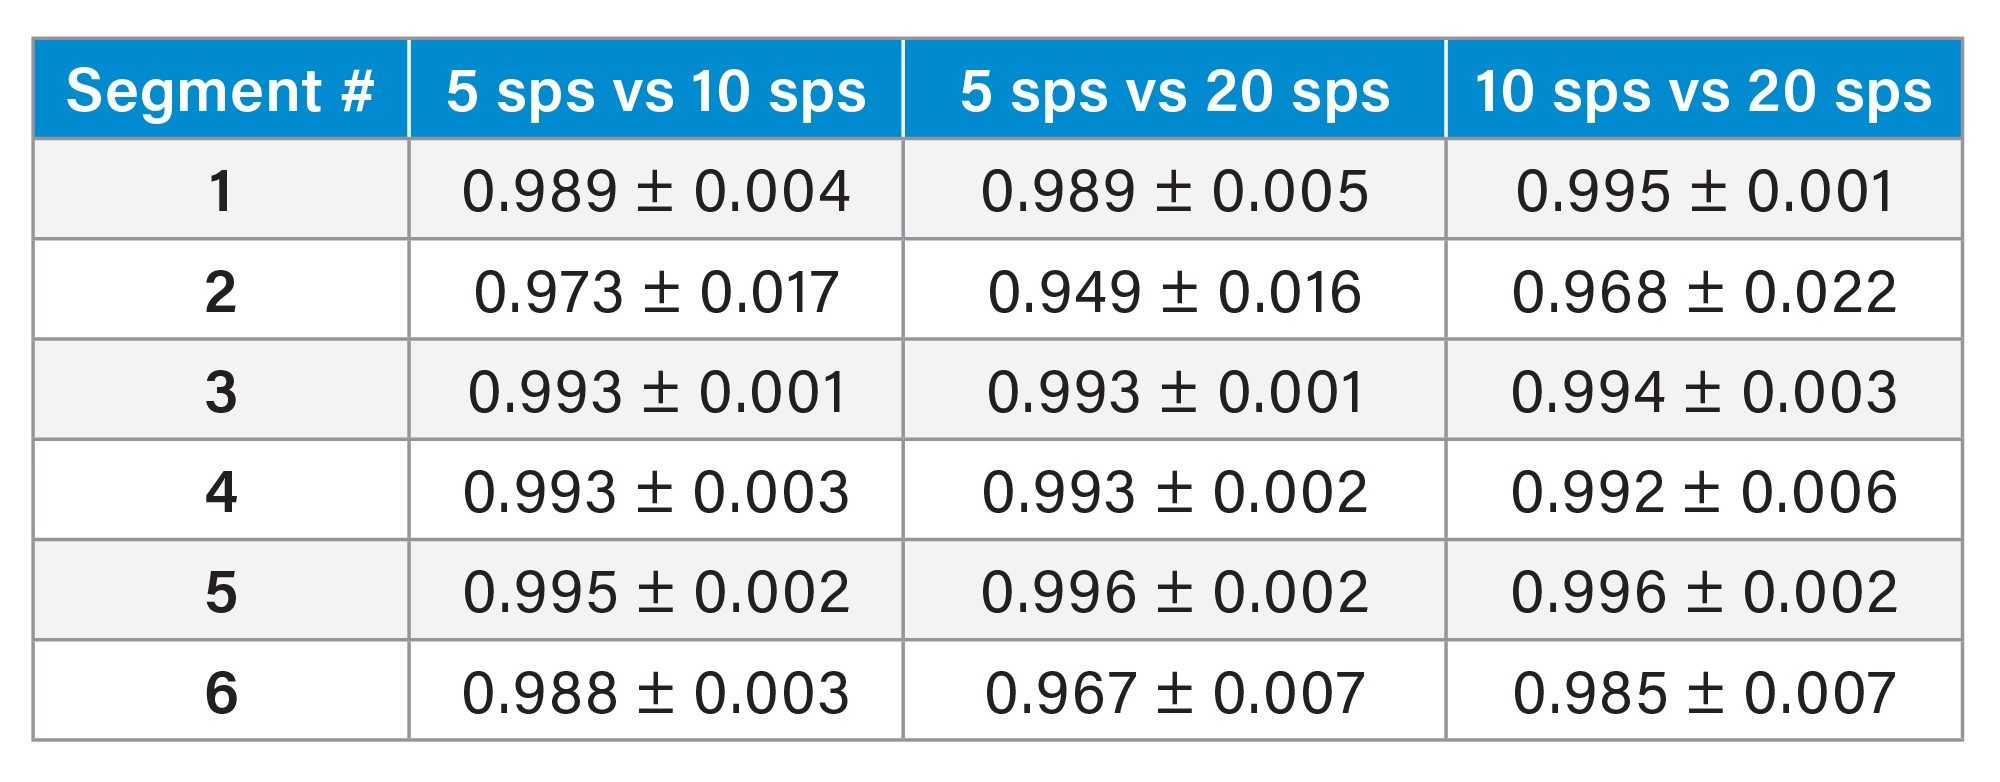
Following this, the variation was calculated for the data acquired at different scan speeds. As each scan speed was performed on subsequent tissue sections, the inherent biological variation will also impact the correlation values seen within Table 2. The values in Table 2 are the R2 of the correlation when all twelve ROIs are plotted within the same graph and show a good correlation between the data acquired at differing speeds.
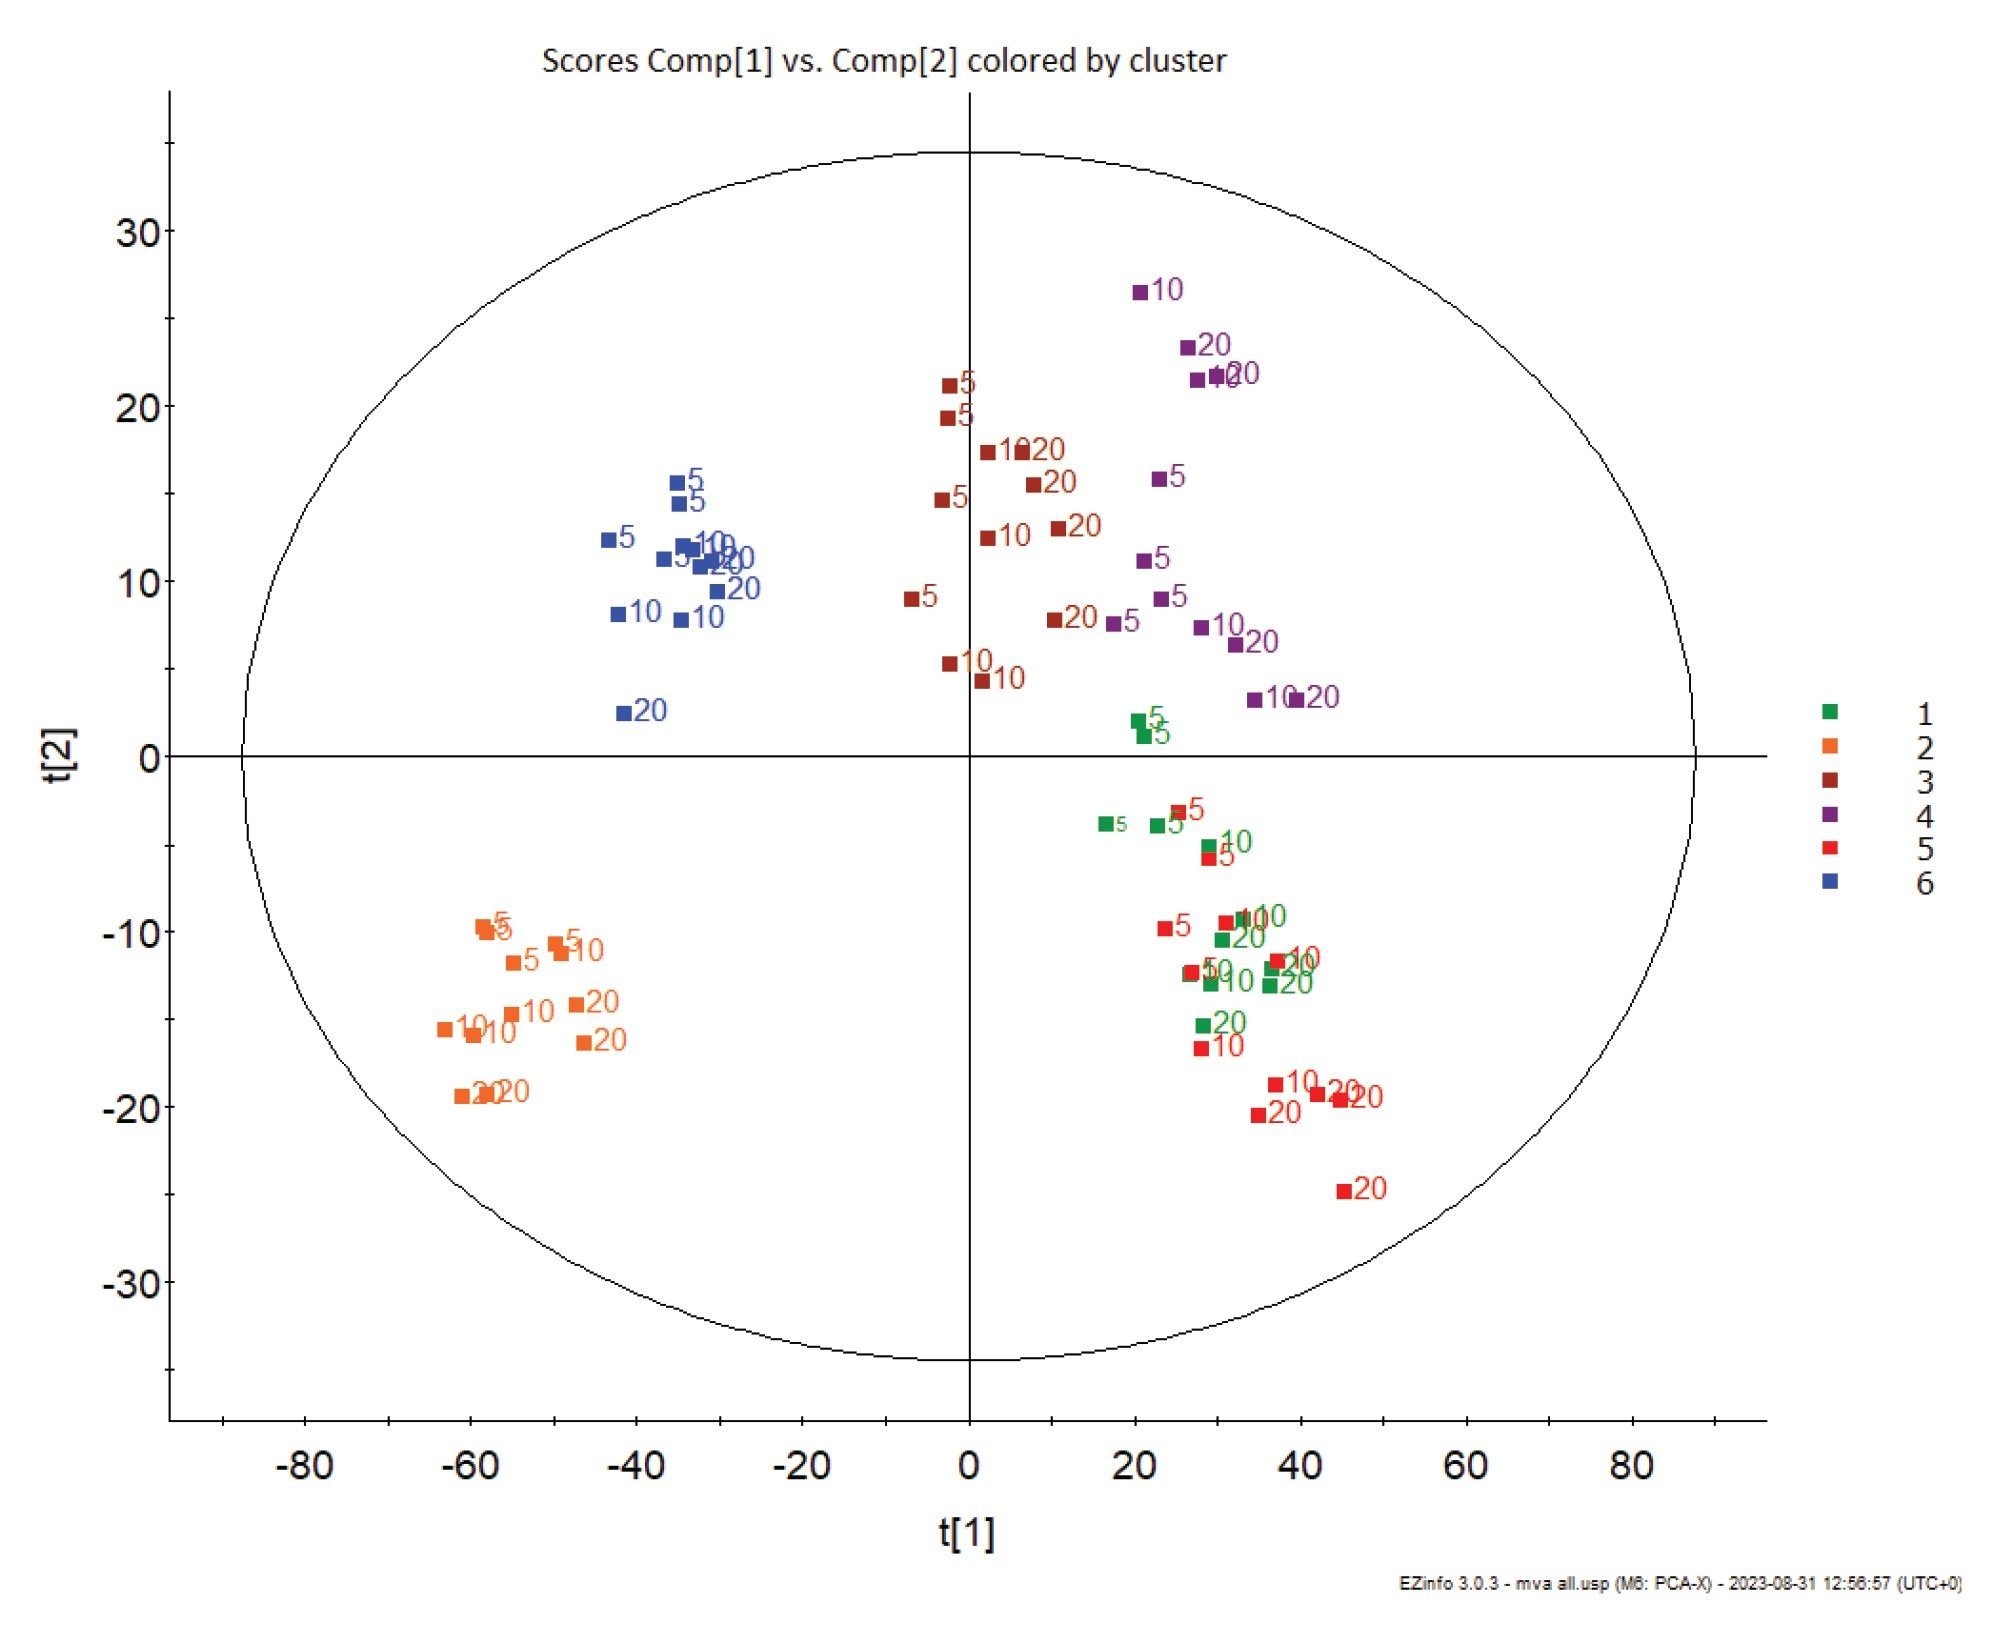
TIC normalization was utilized to compensate for the signal reduction resulting from the increased acquisition speed and the same ROIs were imported into an unsupervised PCA plot. Each tissue region clearly clusters based upon segment and there does not appear to be significant PCA separation observed due to scan speed. This proves that biological variation is of greater significance than scan speed for ROI differentiation.
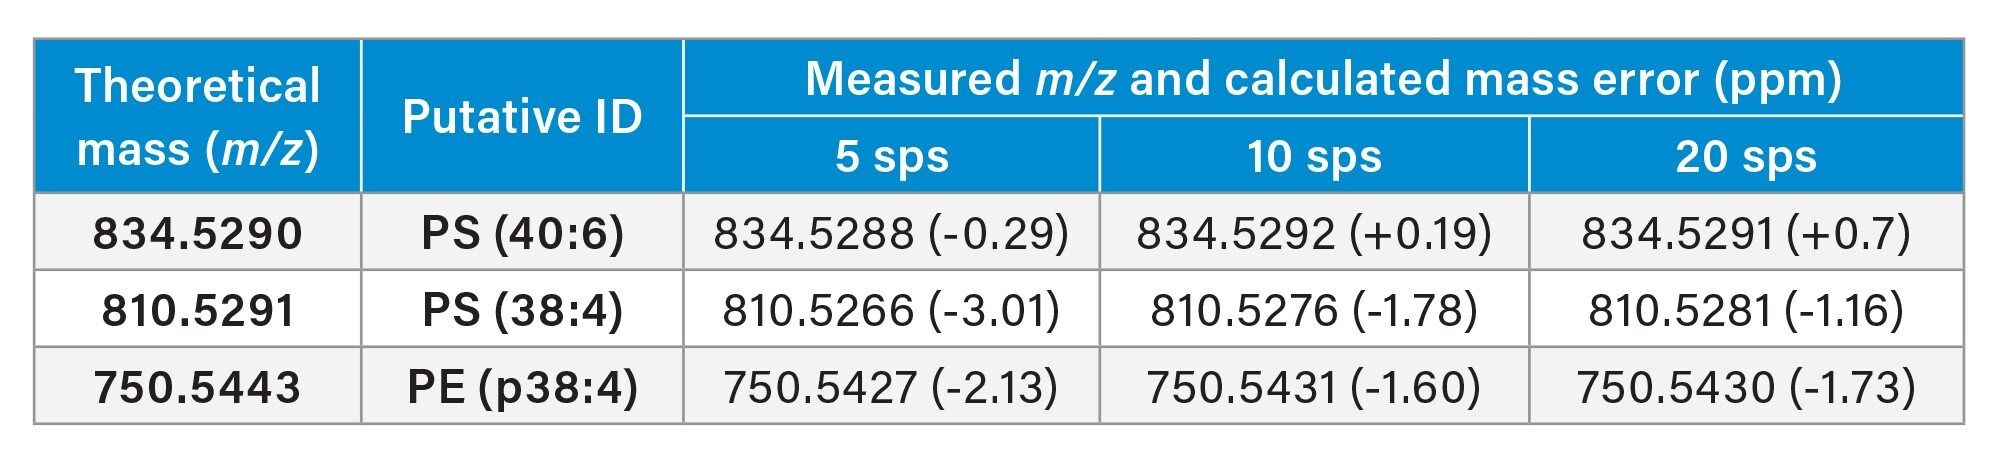
Processing the consecutive murine brain sections, we were able to successfully identify key lipid markers of the prominent tissue regions in all acquired images. From this we can demonstrate that with increased scan speed mass accuracy remains consistent Table 3.
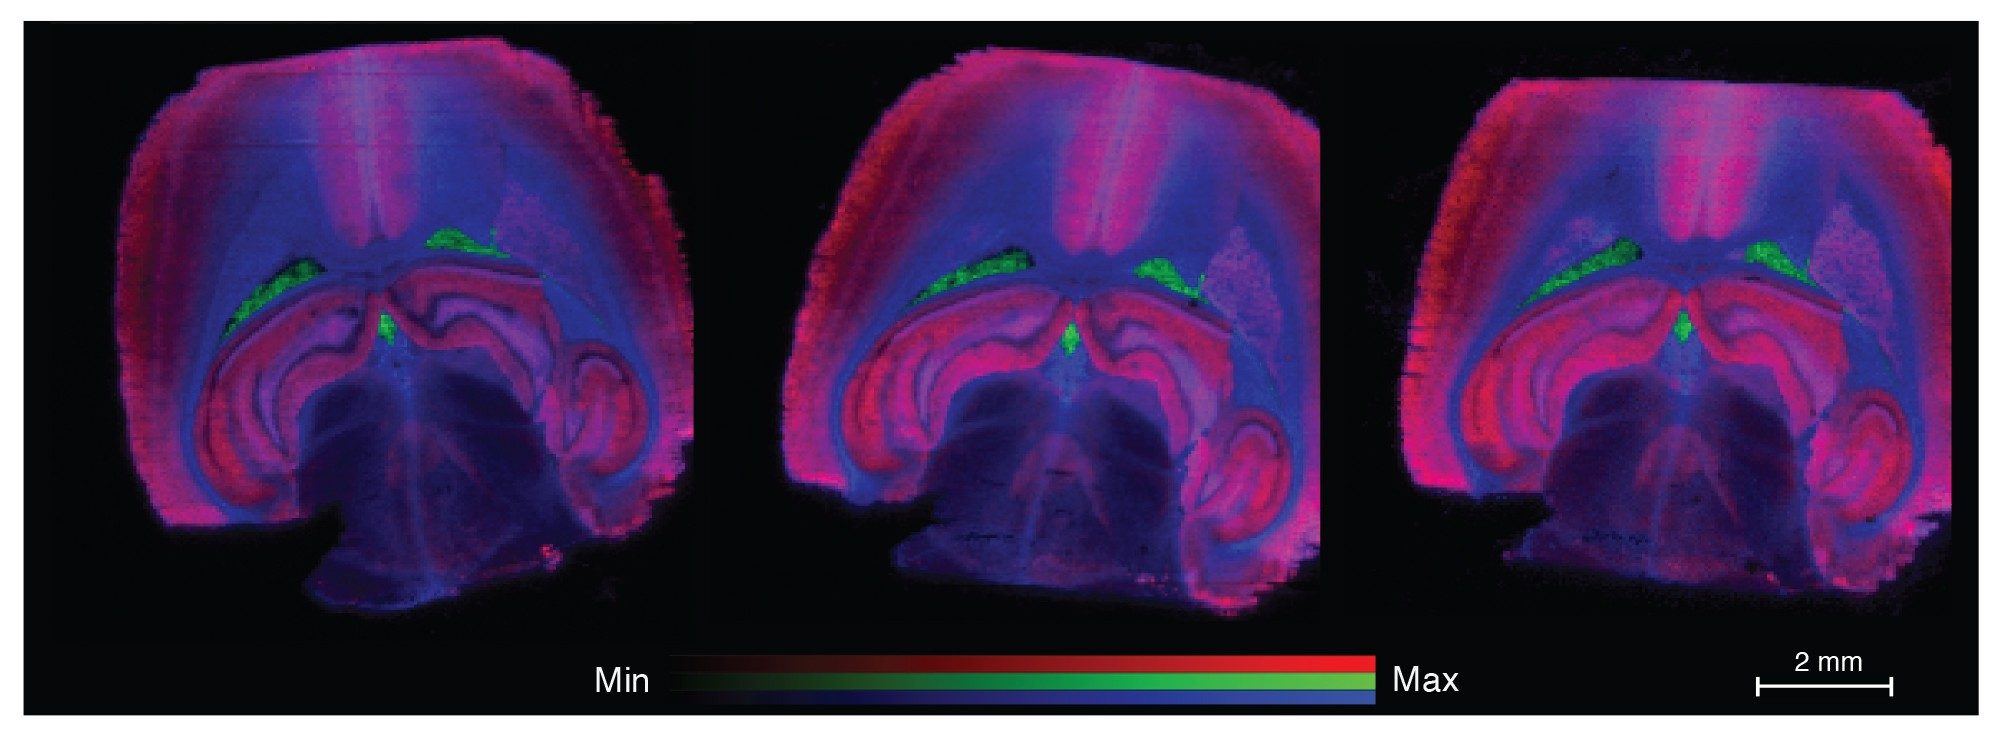
The three differently localizing lipids were putatively identified as PS(40:6) red, PS(38:4) green, and PE(p38:4) blue region colours. When this is applied as an RGB overlay image for each of the three scan speeds the images appear very similar (Figure 4).
The average mass error for each acquisition was:
- Five scans per second is -1.35 ppm,
- 10 scans per second is 1.19 ppm,
- 20 scans per second is 0.99 ppm.
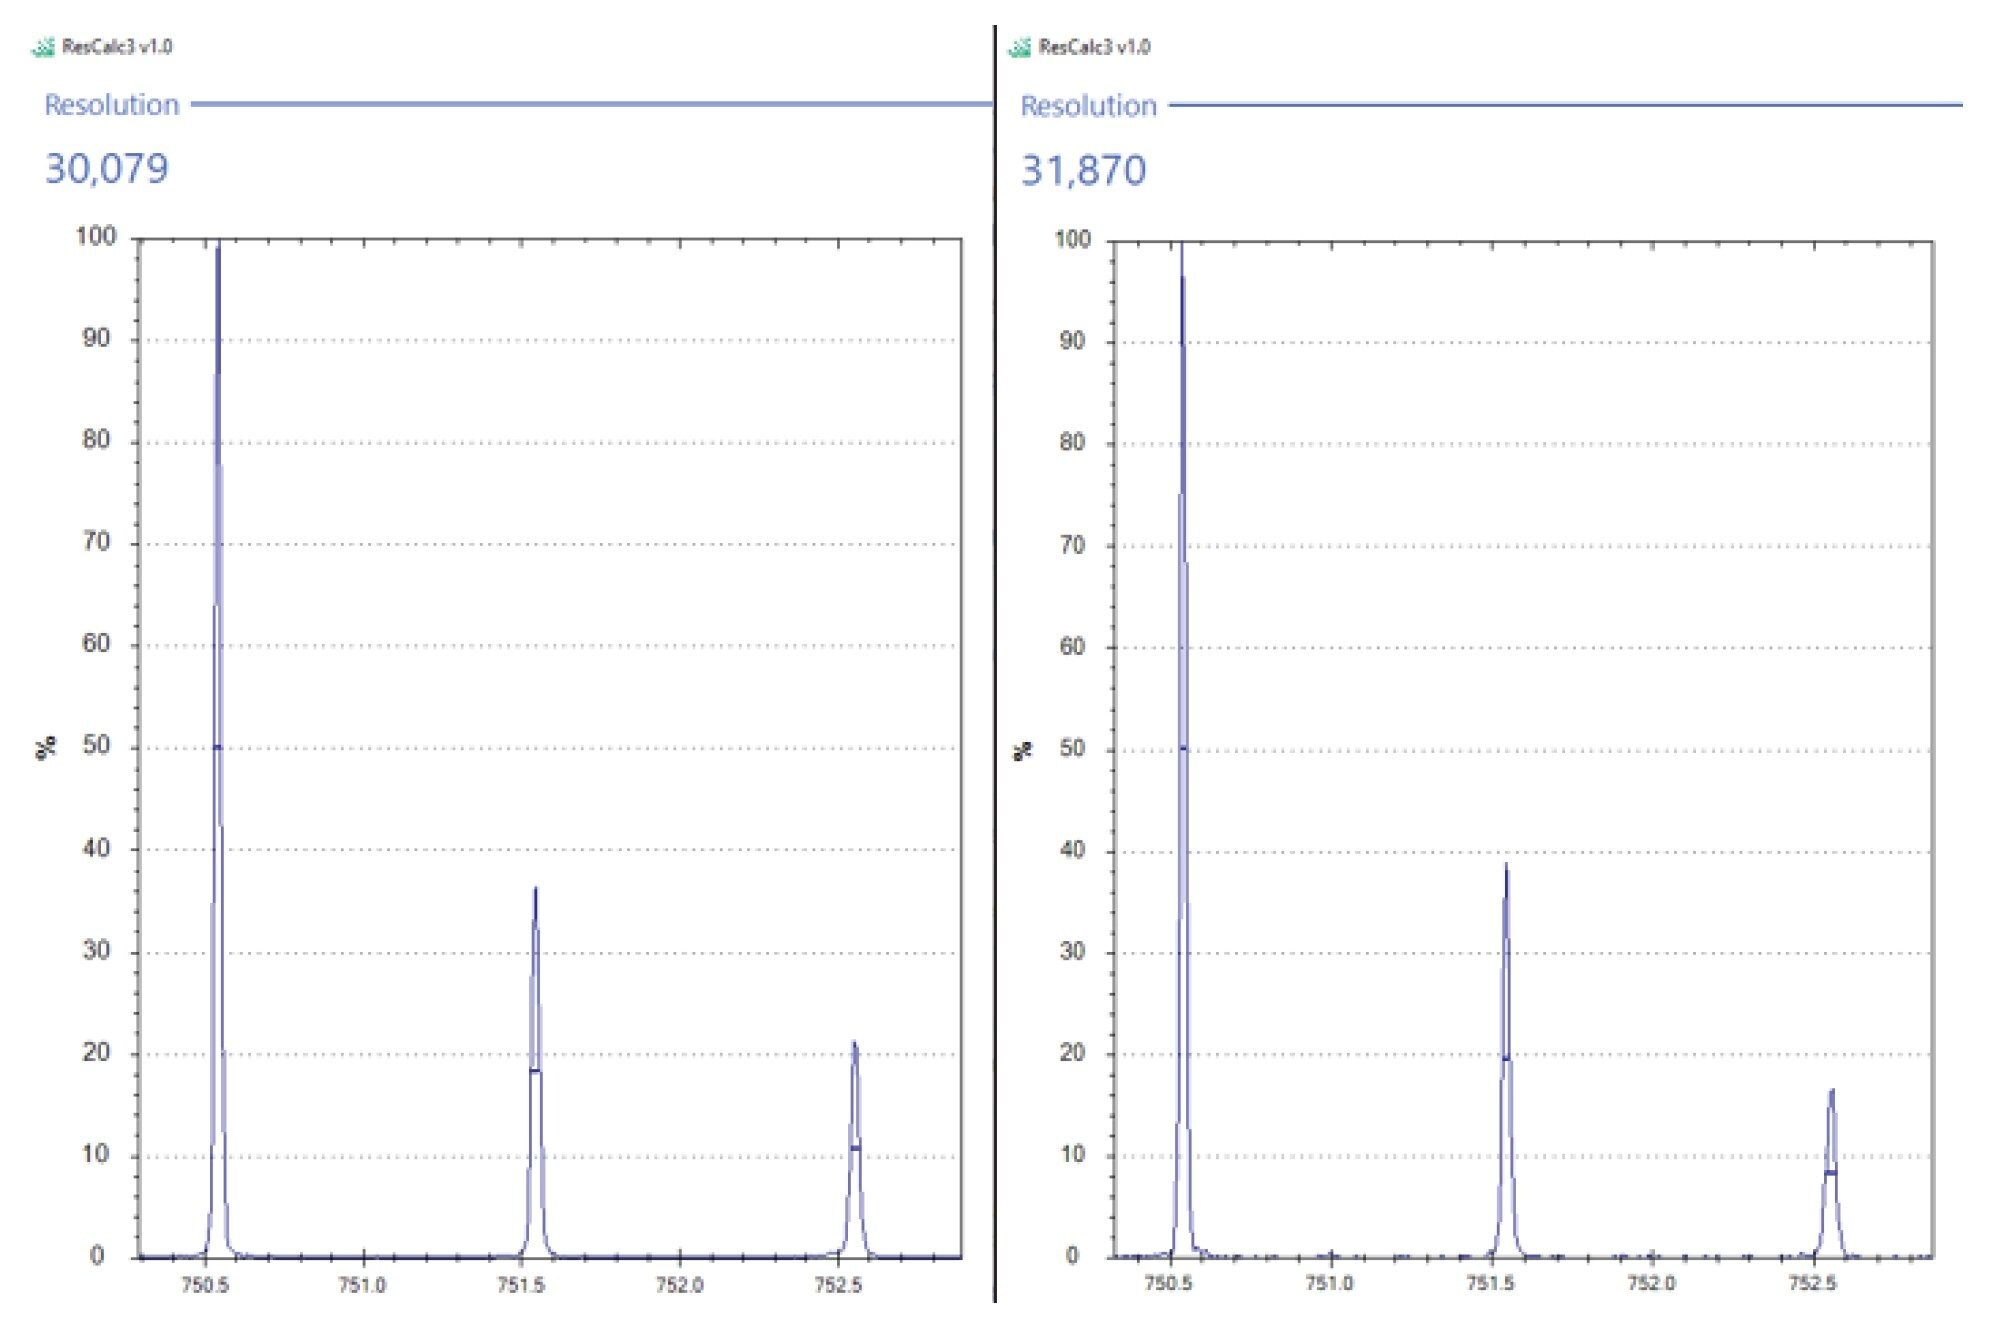
We can also demonstrate that with increased acquisition speed there was no noticeable effect on the mass resolution. Figure 5 shows an isotope cluster of a lipid with an m/z of 750.5, putatively identified as PE(p38:4). When the mass resolution is calculated for the isotope cluster from the 5 scans per second acquisition speed and the 20 scans per second acquisition speed it can be seen that there is no significant difference in the mass resolution of the instrument.
Conclusion
We have shown that increasing acquisition speed and reducing acquisition time does not appear to negatively impact on data or image quality.
Due to Xevo G3 QTof instrument sensitivity, imaging speed can be increased whilst retaining excellent data quality for routine MS imaging applications.
We have demonstrated that despite a proportional reduction in signal intensity with increased acquisition speed, the resulting spectral profiles are still highly correlated.
In addition, with increased acquisition speed there was no significant effect on the mass resolution or mass accuracy of the resulting data.
References
720008482, August 2024