A Rapid UPLC™-MS/MS Method for the Quantification of PROTACs-3-Gefitinib and Urinary Metabolites Following Subcutaneous Administration to Male Rats
Abstract
Proteolysis Targeting Chimera (PROTAC) drugs are now well established in pharmaceutical development programs, with over 20 under clinical investigation as of the end 2023. PROTACs drugs work by mobilizing the ubiquitin–proteasome system to achieve proteasome-mediated degradation of the target protein. As such they offer a significant advantage over traditional small molecules, which inhibit protein activity, e.g., complete removal of protein, reduced susceptibility to drug resistance and ability to target previously undruggable proteins. A critical part of the drug discovery development process is understanding and quantifying the in vivo fate of the molecule. As PROTACs drug molecules are essentially two active moieties, one which binds to the target protein and one which binds E3 ubiquitin ligase, connected by a linker, they are susceptible to metabolic cleavage of the linker giving rise to two active moieties which need to be detected and quantified in a DMPK study. A rapid UPLC-MS/MS method was developed and employed for the measurement of PROTACs-3-gefitinib and its major urinary metabolites following subcutaneous administration at 10 mg/kg to male rats.
Benefits
- Xevo™ TQ Absolute is a high-sensitivity MS platform with wide dynamic range for high confidence, efficient analysis, allowing for the quantification of low and high concentration analytes in one analytical batch without the need for sample dilution or reanalysis
- UPLC Premier delivers rapid separation and quantification of PROTACs molecule and metabolites in urine
- Reduction in non-specific binding of target analytes to transition metals in LC system, eliminating the potential for analyte loss, poor chromatographic peak shape, and irreproducible results
- High sensitivity analysis of small sample volumes to support 3Rs (replacement, reduction, refinement) approach by facilitating serial micro sampling
Introduction
Proteolysis targeting chimera (PROTAC) are a relatively new class of drug molecules, first being described by Kenten et-al in 1999.1 Unlike traditional small molecules, which operate by only inhibiting the enzyme function of the target protein, PROTACs produce total degradation of the entire protein, thus removing both the enzyme and non-enzyme functions. PROTACs are synthetic chemicals (small molecules) comprised of two protein binding compounds, one capable of engaging with E3 ubiquitin ligase and the other with the target protein of interest. These two molecules are covalently connected by a linker which can vary in length and chemical composition.
As part of the drug discovery and development process, it is necessary to understand the metabolism and pharmacokinetics of the compound(s) under evaluation to determine drug exposure, identify potential toxic/pharmacologically active metabolites and understand the route of elimination. Previous in vitro studies have highlighted the PROTACs linkers as being susceptible to N-dealkylation and amide hydrolysis at the points of attachment, resulting in the cleavage of the PROTACs molecule into two fragments.2 Indeed, PEG based linkers were susceptible to CYP3A4 O-dealkylation offering the potential for multiple fragmentation points. These biotransformations have the potential to exhibit “on” and “off” target pharmacology or toxicity, and thus may need to be monitored and quantified, along with the dosed PROTACs, as part of any DMPK studies. As these metabolites may be present at low concentrations and have closely related structures, it is critical to have a high resolution, high sensitivity bioanalytical assay capable of separating and quantifying these metabolic products as well as the dosed compound.
Here we present a rapid, sensitive UPLC-MS/MS method using the ACQUITY™ Premier UPLC™ System and the Xevo TQ Absolute Tandem Quadrupole Mass Spectrometer operating in positive ion ESI multiple reaction monitoring (MRM) mode for the detection and quantification of PROTAC-3-gefitinib and its metabolites in male rat urine following the subcutaneous administration to the male rat.
Experimental
Sample Description
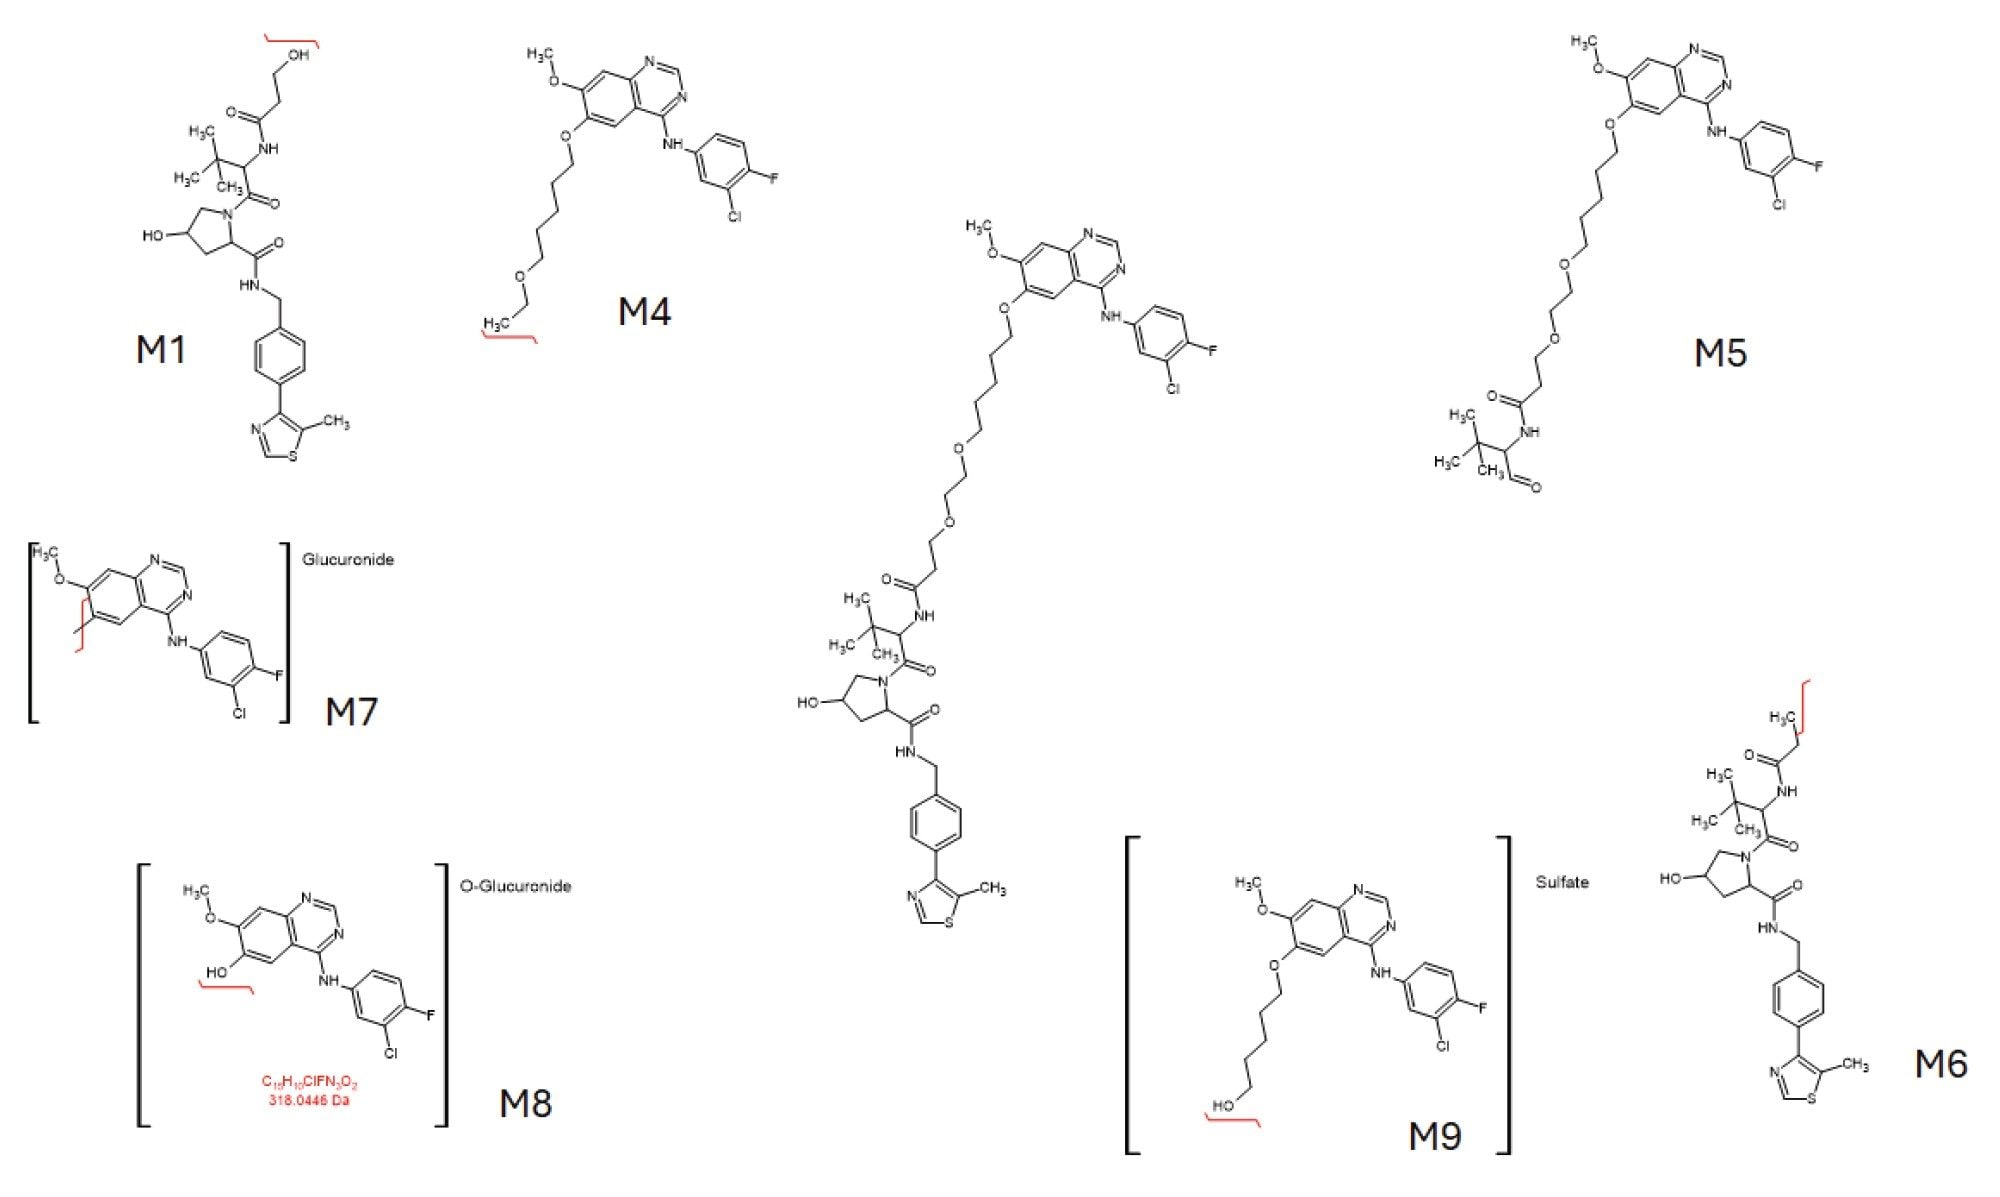
PROTAC-3-gefitinib, Figure 1, was dosed subcutaneously at 10 mg/kg to four male rats. The dose was formulated in 5% DMSO, 40% PEG 400, 5% Cremophor, and 50% saline for injection (SFI). The rats were housed individually in a metabowl and had free access to food and water. Urine samples were collected over ice for the following time periods, 0–1 hour (n=4), 1–3 hour (n=1), 1–8 hour (n=2), 8–24 hour (n=1) following dosing. The urine samples were transferred to falcon tubes (10 mL) and stored frozen at -20 °C prior to analysis.
The study was performed under UK Home Office License PP9552589 Protocol 2-Pharmacokinetic Study, with local ethical committee clearance.
A calibration line was prepared over the range 1–1000 ng/mL by spiking PROTAC-3-gefitinib authentic standard solutions into control blank rat urine. Quality control (QC) standards were also prepared in the same manner at concentrations of 3, 75, and 800 ng/mL. Standard, QC and study samples were prepared by mixing 5 µL aliquot of urine with 20 µL cold acetonitrile: methanol (4:1) containing gefitinib D6 as an internal standard at a concentration of 50 ng/mL in 1.5 mL plastic Eppendorf tubes. The samples were vortex mixed and refrigerated at -20 °C for 1 hour. The samples were then allowed to return to room temperature and centrifuged at 14,000 g for 5 minutes. The supernatant layer was transferred to an autosampler vial for analysis.
Method Conditions
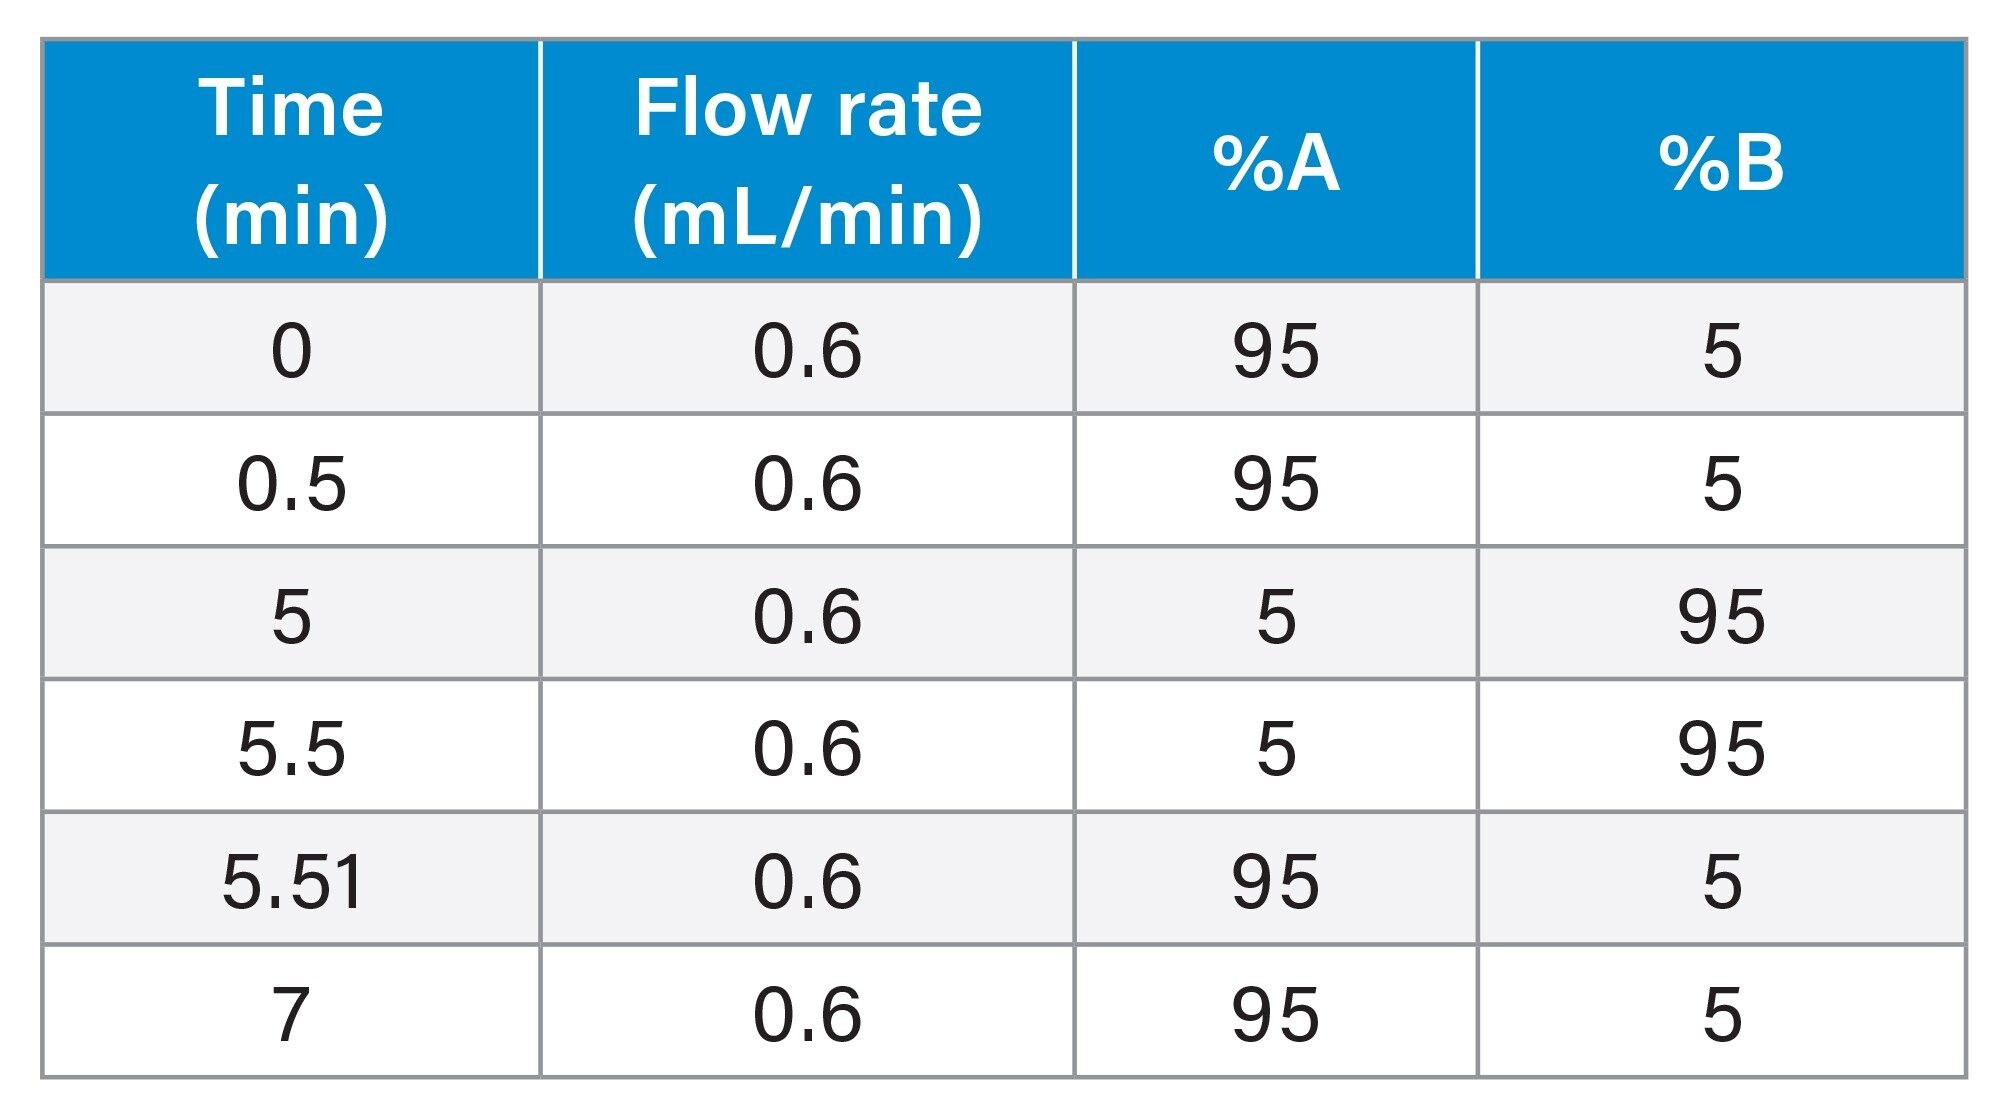
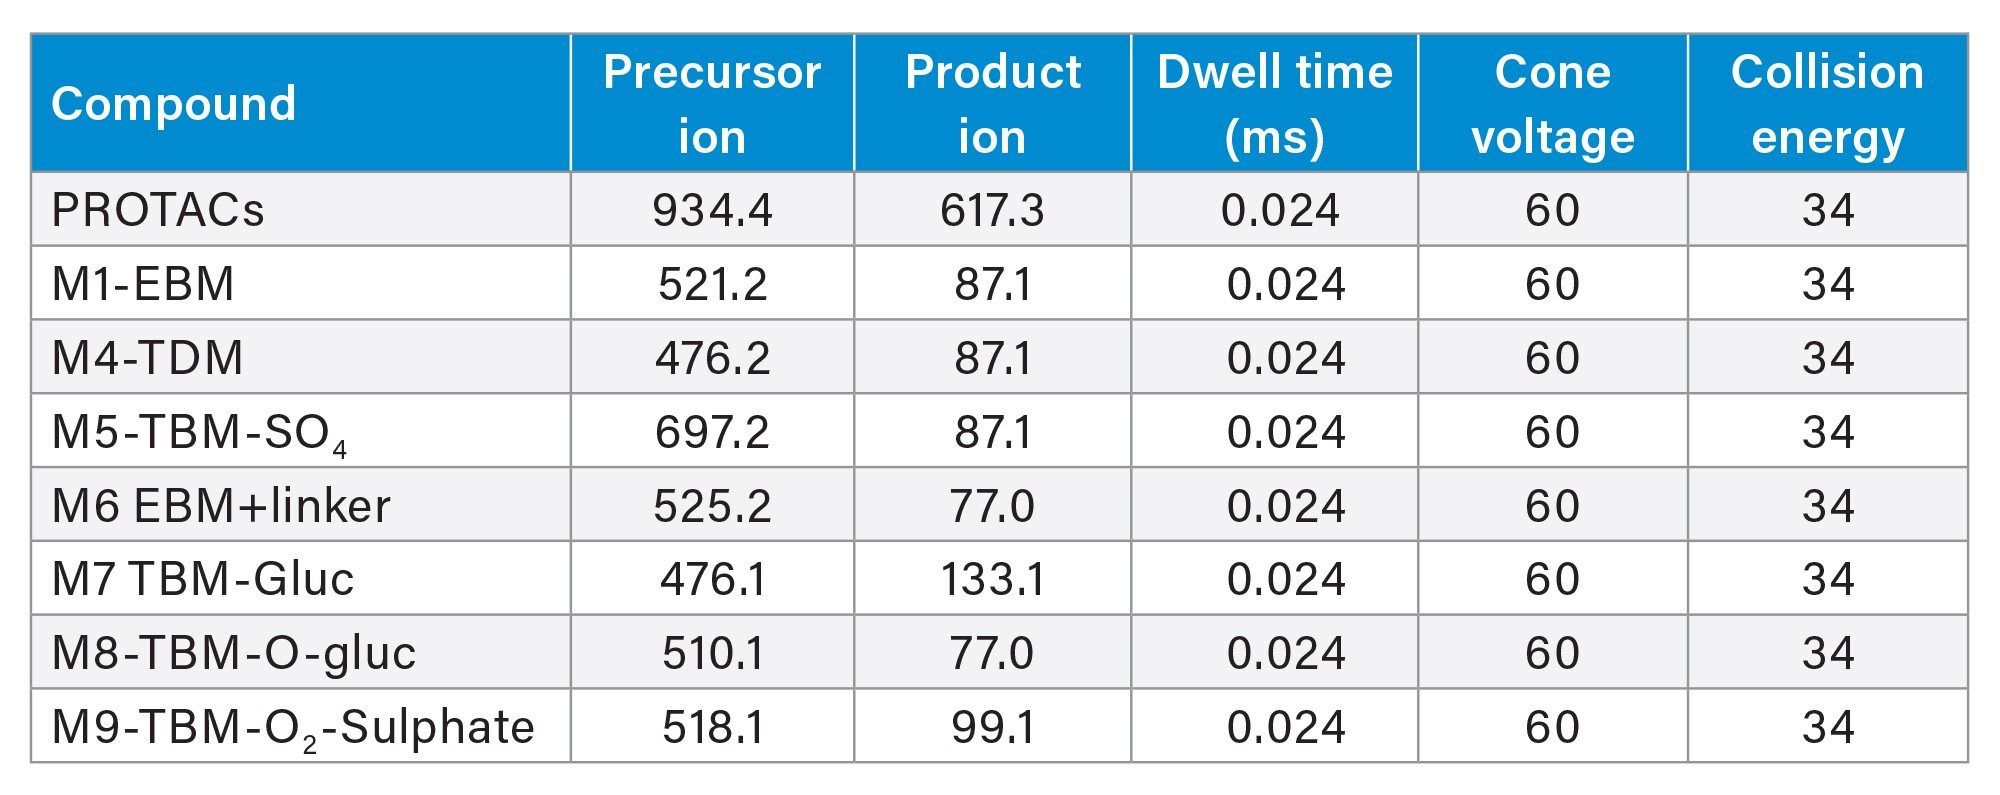
The urine extracts (1 µL) were analysed using an ACQUITY Premier UPLC System, comprising a binary solvent manager, sample manager and column manager connected to a Xevo TQ Absolute Tandem Quadrupole Mass Spectrometer. Chromatographic separations were performed using a 2.1 x 100 mm ACQUITY Premier HSS T3 1.8 µm Column maintained at 60 °C at a flow rate of 0.6 mL/min. The data was collected using MRM mode using the transitions, cone voltages and collision energies given below. Quantification was performed using gefitinib d6 stable labelled isotope as the internal standard, and 1/X weighting.
LC Conditions
|
LC system: |
ACQUITY Premier UPLC |
|
Vials: |
LCGC Certified Clear Glass 12 x 32 mm Screw Neck Vial, Total Recovery (p/n: 186000384C) |
|
Column(s): |
ACQUITY UPLC HSS T3 Column, 100 Å, 1.8 µm, 2.1 mm x 100 mm (p/n: 186003539) |
|
Column temperature: |
60 °C |
|
Sample temperature: |
20 °C |
|
Injection volume: |
1 µL |
|
Flow rate: |
0.6 mL |
|
Mobile phase A: |
Aqueous 0.1% formic acid, 1 mM ammonium formate |
|
Mobile phase B: |
95% acetonitrile 5% water, 0.1% formic acid, 1 mM ammonium formate |
Gradient Table
MS Conditions
|
MS system: |
Xevo TQ Absolute |
|
Ionization mode: |
Positive ion ElectroSpray Ionization (ESI) |
|
Capillary voltage: |
1 kV |
|
Collision energy: |
34 eV |
|
Cone voltage: |
60 V |
Data Management
|
Acquisition software: |
MassLynx™ 4.2 Software |
|
Processing software: |
TargetLynx™ XS Software |
PROTAC-3-Gefitinib and Metabolite MRM Transitions
Results and Discussion
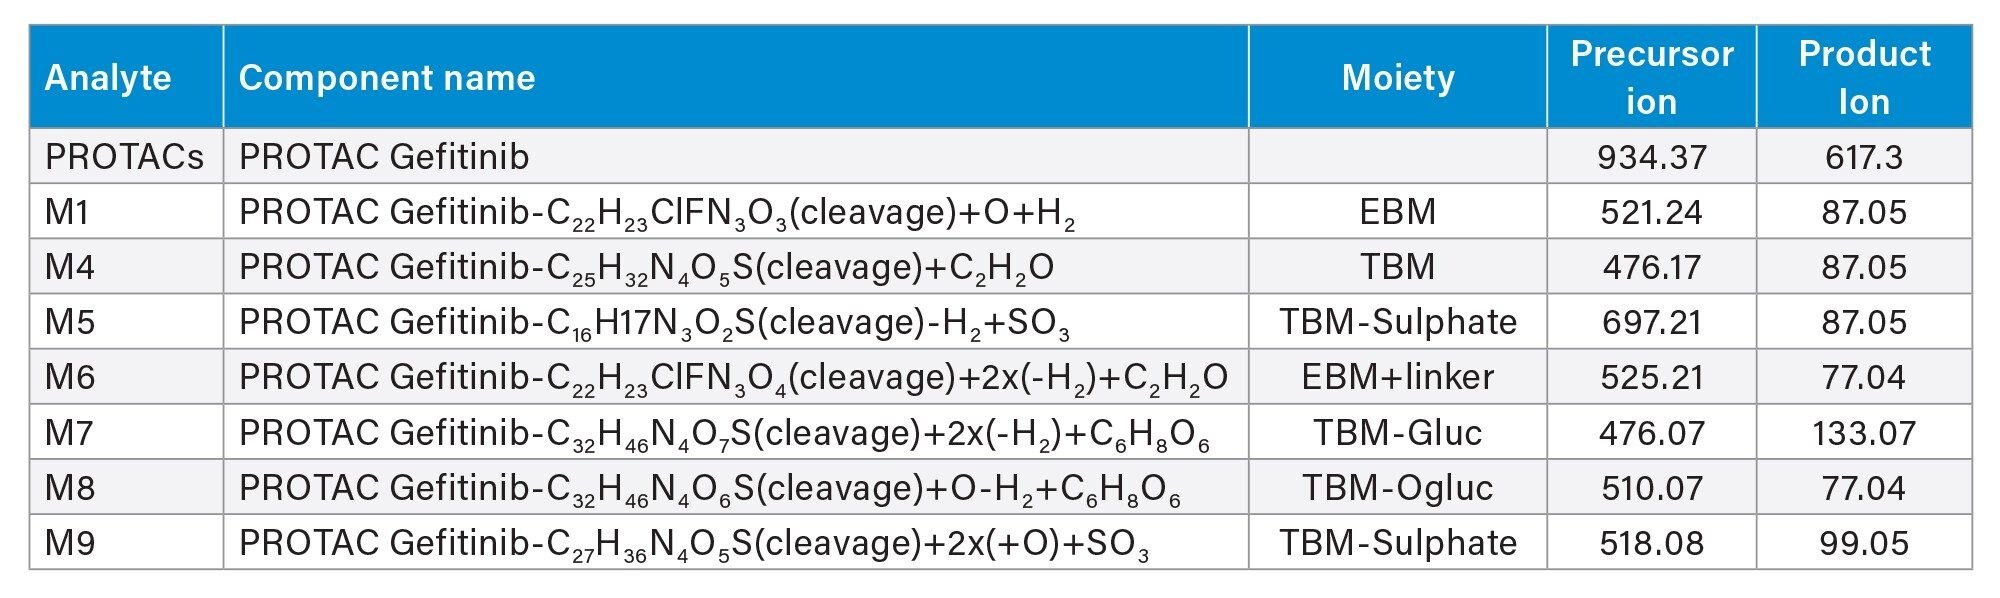
PROTAC-3-gefitinib is a PROTAC version of gefitinib, a potent tyrosine kinase inhibitor which interrupts signalling via the epidermal growth factor receptor (EGFR) in target cells and is used to treat cancer e.g. non-small cell lung cancer and breast cancers. Previous studies have shown that gefitinib is well absorbed with a good bioavailability, but it is subject to extensive biotransformation in both preclinical species and humans to a large number of metabolites.3,4 These include O-demethylation, oxidative metabolism of the morpholine ring, and oxidative defluorination, mainly mediated via the cytochrome p450 family of enzymes.5 Some of these biotransformations can be further metabolized to form sulphate and glucuronide conjugates. Metabolite profiling of the urine and plasma samples obtained from dosing of PROTAC-3-gefitinib to male rats, using reversed–phase chromatography and high-resolution mass spectrometry, identified seven potentially drug related metabolites, see Table 1. These metabolites were characterized by N-dealkylation and/or hydrolysis of the aliphatic linker to yield the E3 ligase binding moiety (EBM) and the gefitinib based target binding moiety (TBM), the latter also being subject to further metabolism via conjugation to form sulphate or glucuronide metabolites. Examples of these metabolites are given in Figure 1.
PROTAC-3-Gefitinib Quantification
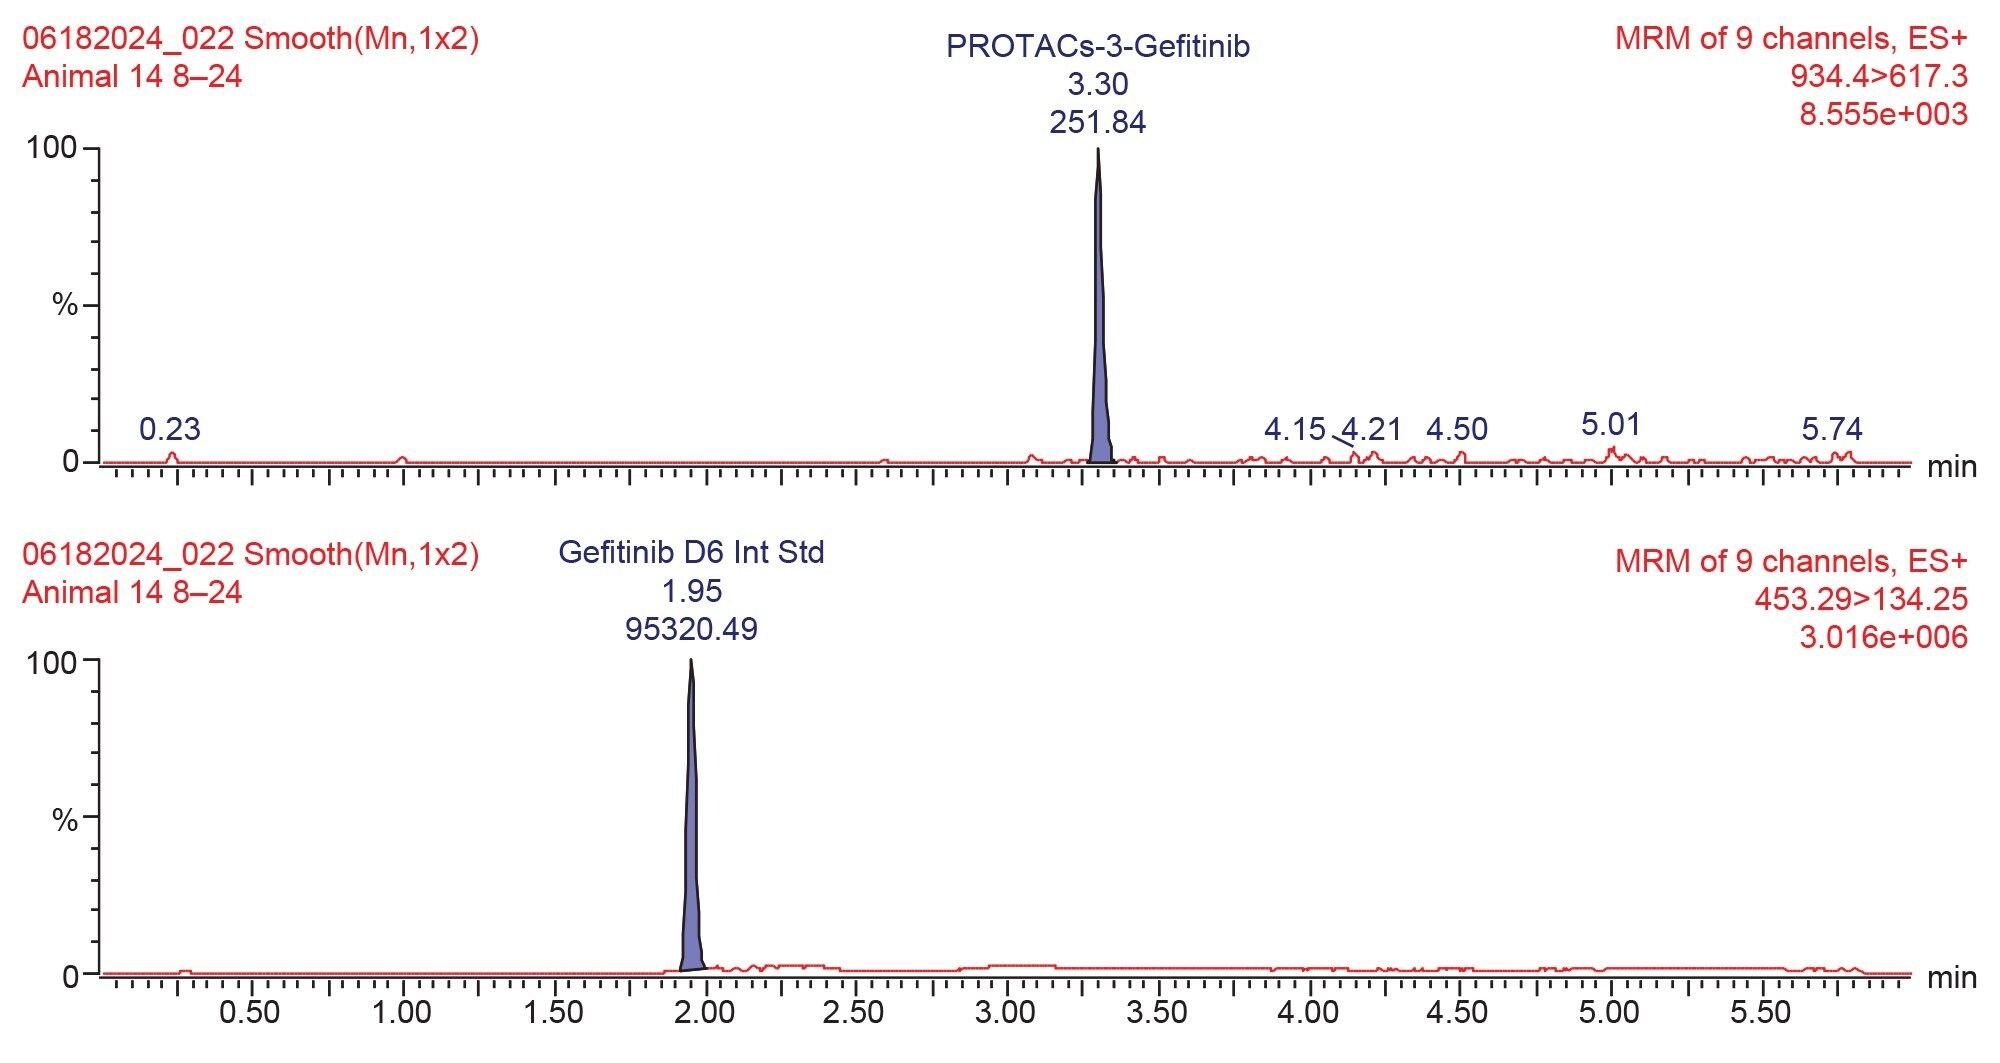
The urine samples were prepared by protein precipitation with acetonitrile : methanol solution (containing gefitinib stable labelled isotope (d6) (50 ng/mL) as internal standard) via vortex mixing and refrigerated at -20 °C, followed by centrifugation to yield a supernatant layer for analysis. The concentration of PROTAC-3-gefitinib and its major metabolites were monitored using reversed–phase UPLC–MS/MS operating in +ESI MRM mode, (see method section). The MRM transitions were identified, and the cone voltages and collision energies optimized by infusion of a 100 ng/mL authentic standard using the Intellistart function within MassLynx (Waters application note, 720008229).6 PROTAC-3-gefitinib eluted with retention time tR=3.29 min, an example chromatogram for PROTAC-3-gefitinib obtained from the 8–24 hour urine sample is shown in Figure 2.
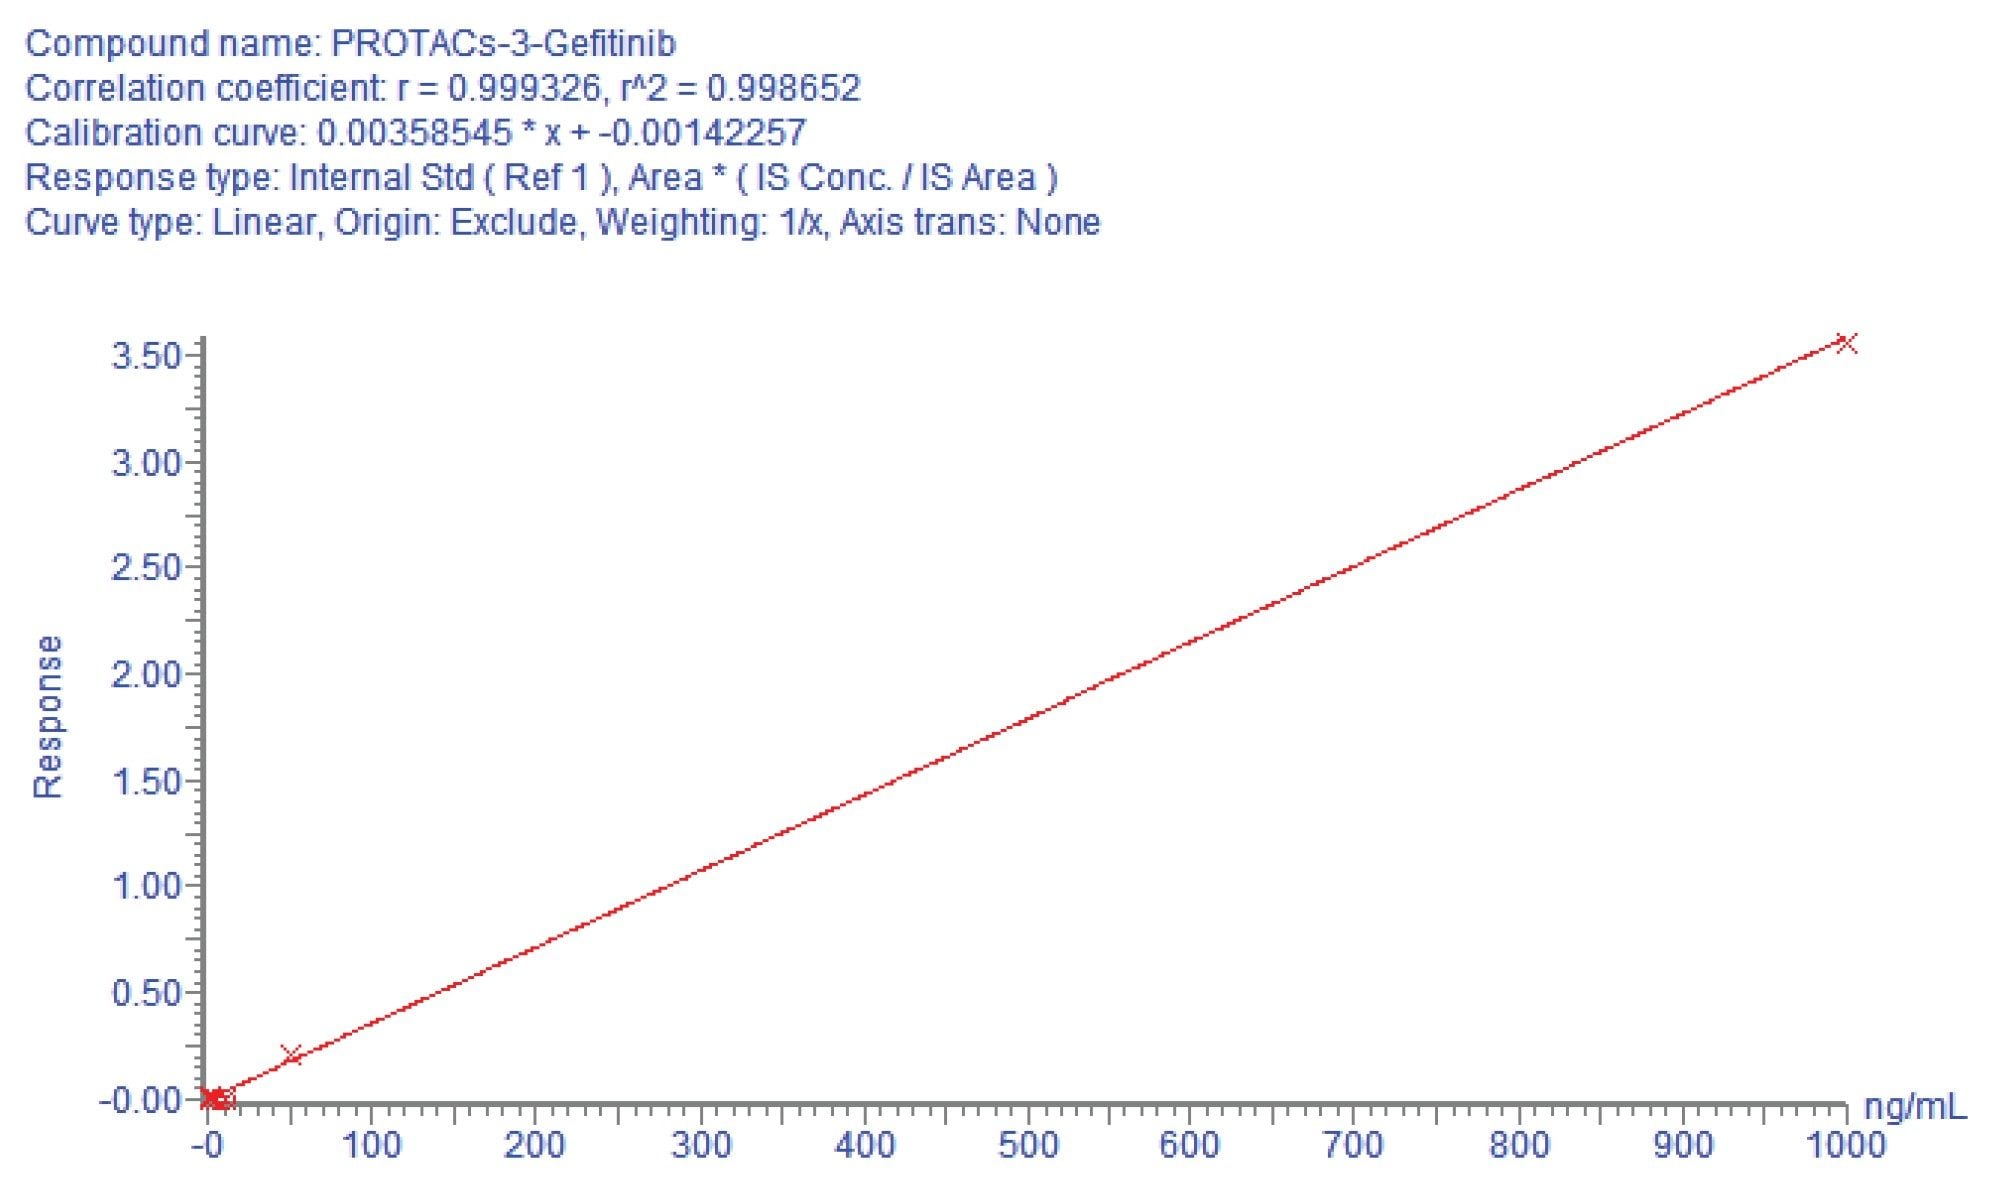
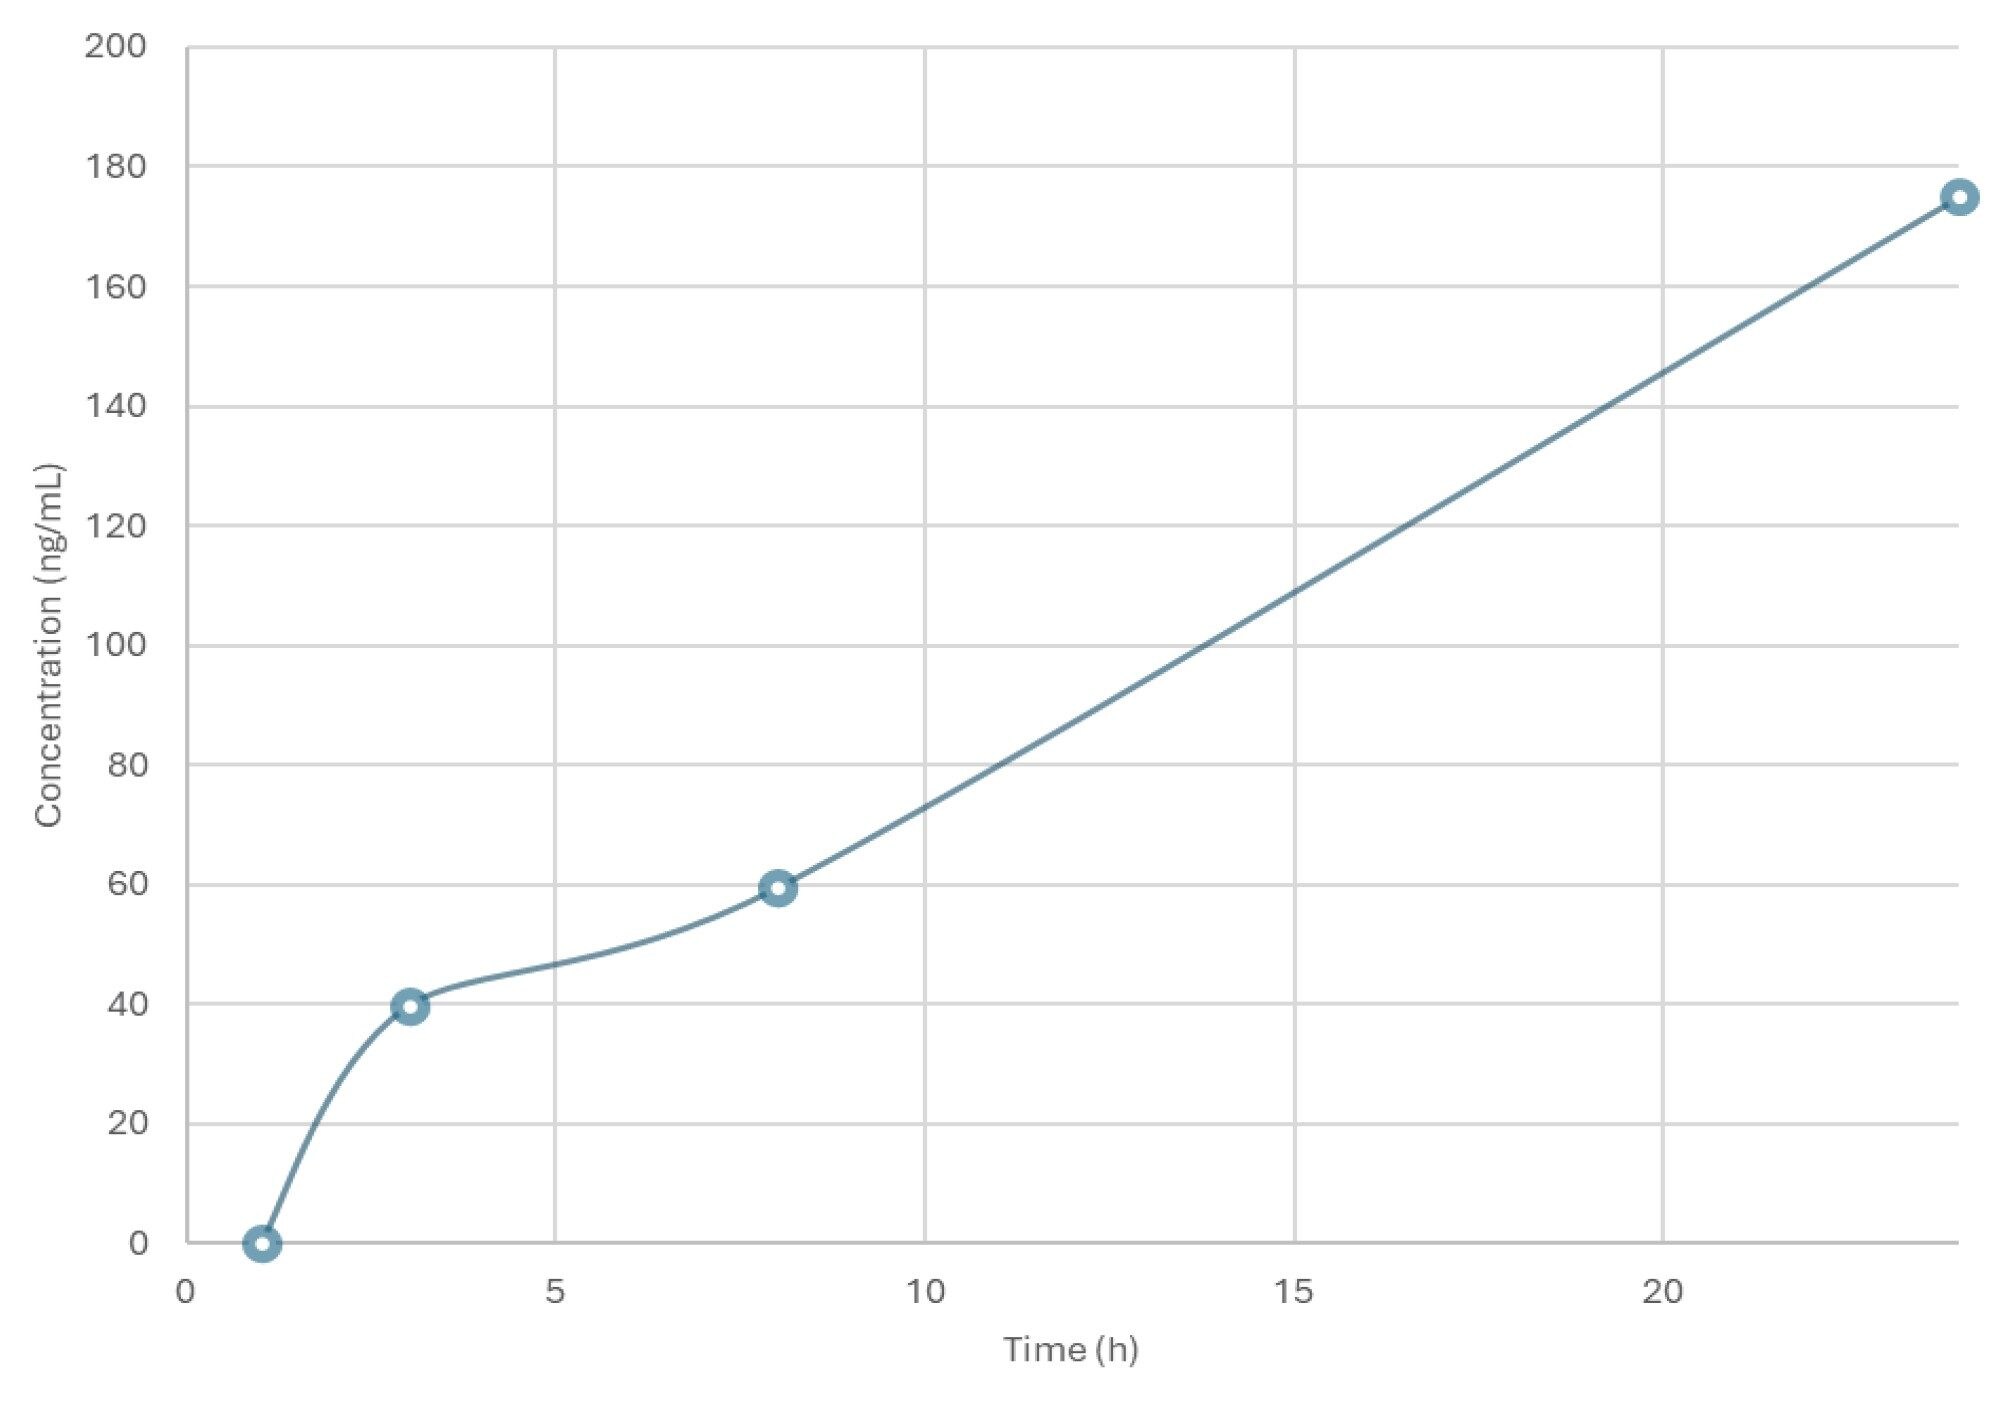
A calibration line was constructed in urine over the concentration range 1–1000 ng/mL using a 1/x weighting and QC samples were employed at concentrations of 3, 75, and 800 ng/mL to confirm assay performance. A typical calibration line obtained from the urine analysis is shown in Figure 3. The response for the PROTACs-3-gefitinib was linear over the range of 1–1000 ng/mL with a correlation coefficient (r2) of 0.9987 and an intercept of -0.0014. The derived calibration line was used to determine the concentration of PROTACs-3-gefitinib in the rat urine samples. The resulting mean concentration data (n=4) for PROTACs-3-gefitinib showed that the elimination of the drug compound steadily increased over the period of the study and that the drug was not fully eliminated from the circulatory system by the 24 hour time point, Figure 4.
Metabolite Quantification
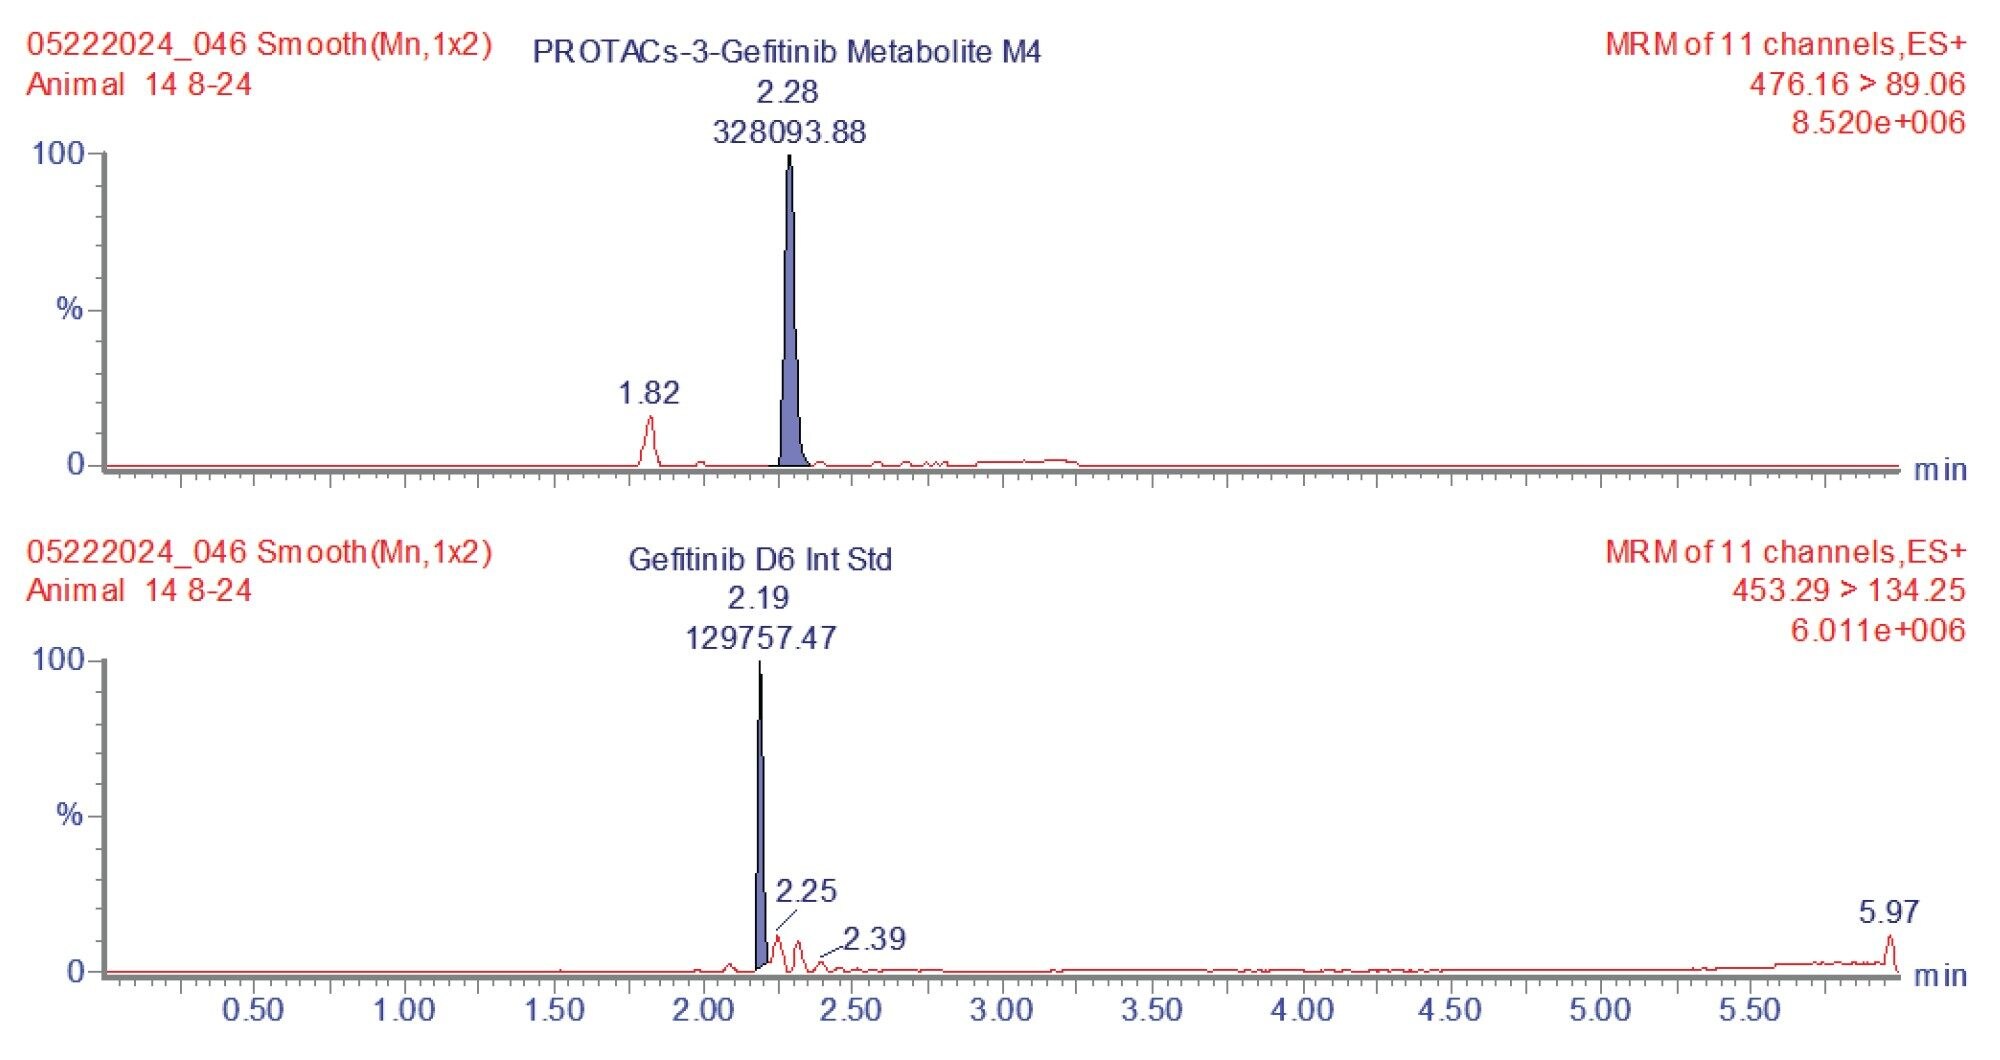
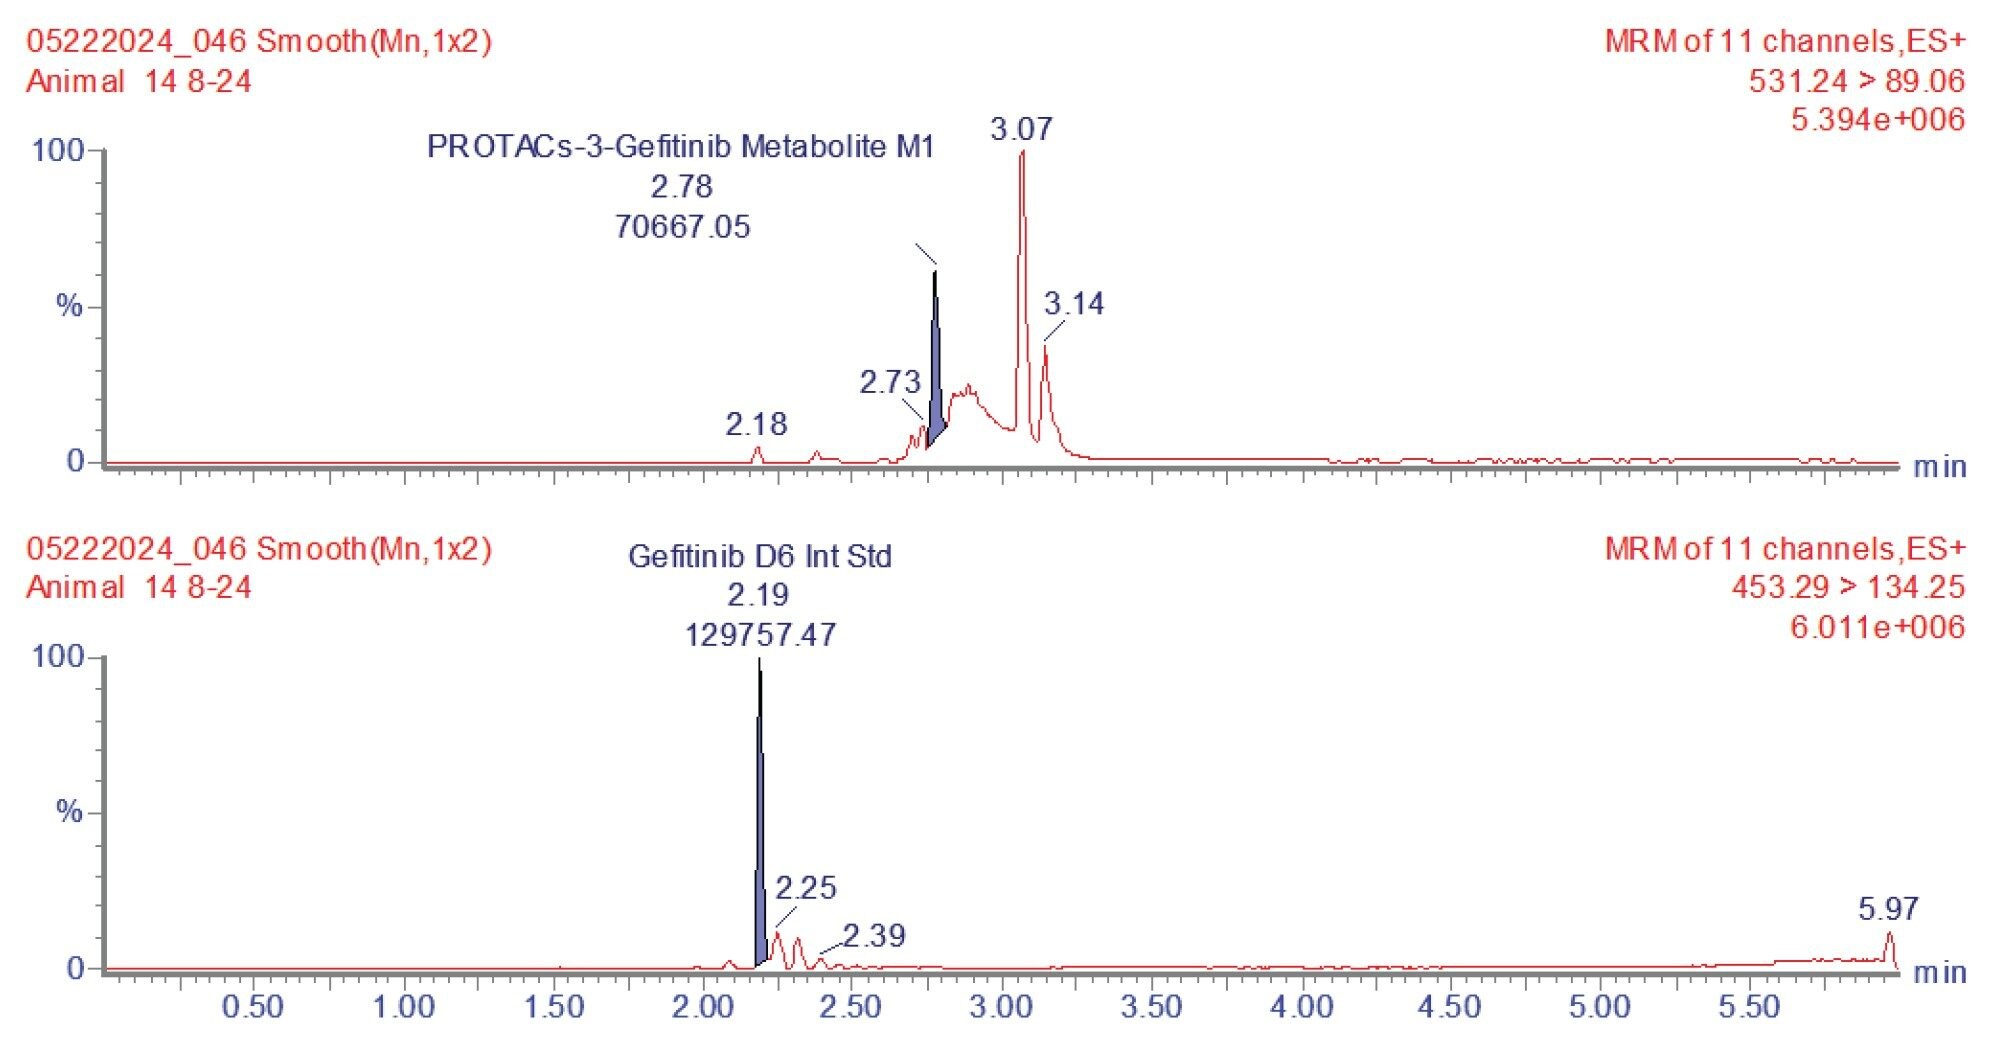
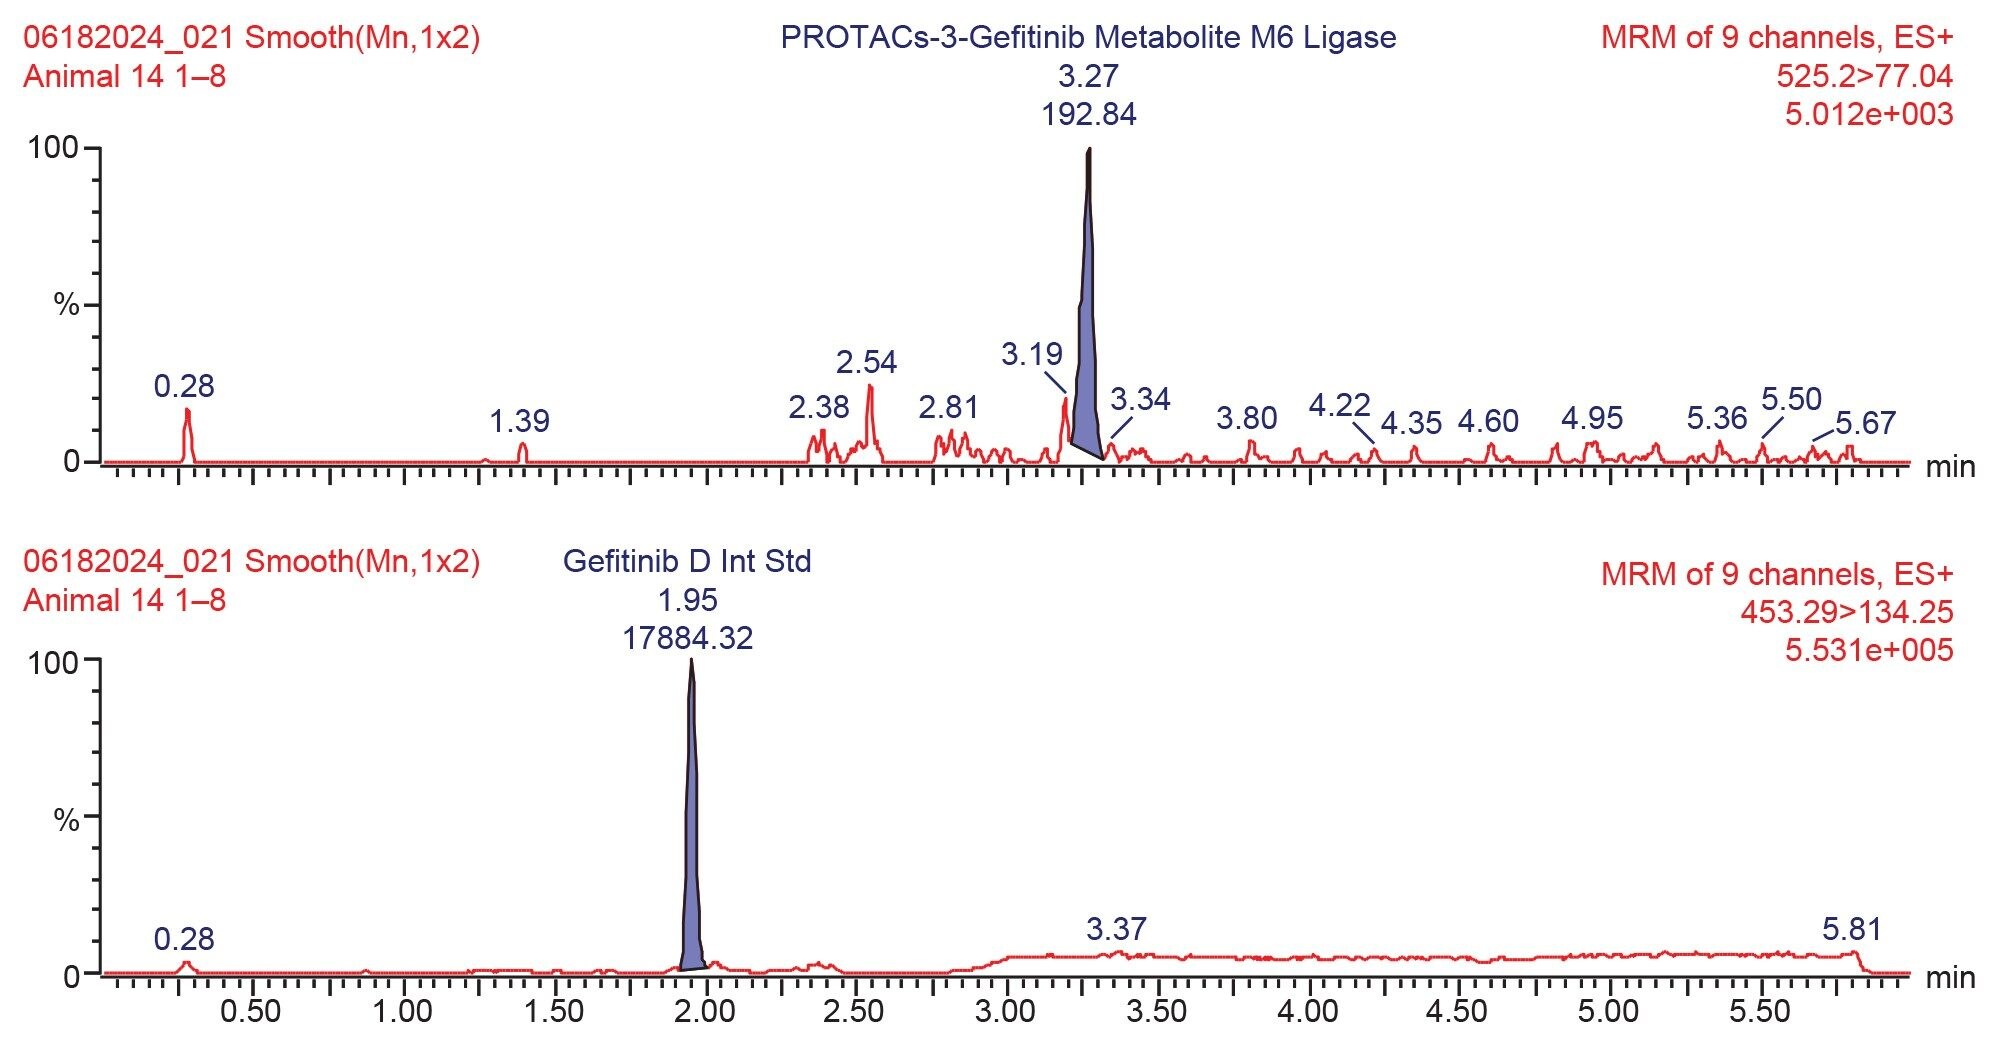
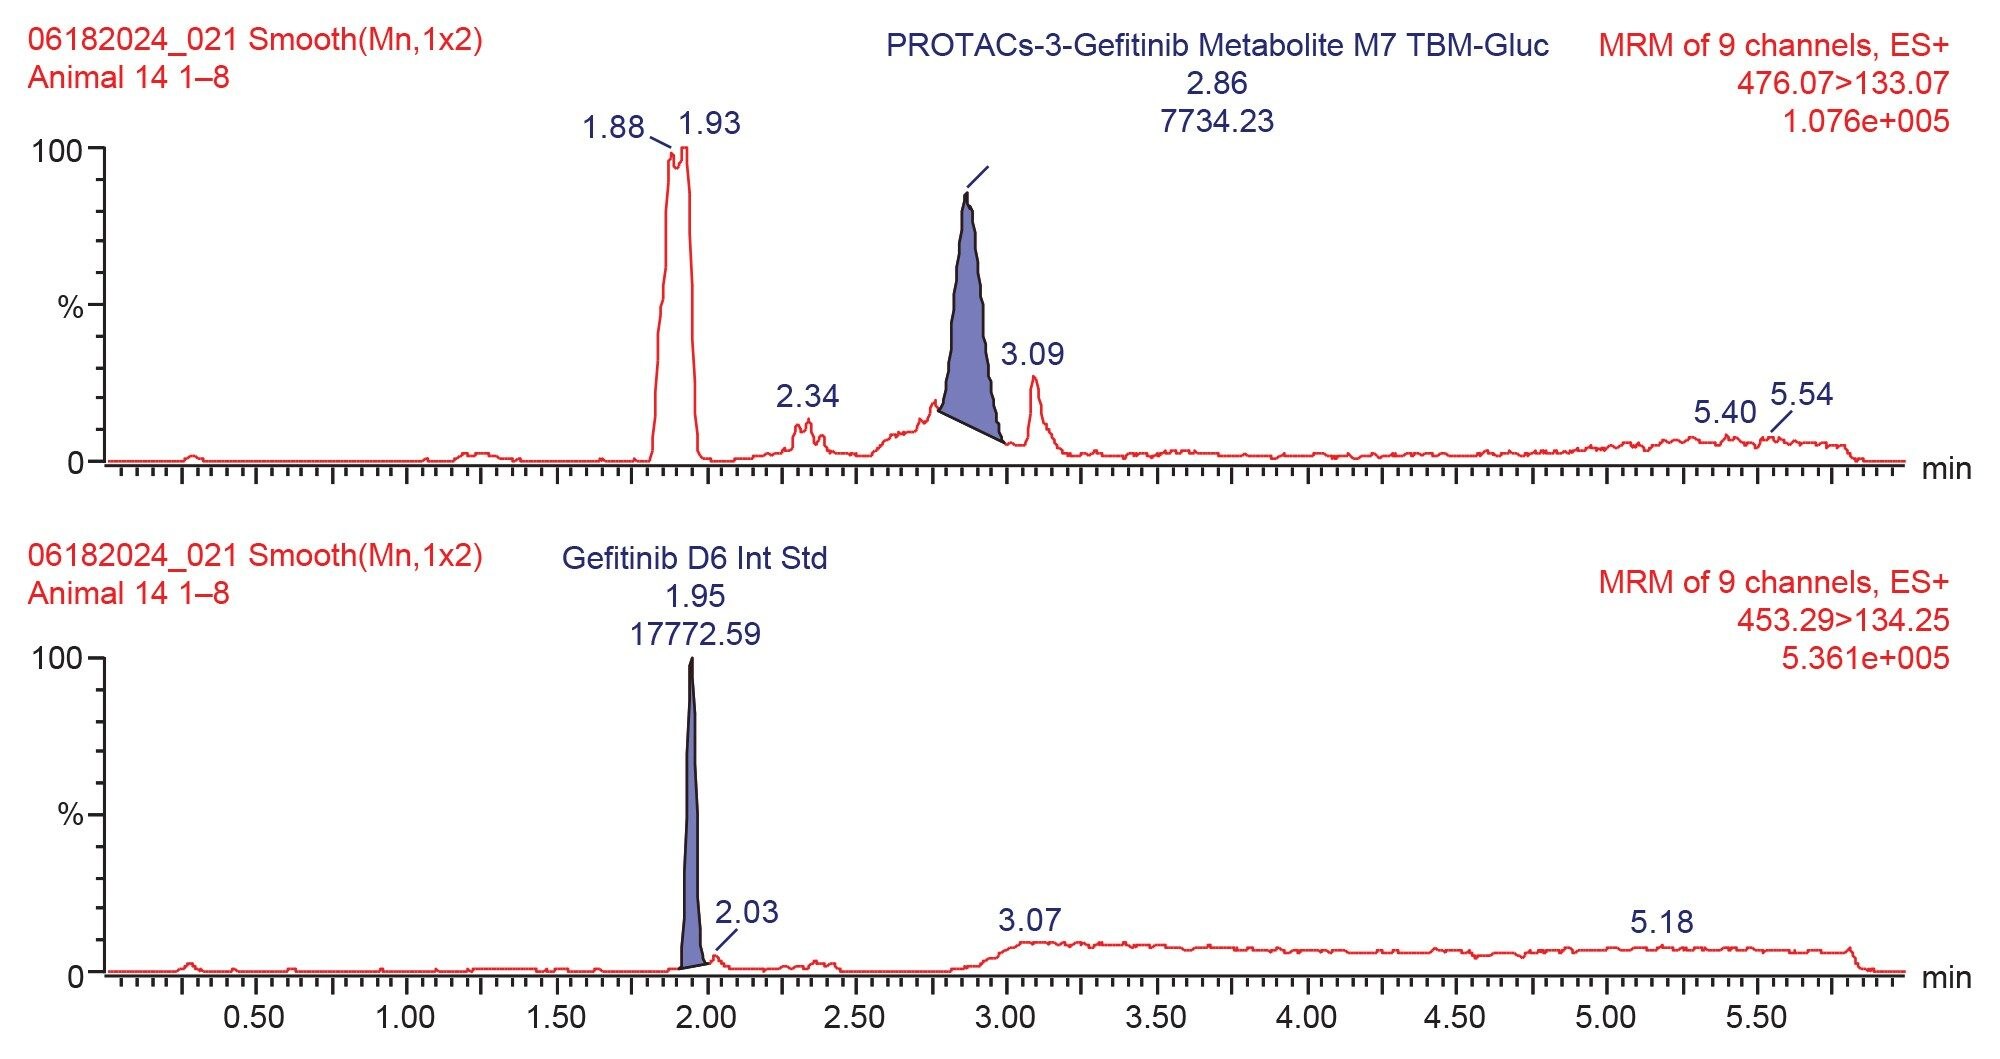
Prior analysis of these samples using reversed-phase UPLC-HRMS showed that PROTACs-3-gefitinib was metabolized via amide hydrolysis, dealkylation of the linker chain, oxygenation of both the therapeutic binding moiety (TBM) and the E3 ligase Binging Moiety (EBM) followed by sulphate and glucuronide conjugation. A total of six major metabolites were monitored by targeted UPLC-MS/MS, in the absence of authentic standards for these metabolites the collision energy and cone voltage of PROTAC-3-gefitinib was used for the metabolites. The drug related metabolites eluted between tR=1.94 and 3.27 minutes, specifically M1 tR=2.74, M4 tR=1.94, M6 tR=3.27, M7 tR=2.86, M8 tR=2.40, and M9 tR=2.41. Example extracted positive ion chromatograms for the metabolites; cleavage of EBM M4, (476.16 → 89.06); cleavage of the gefitinib TBM and oxygenation of the EBM M1, (531.24 → 89.06); cleavage of gefitinib TBM and linker M6 (525.2 → 77.04) and cleavage of the EBM followed by glucuronidation of the TBM M7, are given in Figures 5–8. The UPLC-MS/MS data for these metabolites showed that the system produced excellent peak shape and good resolution of the drug metabolites from the dosed compound and endogenous urinary components. In the absence of authentic standards, the drug metabolites were quantified against the PROTACs-3-gefitinib calibration line. The high sensitivity and wide dynamic range of the Xevo TQ Absolute Tandem Quadrupole Mass Spectrometer allowed for the quantification of both the low concentration PROTACs-3-gefitinib and the low concentration metabolites (M8, M6) as well as the higher concentration metabolites (M9, M4, M1, and M7) in a single analytical batch.
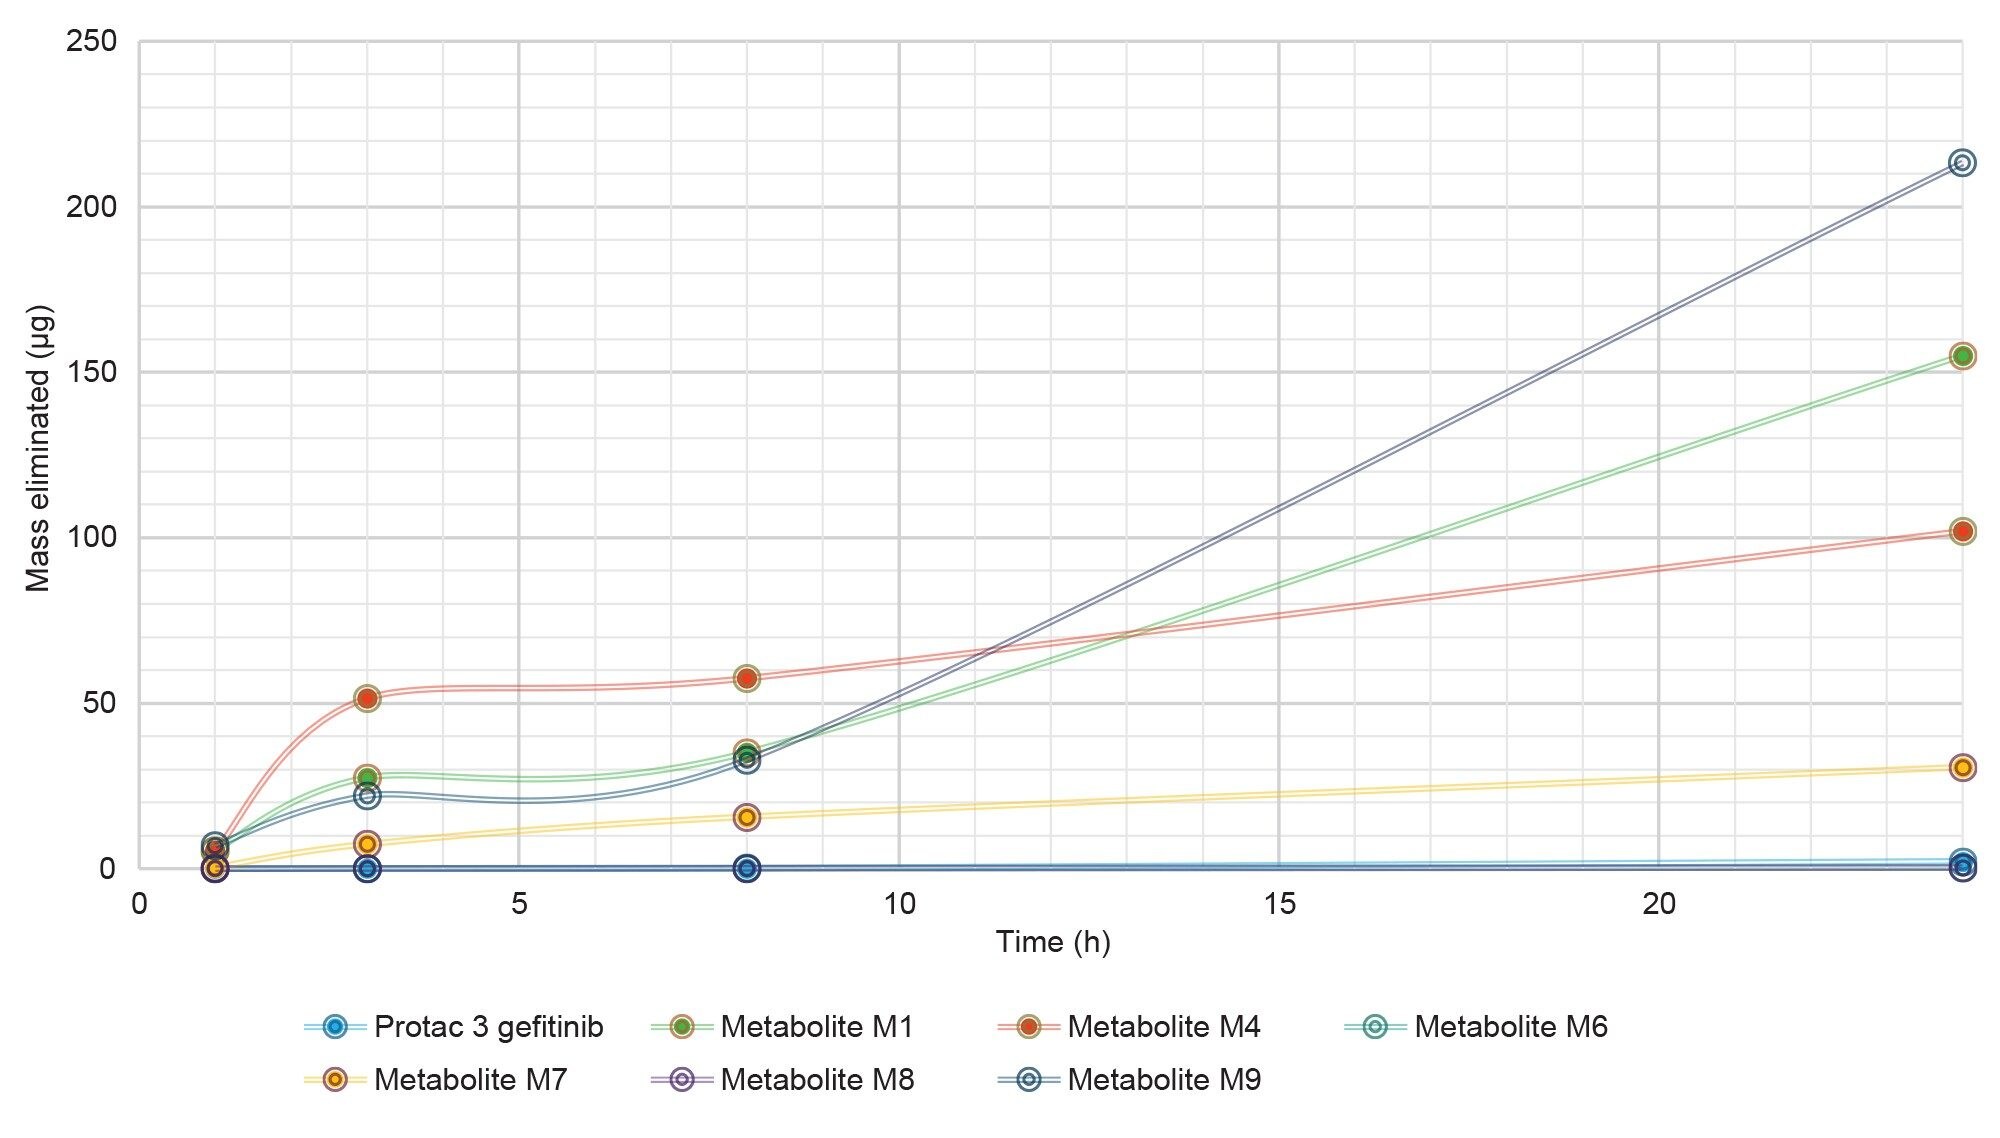
The resulting metabolite mass elimination data (concentration x volume of urine) is summarized in Figure 9. As can be seen from this data the metabolites M9, M4, M1, and M7 were responsible for the largest proportion of the drug related eliminated material on each sampling occasions. The total mass eliminated for the metabolites M9, M4, M1, and M7 over the 24 h sample period was 275.2, 216.5, 223.3, and 54.2 µg, respectively. The metabolites M9, M7 are the sulphate and glucuronide conjugate metabolites of the TBM following dealkylation of the linker, whilst the metabolites M1, M4 are the TBM, and EBM products resulting from the from the cleavage of the PROTACs linker (O-dealkylation). It is interesting to note that the two cleavage metabolites (M1, M4) are likely formed by the same metabolic cleavage reaction. The metabolites M8, M6, and PROTACs-3-gefitinib were present at significantly lower concentrations and contributed much less to the mass of eliminated material over the 24 hour time period.
Conclusion
PROteolysis Targeting Chimeras are a new class of drug molecules which offer great promise to overcome the disadvantages of typical small molecule drugs, such as drug resistance, toxicity, and inability to address all the druggable proteome, whilst retaining the advantages of simple chemical synthesis, easy scale up and patient friendly administration. In this study we have employed sub 2 µm reversed-phase chromatography coupled to tandem quadrupole MS operated in multiple reaction monitoring mode to quantify PROTAC-3-gefitinib and its metabolites in urine following subcutaneous administration at 10 mg/kg to the male rat. The high sensitivity and wide linear dynamic range of the Xevo TQ Absolute facilitated the quantification of both the low concentration PROTAC-3-gefitinib drug and the M6 and M8 metabolites as well as the higher concentration M1, M4, M7, and M9 metabolites in one single batch. The high-resolution separation offered by the ACQUITY Premier UPLC System allowed for the resolution of PROTAC-3-gefitinib from the metabolites as well as the metabolites from each other, thus improving the specificity of the quantification. The resulting data showed that the majority of the drug related material eliminated in the urine was in the form of O-glucuronide, sulfate, and O-dealkylation cleavage metabolites. The data also showed that the drug related material had not been completely eliminated from the system by the 24 hour sampling time point.
References
- Kenten J.H, Roberts S.F. Controlling Protein Levels in Eucaryotic Organisms, US Patent US6306663B1.
- Goracci L, Desantis J, Valeri A, Castellani B, Eleuteri M, Cruciani G. Understanding the Metabolism of Proteolysis Targeting Chimeras (PROTACs): The Next Step Toward Pharmaceutical Applications. J Med Chem. 2020 22;63(20):11615–11638. doi: 10.1021/acs.jmedchem.0c00793.
- Molloy B.J., King A., Mullin L., Gethings L.A., Riley R., Plumb R., Wilson I.D. Rapid Determination of the Pharmacokinetics and Metabolic Fate of Gefitinib in the Mouse Using a Combination of UPLC/MS/MS, UPLC/QToF/MS, and Ion Mobility (IM)-Enabled UPLC/QToF/MS. Xenobiotica. 2021;51:434–446. doi: 10.1080/00498254.2020.1859643.
- McKillop D., Hutchison M., Partridge E.A., Bushby N., Cooper C.M.F., Clarkson-Jones J.A., Herron W., Swaisland H.C. Metabolic Disposition of gefitinib, an Epidermal Growth Factor Receptor Tyrosine Kinase Inhibitor, in Rat, Dog, and Man. Xenobiotica. 2004;34:917–934. doi: 10.1080/00498250400009171.
- Liu X., Lu Y., Guan X., Dong B., Chavan H., Wang J., Zhang Y., Krishnamurthy P., Li F. Metabolomics Reveals the Formation of Aldehydes and Iminium in Gefitinib Metabolism. Biochem. Pharmacol. 2015;97:111–121. doi: 10.1016/j.bcp.2015.07.010.
- Rapid High Sensitivity LC-MS/MS Bioanalytical Method for the Simultaneous Quantification of Gefitinib Based PROTACs–3 and Gefitinib in Rat Plasma to Support Discovery DMPK Studies, Waters Application Note. 720008229. January 2024.
720008484, October 2024