• 应用纪要

A Streamlined Data Dependent Acquisition (DDA) Peptide Mapping Workflow for Characterizing Therapeutic Proteins Using the Biopharmaceutical Platform Solution with UNIFI

A Streamlined Data Dependent Acquisition (DDA) Peptide Mapping Workflow for Characterizing Therapeutic Proteins Using the Biopharmaceutical Platform Solution with UNIFI

  • Liuxi Chen
  • Ying Qing Yu
  • Waters Corporation

Abstract

The results presented here demonstrate the dedicated DDA peptide mapping workflow within the Biopharmaceutical Platform Solution with UNIFI. The workflow allows seamless integration of data acquisition, processing, and reporting. Combining the FastDDA acquisition method and the high MS and MS/MS sensitivity provided by the Xevo G2-XS QTof, the UPLC/DDA workflow successfully yields high sequence coverage of the mAbs, and confirms the low level spiked-in peptide at 0.1% level and identifies low level modifications like deamidation and oxidation. 

Benefits

The Biopharmaceutical Platform Solution with UNIFI provides a DDA workflow for peptide mapping analysis, including FastDDA acquisition, data processing, and automatic report generating. This workflow enables the capability of targeted fragmentation, detailed PTM characterization, and confident sequence confirmation, even for peptides present at low concentrations.

Introduction

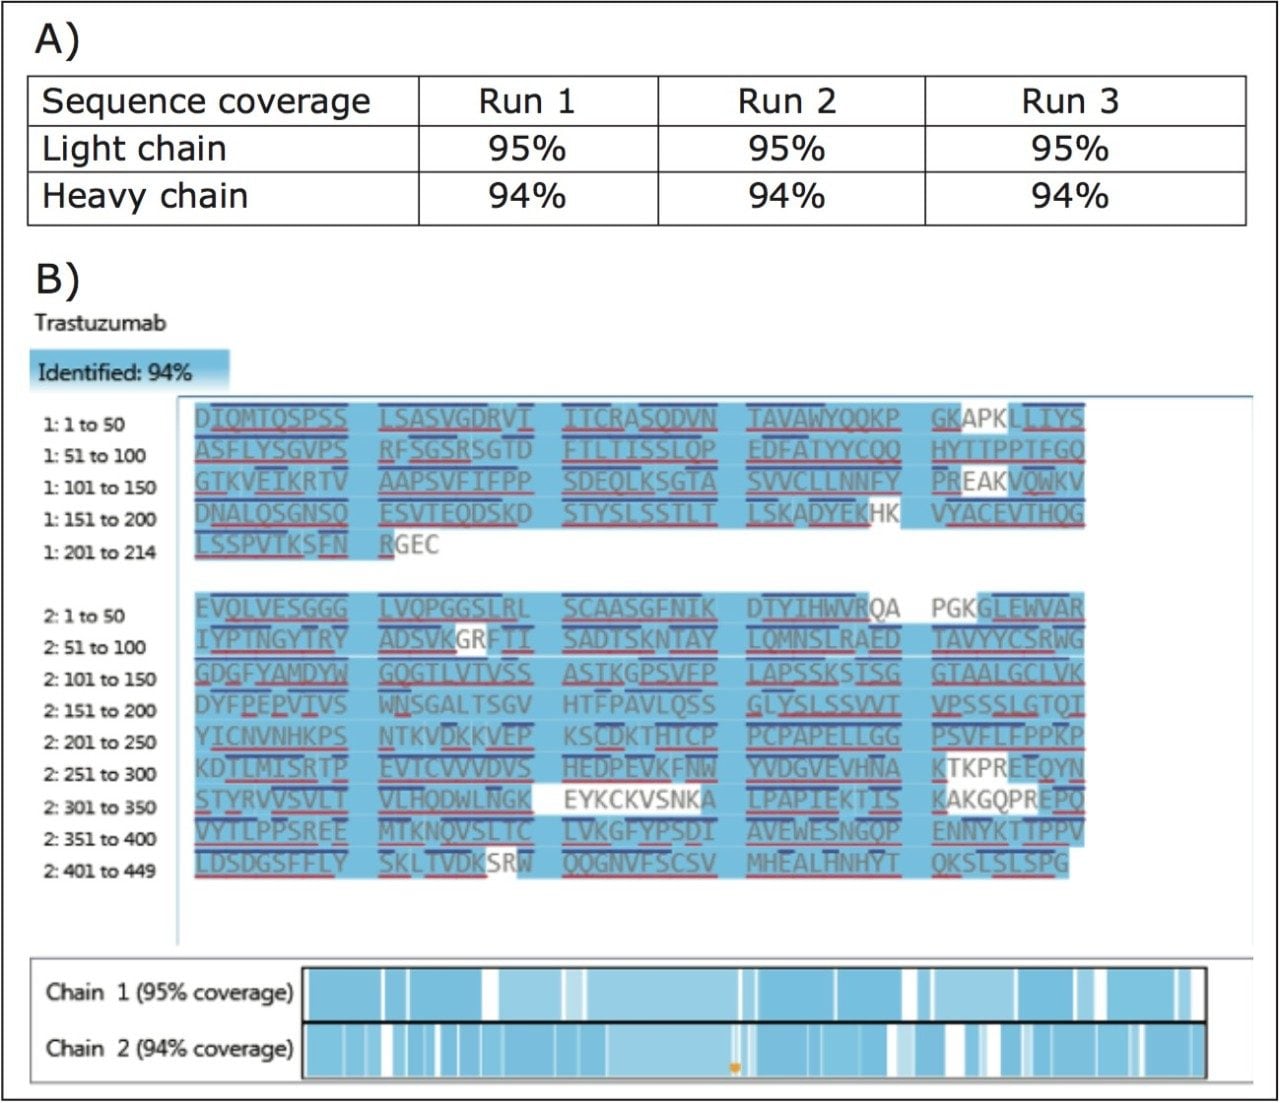
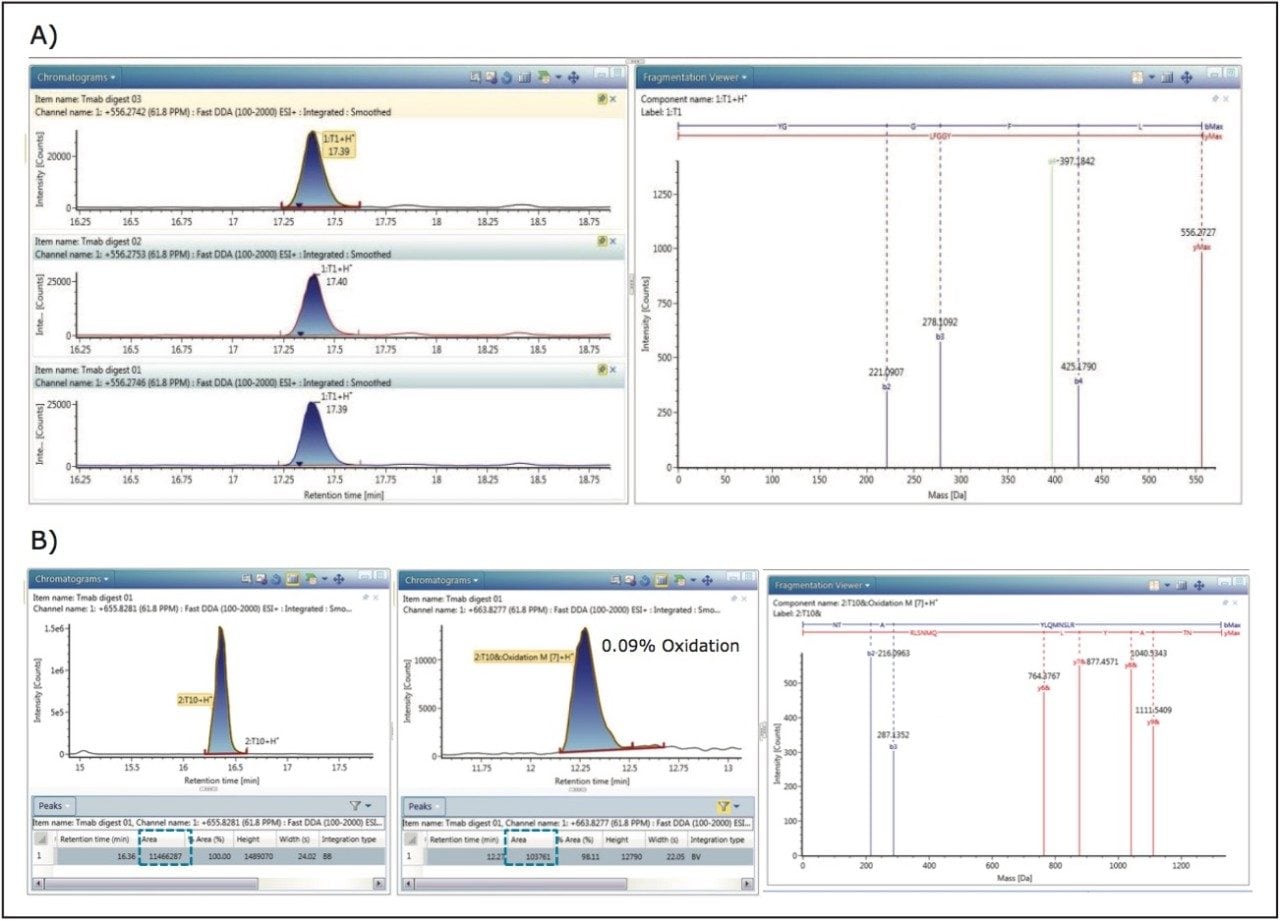
LC-MS/MS using data dependent acquisition (DDA) has been widely used to qualitatively characterize therapeutic protein digests. It is used to confirm the primary sequence of proteins and characterize their post-translational modifications (PTMs), such as oxidation, deamidation, and glycation. However, it’s also well recognized that this approach has a number of limitations, including under-sampling, a lack of reproducibility, and a lack of in-sample dynamic range. To address this, Waters offers a DDA algorithm called FastDDA. FastDDA is proven to deliver more consistent results between injections and provides greater sequence coverage of proteins.1

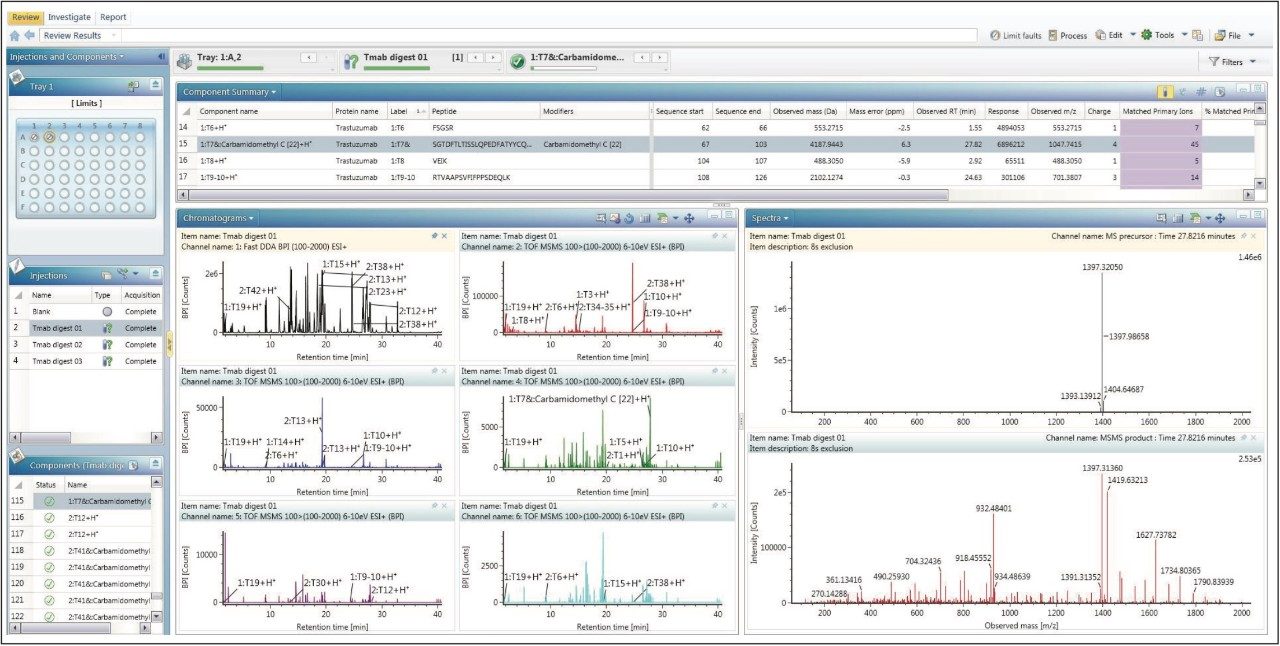
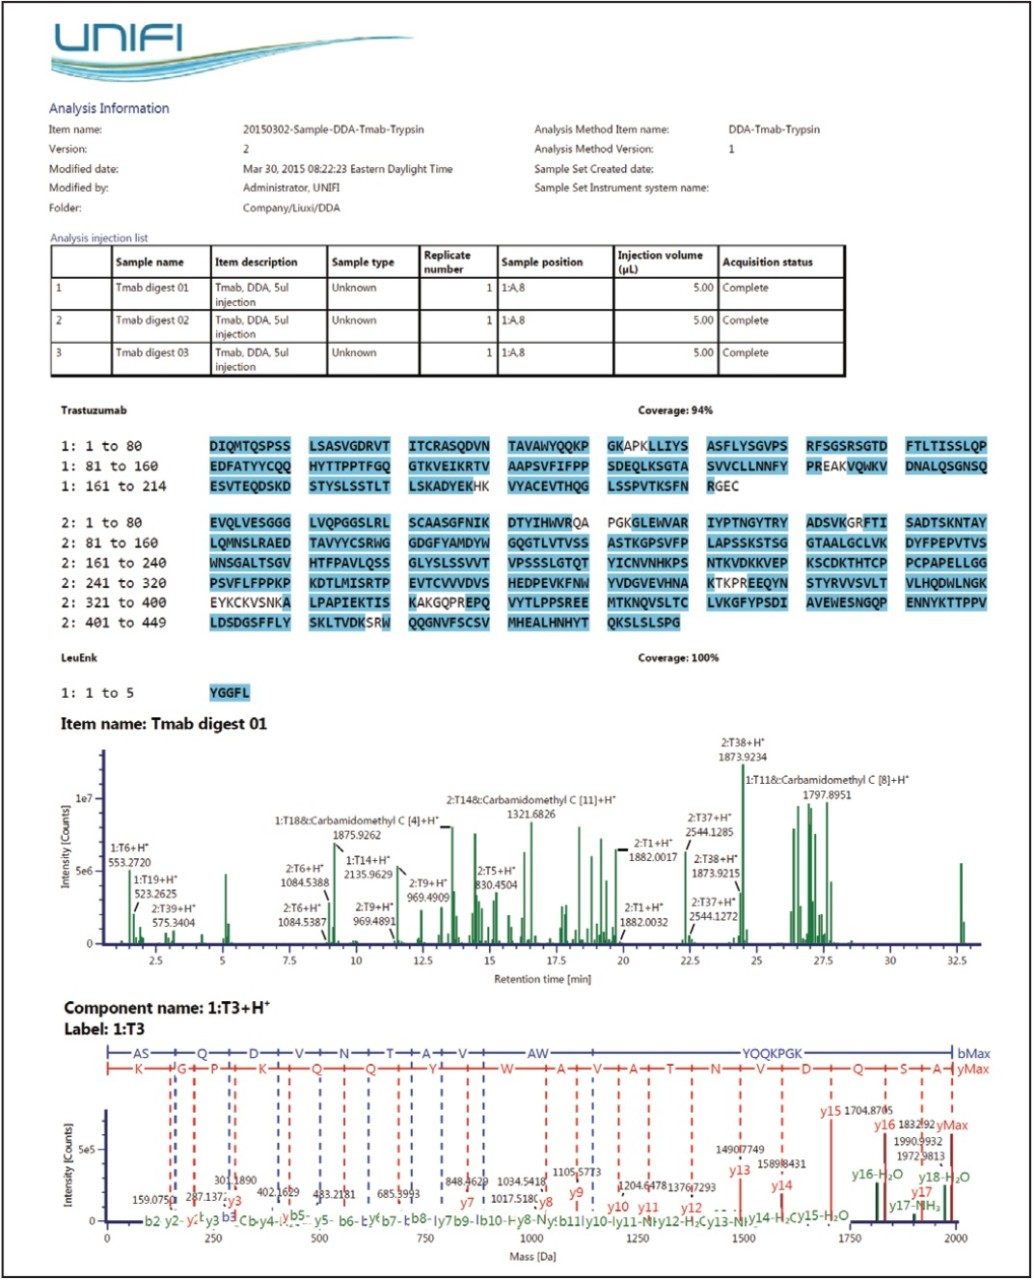
The Biopharmaceutical Platform Solution with UNIFI provides a dedicated DDA peptide mapping workflow, which streamlines data acquisition, processing, and report generation. This streamlined workflow enables an efficient way to analyze a large batch of samples and compile complex results into a comprehensive report.

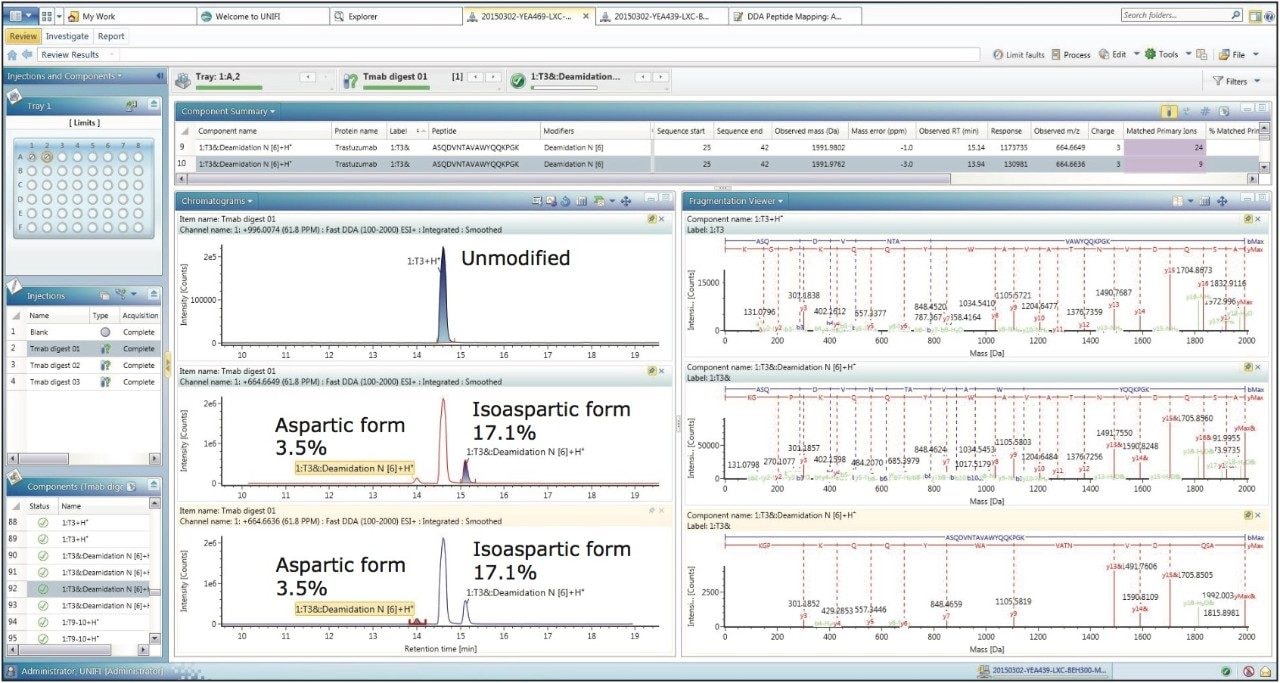
Here, we illustrate this workflow using a trastuzumab tryptic digest mixture, which has been spiked with a standard peptide leucine enkephalin at 0.1% level. The platform used for this study is comprised of an ACQUITY UPLC H-Class Bio System and an ACQUITY UPLC Tunable UV (TUV) Detector in-line with a Xevo G2-XS QTof Mass Spectrometer. The Xevo G2-XS QTof combines StepWave ion optics with an XS collision cell, and significantly increases MS and MS/MS sensitivity without reduction in selectivity.2,3

In this study, we evaluate the MS and MS/MS data quality, especially for low abundant peptides, and the reproducibility of the FastDDA method. In addition, we demonstrate the informatics tools within the UNIFI Scientific Information System that enable efficient reviewing and reporting of the DDA peptide mapping data.

Experimental

LC conditions

LC system:

ACQUITY UPLC H-Class Bio

Detector:

ACQUITY UPLC TUV

Column:

ACQUITY UPLC BEH C18, 300Å, 1.7 μm, 2.1 x 100 mm (p/n 186003686)

Column temp.:

65 °C

Mobile phase A:

0.1% formic acid in water

Mobile phase B:

0.1% formic acid in acetonitrile

Optical detection:

UV 214 nm

Injection volume:

5 μL

LC gradient table:

Time(min)

Flow(mL/min)

%A

%B

%C

%D

Curve

Initial

0.20

95

5

0

0

6

2

0.20

95

5

0

0

6

40

0.20

57

43

0

0

6

42

0.20

20

80

0

0

6

45

0.20

20

80

0

0

6

46

0.20

95

5

0

0

6

60

0.20

95

5

0

0

6

MS conditions

MS system:

Xevo G2-XS QTof

Capillary voltage:

3.0 kV

Sampling cone:

30 V

Source temp.:

120 °C

Desolvation temp.:

250 °C

Cone gas flow:

0 L/h

Desolvation gas flow:

600 L/h

Acquisition mode:

FastDDA

Mass range (MS and MS/MS):

100-2000 m/z

MS scan time:

0.2 sec

MS/MS scan time:

0.1 sec

Peak detection:

+1, +2, +3, +4, +5, +6

Max. # MS/MS scans/survey:

5

Dynamic peak exclusion:

Acquire and then exclude for 8 sec (± 1.1 Da)

Collision energy:

m/z dependent ramp applied for low and high mass

Stop MS/MS criteria:

TIC 5e8 or 0.4 sec

Lockmass used:

100 fmol/μL of glu-fibrinopeptide B in ([M+2H]2+, 785.8426)

Data management

UNIFI Scientific Information System v1.8

Analysis type:

Peptide map (DDA)

Search settings:

1 allowed missed cleavage; carbamidomethyl cysteine (C) is selected as a fix modification; asparagine (N) deamidation and methionine (M) oxidation are set as variable modifications.

Sample preparation

Trastuzumab (1 mg/mL) was denatured in 6.5 M guanidine chloride, 0.25 M tris, pH 7.5. The denatured antibody solution was mixed with 500 mM DTT to a final concentration of 3 mM and incubated at room temperature for 45 minutes, and then alkylated by adding 500 mM iodoacetamide stock solution to a final concentration of 7 mM incubated at room temperature in the dark for 40 minutes. Buffer exchange (0.1 M tris, pH 7.5) was performed with a NAP-5 column (GE Healthcare). Sequencing grade modified trypsin was added to each sample (enzyme to protein ratio 1:25, w/w) and incubated at 37 °C for 5 hours. The digested peptide mixture was diluted to 0.45 pmol/μL. Leucine enkephalin (LeuEnk) was added to the mixture at final concentration of 5 fmol/μL. The injection volume for each LC-MS run was 5.0 μL (2.25 pmol on column per injection).

Results and Discussion

Trastuzumab tryptic digest mixture spiked with LeuEnk was analyzed in triplicate runs by the automated UPLC/DDA peptide mapping workflow within the Biopharmaceutical Platform Solution with UNIFI. To evaluate the system’s ability to obtain high quality MS/MS data from the low abundant peptides in the peptide mixtures using the FastDDA methods, LeuEnk was added at 0.1% level. The maximum number of MS/MS scans was set as five, which proved to be sufficient for confirming the sequence of the target protein. The exclusion window was set to allow an average of two scans across one chromatographic peak. The charge state reorganization algorithm was used to select 1+ to 6+ ions for fragmentation. In a single run, we observed 95% sequence coverage for light chain and 94% for heavy chain.

Reproducible results were observed in triplicate runs as shown in Figure 1A. The protein sequence coverage map can be displayed for the protein of choice. Criteria for the peptide confirmation can be manually defined by the user based on the purpose of the analysis. The criteria for assigning the identified peptides for current analysis are (1) %matched primary ions is larger than 30%, and (2) mass error on peptide mass is less than 10 ppm. In Figure 1B, confirmed sequences are shown in blue shades. In addition, N-terminal and C-terminal fragments (b/y ions) observed can be displayed on the coverage map as blue (on the top) and red (at the bottom) lines on the sequence map respectively.

Figure 1. A) Sequence coverage comparison in three consecutive runs. B) Sequence coverage map by FastDDA for trastuzumab, provided in UNIFI Scientific Information System, b/y ions observed are also labeled on the map. Blue underline indicates b ions and red underline indicates y ions. The criteria for assigning the identified peptides are (1) %matched primary ions is larger than 30%, and (2) mass error is less than 10 ppm. %matched primary ions = matched primary ions/total number of possible primary ions.

LeuEnk peptide, spiked in the sample at 0.1% level, was identified in all three replicate runs with high quality MS/MS data. The annotated DDA spectrum of LeuEnk and extracted ion chromatogram (XIC) of each run is shown in Figure 2A. In addition, peptide modifications present in low abundance were identified with high confidence in this experiment.

One example of a low abundant 2:T10 peptide (heavy chain, the 10th tryptic peptides from N-terminus) with methionine oxidation was identified at 0.09% level (Figure 2B). Percentage modification can be calculated from peak areas of XICs of non-modified 2:T10 and oxidized 2:T10. Improved instrument speed and sensitivity allows high quality MS/MS spectra, as well as sufficient data points across chromatographic elution peaks. XIC of each component can be displayed in the Review panel (Figure 2B). Fragmentation spectra with the matched b/y ions are shown on the right in the Fragmentation Viewer. 

Figure 2. Peptides present at low abundance were identified with high confidence using the FastDDA method. A) LeuEnk was identified in all three injections at 0.1% level (25 fmol load on column). XIC of each run is shown on the left and the annotated MS/MS spectrum is shown on the right. B) XICs of non-modified 2:T10 and oxidized 2:T10, with peak areas shown in the table below. The annotated MS/MS spectrum of oxidized 2:T10 is displayed in the Fragmentation Viewer.

UNIFI Scientific Information System provides a sensible DDA peptide mapping workflow for automatic DDA, data processing, and report generating. In this workflow, peptides are assigned by accurate mass from the precursors, confirmed with MS/MS fragmentation. The assignment was given to the best matched peptides, or modified peptides generated by in silico digests of proteins defined within the method.

Figure 3 shows the analysis center for the processed results of the DDA peptide mapping data. The Component Summary table at the top of the screen capture shows key attributes from chromatography and mass spectrometry on the identified peptides. On the bottom left, chromatograms of MS and five MS/MS channels are shown. The entire identified components label can be added on all the chromatograms. On the bottom right, the centroid spectra of the MS precursor and MS/MS products are shown to provide a convenient way for on-the-fly spectra review of every identified component.

Figure 3. Review panel of the processed peptide mapping DDA data.

It is important to note that the software is able to automatically assign the specific location of the modifier on the peptide sequence, based on fragmentation pattern. For example, in Figure 4, 1:T3 peptide (the 3rd tryptic peptide from N-terminus) from light chain and its deaminated forms (isoaspartic acid and aspartic acid) were identified with high quality MS/MS spectra; 1:T3&Deamidation N [6] at the top of the fragment display indicates the modification occurs at the sixth amino acid position.4

Figure 4. XIC of 1:T3 and deamidation (N) peaks of 1:T3 both the isoaspartic acid and aspartic acid forms are shown on the left, while the corresponding MS/MS spectra of the identified components are displayed on the right.

Reporting templates are available for the UPLC/DDA peptide mapping workflow. Figure 5 provides a snapshot of a typical DDA peptide mapping report; information such as acquisition and sample information, sequence coverage map, identified component plots, and fragmentation viewer, can be organized within a single report format. The object properties, as well as the whole report template, are configurable by the user. Multiple report templates can be executed for an analysis to answer multiple scientific questions in an efficient format.

Figure 5. Example of a DDA peptide mapping report.

Conclusion

The results presented here demonstrate the dedicated DDA peptide mapping workflow within the Biopharmaceutical Platform Solution with UNIFI. The workflow allows seamless integration of data acquisition, processing, and reporting. Combining the FastDDA acquisition method and the high MS and MS/MS sensitivity provided by the Xevo G2-XS QTof, the UPLC/DDA workflow successfully yields high sequence coverage of the mAbs, and confirms the low level spiked-in peptide at 0.1% level and identifies low level modifications like deamidation and oxidation.

The ability to integrate and automate the DDA peptide mapping workflow greatly reduces the time between data collection and drug development decision-making, subsequently improving the efficiency of laboratories that are challenged with interpreting complex peptide mapping results.

References

  1. A new Data Dependent Acquisition Algorithm (FastDDA) for the Rapid Characterization of Complex Mixtures. Waters technology brief. 2011 (p/n 720003961en).
  2. Stepwave: Enhancing MS Sensitivity and Robustness. Waters white paper. 2012 (p/n 720004175en).
  3. The XS Collision Cell from Waters: Increased sensitivity and resolution for Time-of Flight mass spectrometry. Waters white paper. 2014 (p/n 720005071en).
  4. Analysis of Deamidation and Oxidation in Monoclonal Antibody Using Peptide Mapping with UPLC-MS.E Waters application note. 2009 (p/n 720002897en).

720005399, May 2015

返回顶部 返回顶部