• 应用纪要

Rapid and Simultaneous Analysis of Urinary Catecholamines and Metanephrines Using Mixed-Mode SPE and Hydrophilic Interaction Chromatography (HILIC) for Clinical Research

Rapid and Simultaneous Analysis of Urinary Catecholamines and Metanephrines Using Mixed-Mode SPE and Hydrophilic Interaction Chromatography (HILIC) for Clinical Research

  • Jonathan P. Danaceau
  • Erin E. Chambers
  • Kenneth J. Fountain
  • Waters Corporation

For research use only. Not for use in diagnostic procedures.

Abstract

Figure 3 shows a similar comparison, however only 250 fg of testosterone in solvent on column. In this specific experiment, this was found to be the limit of detection for the MRM experiment. The peak, however, is totally absent in the MS experiment.

The extraction and analysis of urinary catecholamines and metanephrines using the Oasis mixed-mode weak cation exchange (WCX) plates and an ACQUITY UPLC BEH Amide Column in HILIC mode is detailed. Extraction using the Oasis WCX Plate resulted in low matrix effects and consistent recoveries for all compounds that translated into excellent analytical precision. HILIC separation resulted in reduced matrix effects for NE and EP and improved resolution between EP and NMT, compared to optimized reversed-phase separations. Quantitative results were excellent, with linear responses from 0.5-500.0 ng/mL and excellent accuracy and analytical precision.

Benefits

  • Retention and baseline resolution of monoamine neurotransmitters and metanephrines without the need for ion-pairing reagents
  • Rapid, simultaneous quantification of urinary metanephrines and catecholamines
  • Linear, accurate and precise results from 0.5–500 ng/mL

Introduction

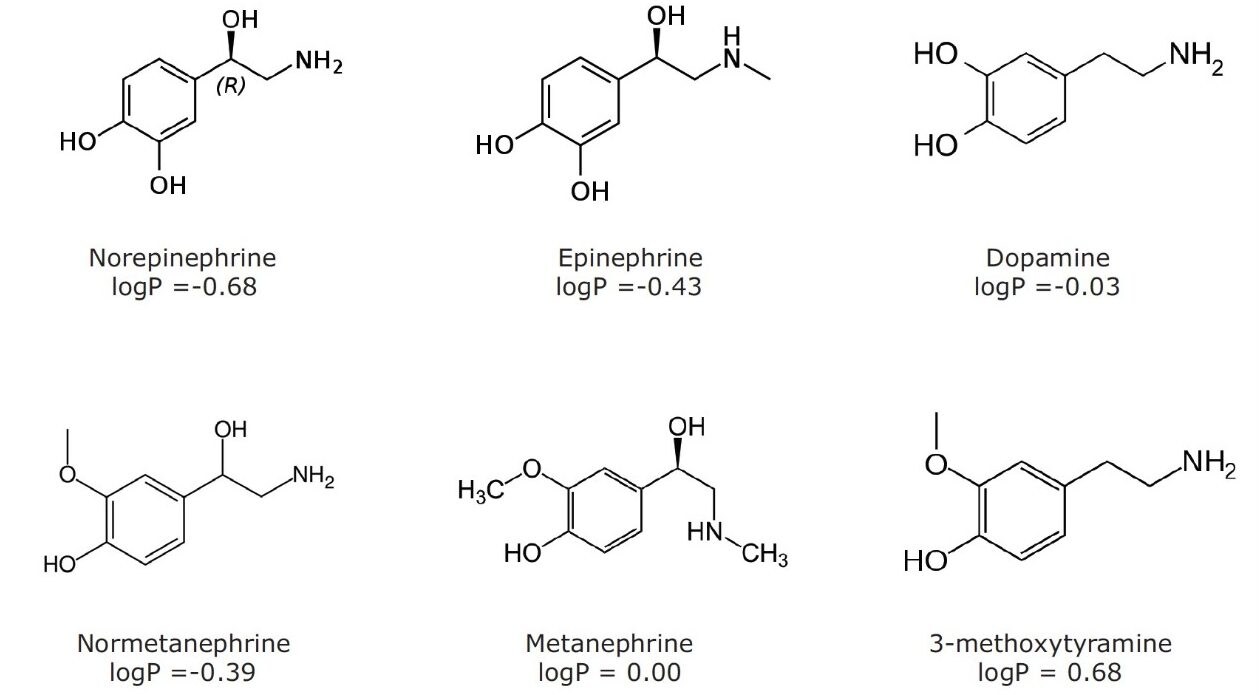
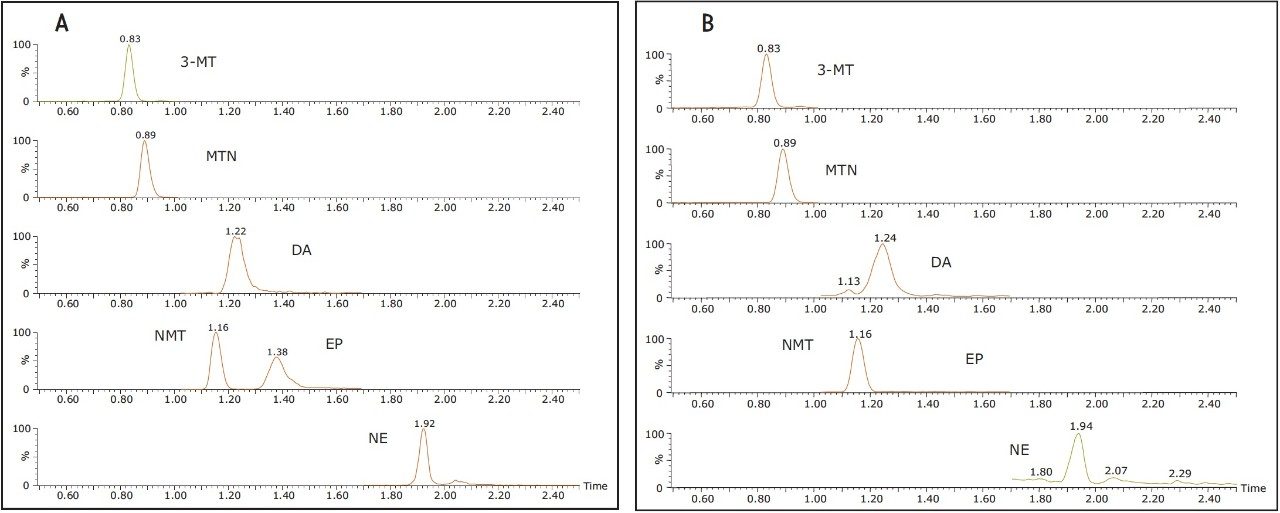
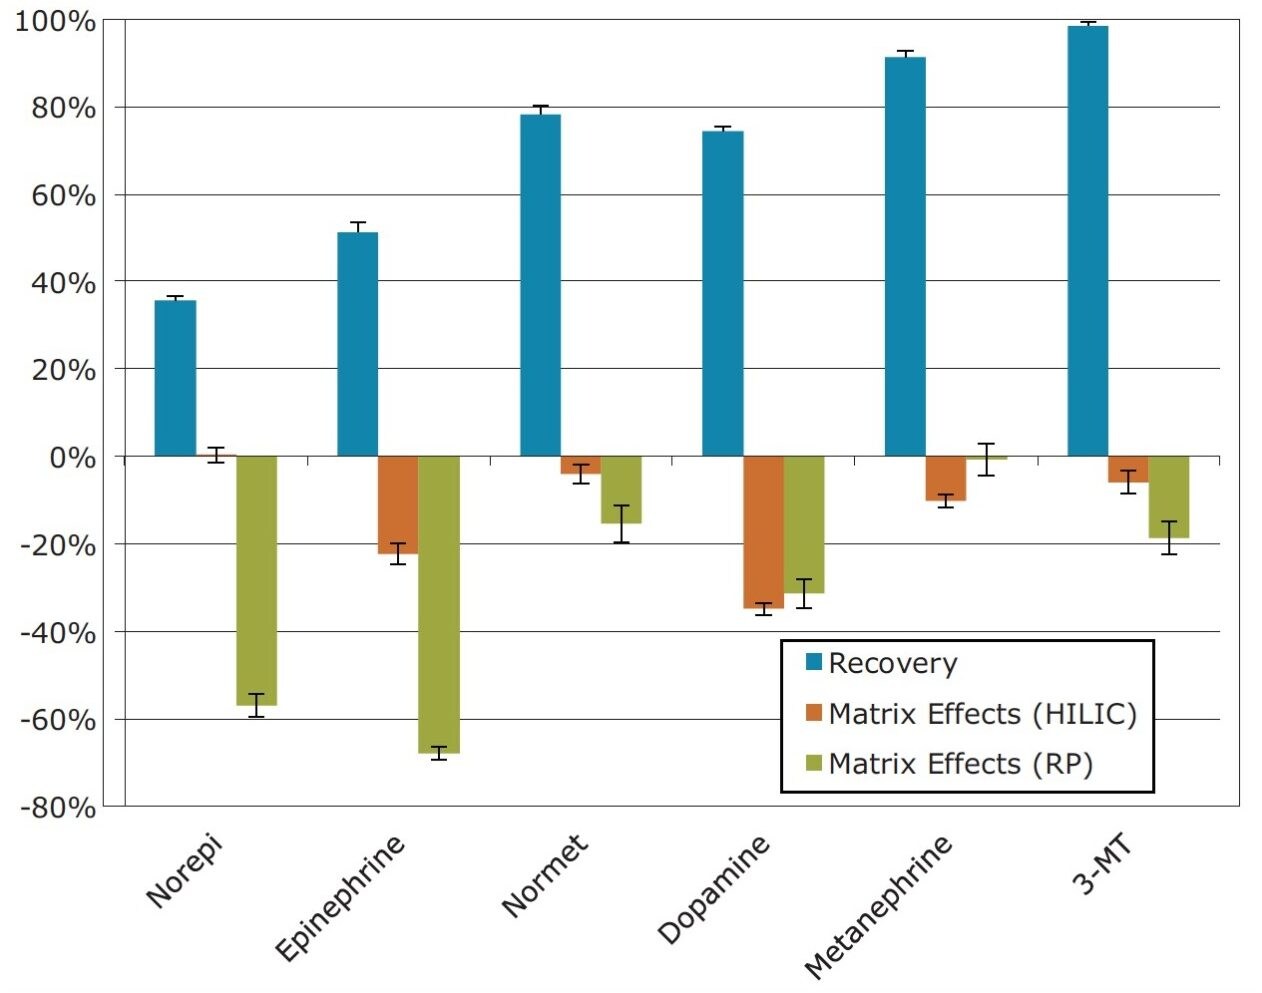
Clinical researchers are often interested in measuring elevated concentrations of urinary catecholamines and their O-methylated metabolites (metanephrines). However, these compounds (in particular, norepinephrine, epinephrine, and dopamine) can be a challenge to analyze via reversed-phase LC-MS/MS due to their polarity. As a result, many research laboratories still analyze this panel using ion-pairing reagents and electrochemical detection (ECD). While reversed-phase LC-MS/MS has been used successfully, challenges still exist due to ion-suppression from urine matrix components, insufficient retention, and inadequate separation of normetanephrine and epinephrine.

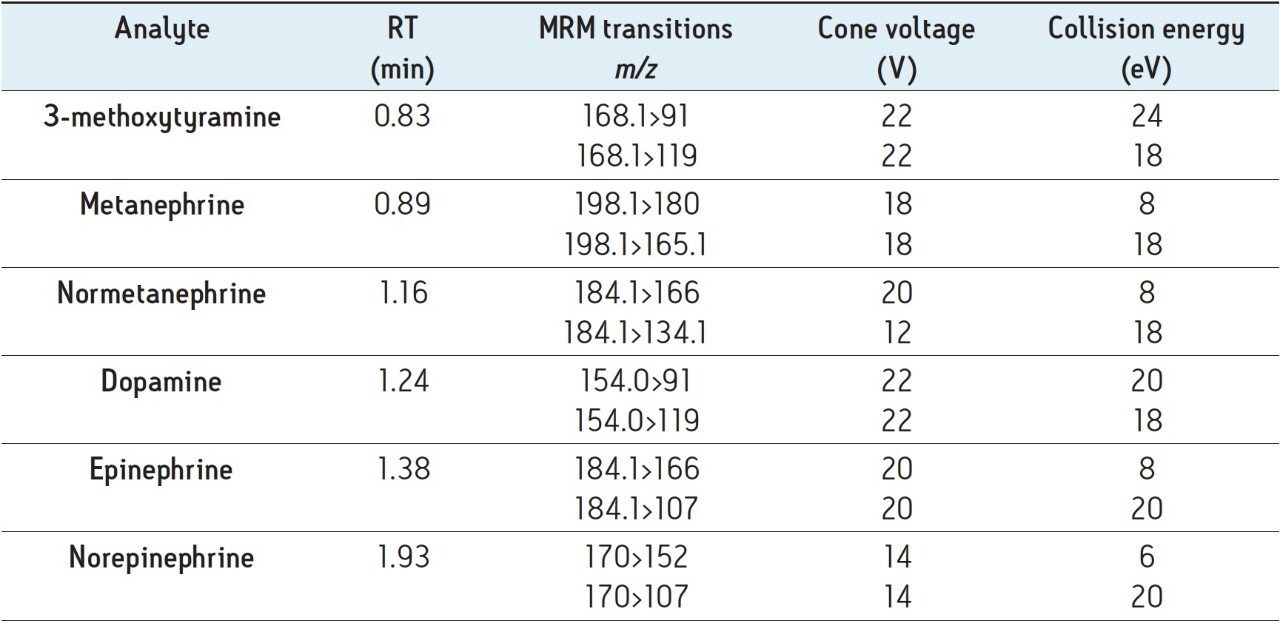
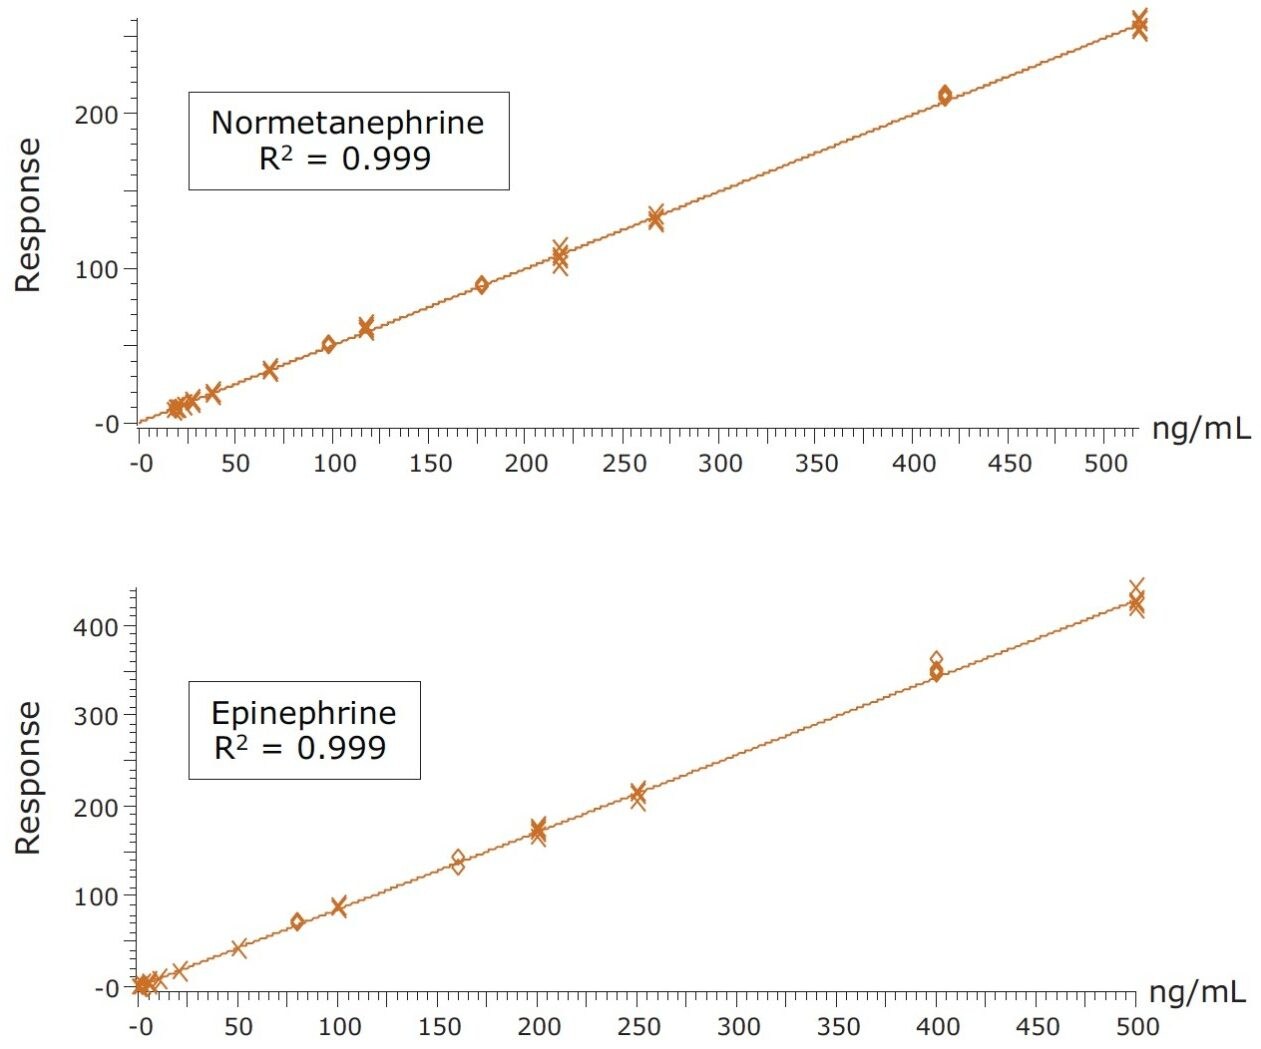
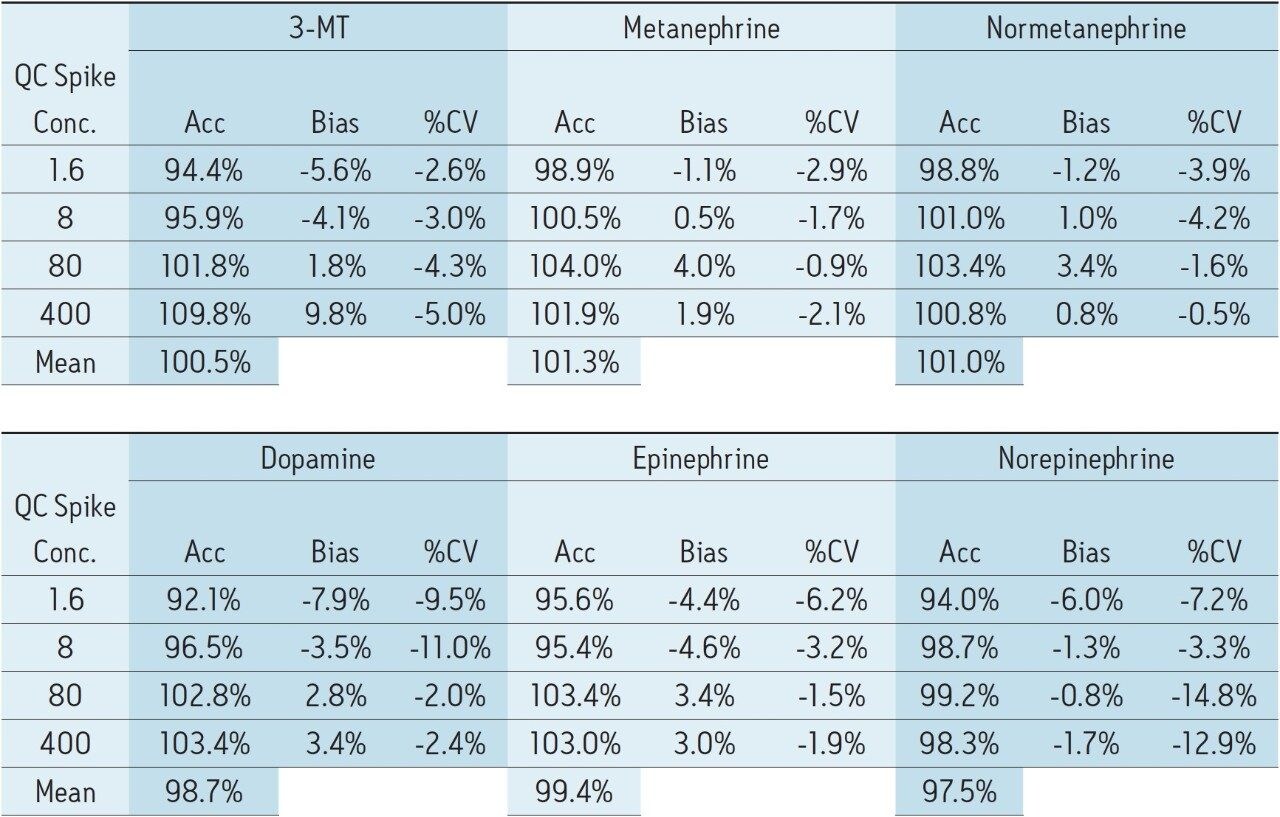
Hydrophilic interaction chromatography (HILIC) is increasingly becoming a method of choice for the analysis of polar compounds.1-6 Expanding upon an earlier published method,6 this application note describes the extraction  and analysis of monoamine neurotransmitters and metanephrines from urine. HILIC-based chromatographic separation is achieved using a Waters ACQUITY UPLC BEH Amide Column. Waters Oasis WCX 96-well Plates are used to extract these compounds from urine. The use of mixed-mode weak cation exchange solid-phase extraction (SPE) plates, in combination with the amide column for HILIC chromatography and the Waters Xevo TQD mass spectrometer, result in a rapid, robust method with excellent linearity,  accuracy and precision, as well as minimal matrix effects.

Experimental

LC conditions

LC System:

ACQUITY UPLC I-Class

Column:

ACQUITY UPLC BEH Amide Column, 1.7 μm, 2.1 x 100 mm

Column temp.:

30 °C

Sample temp.:

10 °C

Mobile phase A (MPA):

95:5 Water:ACN containing 50-mM NH4HCOO, pH 3.0

Mobile phase B (MPB):

15:85 Water:ACN containing 30-mM NH4HCOO, pH 3.0

Needle washes:

Strong and weak needle washes were both placed in MPB


The gradient ramp is shown in Table 1 and includes an initial hold, followed by a shallow ramp, and an increase in flow rate to re-equilibrate the column.


MS conditions

LC System:

ACQUITY UPLC I-Class

Column:

ACQUITY UPLC BEH Amide Column, 1.7 μm, 2.1 x 100 mm

Column temp.:

30 °C

Sample temp.:

10 °C

Mobile phase A (MPA):

95:5 Water:ACN containing 50-mM NH4HCOO, pH 3.0

Mobile phase B (MPB):

15:85 Water:ACN containing 30-mM NH4HCOO, pH 3.0

Needle washes:

Strong and weak needle washes were both placed in MPB

Data were acquired and analyzed using Waters MassLynx Software (V4.1; SCN 855) and quantitated using TargetLynx.

Gradient

Time (min)

Flow (mL/min)

%A

%B

0.0

0.6

0.0

100.0

1.0

0.6

0.0

100.0

2.0

0.6

10.0

90.0

2.1

1.0

10.0

90.0

2.5

1.0

30.0

70.0

2.6

1.0

0.0

100.0

3.9

1.0

0.0

100.0

4.0

0.6

0.0

100.0

Table 1. Mobile phase gradient. The compositions of MPA and MPB are listed in the methods section

Combined stock standards (10 µg/mL) of dopamine (DA), norepinephrine (NE), epinephrine (EP), 3-methoxytyramine (3-MT), metanephrine (MTN), and normetanephrine (NMT) were prepared in methanol containing 0.1% ascorbic acid to prevent oxidation. A combined internal standard stock solution composed of 10-µg/mL D3-metanephrine, D3-normetanephrine, D4-dopamine, D6-epinephrine, and D6-norepinephrine was also prepared in methanol containing 0.1% ascorbic acid. Working internal standard solutions were prepared daily in 5% MeOH with 0.1% formic acid at a concentration of 800 ng/mL.

Sample preparation

Urine samples were pre-treated with 10% (by volume) of 1-N HCl to mimic the acidic pre-treatment that is normally used for this method. 50-µL of internal standard working solution was added to a 400 µL aliquot of acidified urine, followed by 1-mL of 0.5 M NH4CH3COO. Pre-treated samples were loaded in individual wells of an Oasis WCX Plate that had been conditioned with 1-mL of MeOH and 1-mL of H2O. After loading the samples, wells were washed with 1-mL of 20-mM NH4CH3COO, followed by 1-mL MeOH. The 96-well plate was then dried under vacuum for 30 s to remove as much methanol as possible from the sorbent bed. The target compounds were eluted from the plate with 2 x 250 µL aliquots of 85:15 ACN:H2O containing 2% formic acid into an 800 µL 96-well Sample Collection Plate (p/n: 186002481). Each aliquot was allowed to percolate through the well by gravity to maximize the contact time with the sorbent. 10-µL of the eluate was injected onto the LC-MS/MS system.

Results and Discussion

The structures of all compounds are shown in Figure 1 along with their individual logP values, demonstrating the highly polar nature of many of these compounds. Table 2 shows the retention times and individualized MS parameters of each compound, including MRM transitions, cone voltage, and collision energy.

Figure 1. Names, molecular structures and logP values of catecholamines and metanephrines.
Table 2. Mass spectral parameters used for analysis of catecholamines and metanephrines.

Figure 2A shows the chromatography of all compounds from a 50 ng/mL calibration standard using the ACQUITY UPLC BEH Amide Column. Previous work6 had shown that 30 mM NH4HCOO and 15% water in MPB resulted in an ideal balance of ionic strength and solubility, enabling the resolution and peak shape seen in Figure 2A. One important feature of this separation is the resolution between NMT and EP. These two compounds have the same molecular formula and can interfere with each other if not adequately separated. Under reversed-phase conditions, the best achievable resolution between these two compounds was a separation of 0.05 min (3 s) vs. 0.22 min (13.2 s) in HILIC mode. HILIC mode allows for a more robust separation, ensuring unambiguous identification and quantification of these two compounds. Figure 2B shows the HILIC chromatography of an un-spiked urine sample, demonstrating the ability to determine endogenous concentrations of 3-MT, MTN, NMT, DA, EP, and NE (21.6, 10.6, 17.8, 6.0, 0.0, and 4.1 ng/mL, respectively). The lack of detectable EP is most likely a result of the fact that this urine sample had been stored for an extended period of time without acidic preservation. 

Figure 2. Chromatography of catecholamines and metanephrines on the ACQUITY UPLC BEH Amide Column, 1.7 µm, 2.1 x 100 mm. 

A. Representative 50 ng/mL calibration standard.

B. Unspiked urine sample showing chromatography of endogenous catecholamines and metanephrines. Chromatographic conditions are detailed in the methods section

Recovery and matrix effects

Extraction recoveries and matrix effects are shown in Figure 3. Recoveries ranged from 36% for NE to 98.5% for 3-MT. Reproducibility was excellent, with coefficients of variation under 5% for all compounds. Matrix effects ranged from 0% for NE to a maximum of -35% for dopamine. Most matrix effects, however, were ≤ -10%,  revealing another advantage of the HILIC methodology. Using the same extraction method, matrix effects were significantly larger (approximately -60%) for NE and EP under reversed-phase chromatography conditions. This is an important improvement, given the low endogenous concentrations of these two compounds.

Figure 3. Recovery and matrix effects for catecholamines and metanephrines extracted from urine using Oasis WCX 30 mg 96-well Plates (N=4). The green bars represent matrix effects for reversed-phase analysis. Error bars indicate standard deviations.

Quantitative results

Calibration curves and quality control samples were prepared via the standard addition method by spiking authentic urine samples with known concentrations of analytes. After data processing, the endogenous concentrations were extrapolated from the resulting calibration curves. These data were used to correct the actual calibration concentrations. For example, the urine sample used for calibration was determined to contain 6.0 ng/mL of DA, so the calibration concentrations were changed from 0.5–500.0 to 6.5–506.0 ng/mL. The resulting calibration curves showed excellent linearity, with R2 values of 0.992 or  greater for all compounds. Figure 4 shows representative calibration curves for NMT and EP, both of which have R2 values of 0.999. The endogenous calculated values are listed in the figure caption. R2 values for 3-MT,  MTN and DA were 0.998, 0.999, and 0.992, respectively. Quality control samples (N=4) overspiked at 1.6, 8.0, 80, and 400 ng/mL were accurate and precise (see Table 3). All QC values were within 10% of their target values, and most were within 5%. In addition, with only three exceptions, all coefficients of variation were less than 10%. This demonstrates that the method is linear, accurate, and precise over a calibration range that includes the entire scope of expected values for normal and pathologically elevated samples.

Figure 4. Calibration curves for normetanephrine (NMT) and epinephrine (EP) extracted from spiked urine samples. The data were fitted with a 1/x weighted linear fit. Basal concentrations for NMT and EP were 17.8 and 0 ng/mL, respectively.
Table 3. Quality control results for urinary catecholamines and metanephrines. Concentrations refer to the spiked concentration. Accuracies were calculated by comparing the result the sum of the spiked concentration and endogenous calculated values in the urine sample.

Conclusion

The extraction and analysis of urinary catecholamines and metanephrines using the Oasis mixed-mode weak cation exchange (WCX) plates and an ACQUITY UPLC BEH Amide Column in HILIC mode is detailed. Extraction using the Oasis WCX Plate resulted in low matrix effects and consistent recoveries for all compounds that translated into excellent analytical precision. HILIC separation resulted in reduced matrix effects for NE and EP and improved resolution between EP and NMT, compared to optimized reversed-phase separations. Quantitative results were excellent, with linear responses from 0.5-500.0 ng/mL and excellent accuracy and analytical precision.


References

  1. Cubbon S1, Antonio C, Wilson J, Thomas-Oates J.  Metabolomic applications of HILIC-LC-MS. Mass Spectrom Rev. 2010 Sep-Oct;29(5):671–84.
  2. Jian W1, Edom RW, Xu Y, Weng N. Recent advances in application of hydrophilic interaction chromatography for quantitative bioanalysis.  J Sep Sci. 2010 Mar;33(6–7):681–97.
  3. Xu RN1, Rieser MJ, El-Shourbagy TA. Bioanalytical hydrophilic interaction chromatography: recent challenges, solutions and applications. Bioanalysis. 2009 Apr;1(1):239–53.
  4. Jian W1, Xu Y, Edom RW, Weng N. Analysis of polar metabolites by hydrophilic interaction chromatography–MS/MS. Bioanalysis. 2011 Apr;3(8):899–912. 
  5. Hemström P1,, Irgum K. Hydrophilic interaction chromatography. J Sep Sci. 2006 Aug;29(12):1784–821.
  6. Danaceau JP1, Chambers EE, Fountain KJ. Hydrophilic interaction chromatography (HILIC) for LC-MS/MS analysis of monoamine neurotransmitters. Bioanalysis. 2012 Apr;4(7):783–94. 

720005093, July 2014

返回顶部 返回顶部