• 应用纪要

PEGylated Protein Analysis by Size-Exclusion and Reversed-Phase UPLC

PEGylated Protein Analysis by Size-Exclusion and Reversed-Phase UPLC

  • Stephan M. Koza
  • Kenneth J. Fountain
  • Waters Corporation

Abstract

In this application note, two UPLC alternatives, SE-UPLC and RP-UPLC, are presented for the analysis of PEG-Protein conjugate, non-PEGylated protein, and free active PEG levels in PEGylated protein preparations.

Benefits

  • SE-UPLC provides a rapid and high resolution separation of an unmodified protein from its PEGylated form. Successful application of SE-UPLC for this analysis can be predicted based on theoretical calculations of the hydrodynamic viscosity radii of the analytes.
  • Separation of PEG-Protein conjugate, non- PEGylated protein, and free aPEG based on their differences in their hydrophobicities is provided by RP-UPLC for this application.

Introduction

The first PEGylated biotherapeutic, pegademase, which is a bioconjugate of the bovine derived enzyme adenosine deaminase and 5 KDa molecular weight (MW) polyethylene glycol (PEG), was introduced in 1990. Pegademase is used for the treatment of individuals with severe combined immunodeficiency disease (SCID). As of 2012, there were ten approved PEGylated bioconjugates on the market and other candidates in clinical studies.1 Among other benefits, PEGylation can improve the pharmacokinetics and stability of a biotherapeutic. Interestingly, however, it has been reported that approximately 25% of the normal healthy population has a titer of antibodies against PEG which may be a result of the prevalent use of these compounds in personal care products. The development of anti-PEG antibodies has also been observed in the clinic for PEG conjugates.2, 3 Since both the efficacy and potentially the safety of PEGylated bioconjugates can depend on the extent of their PEGylation it is a critical quality attribute that should be monitored.

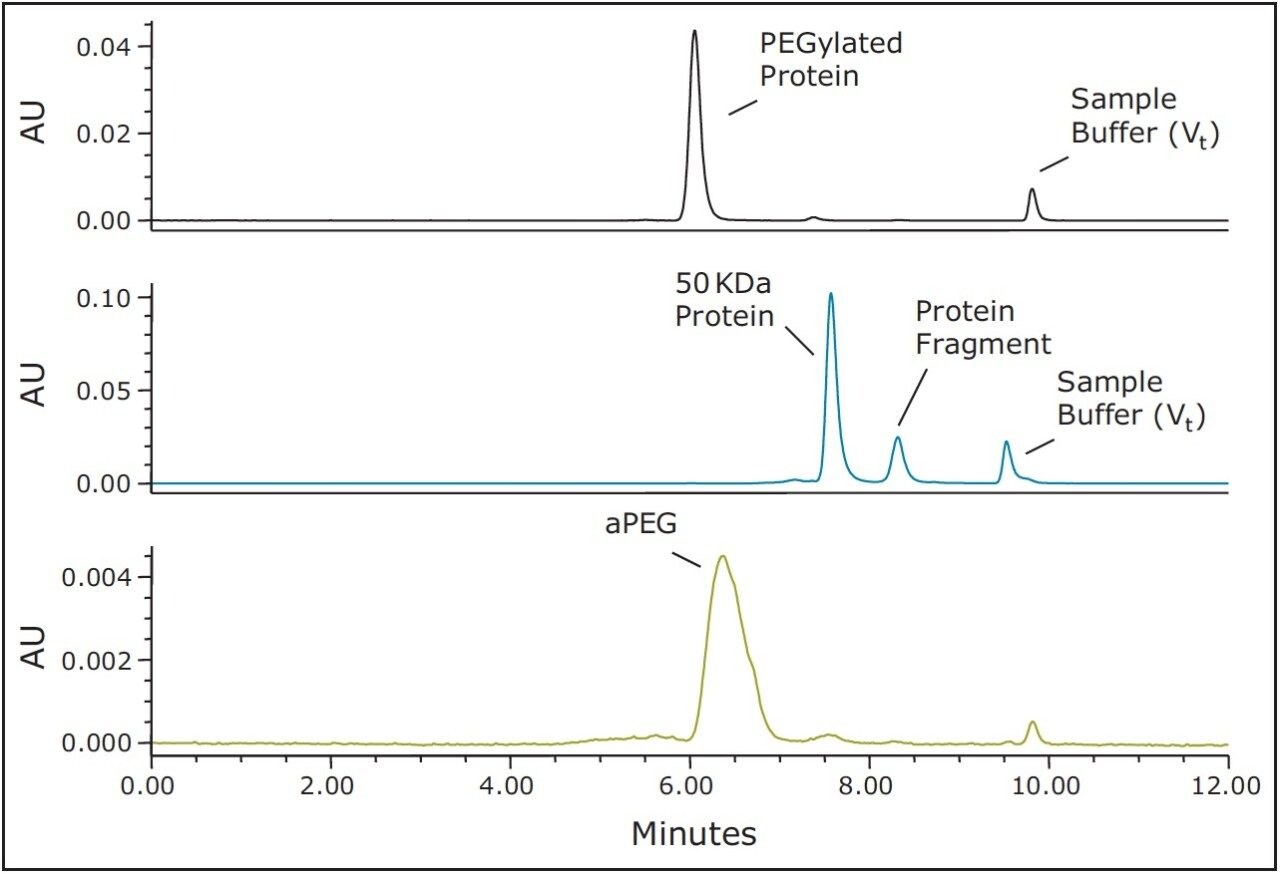
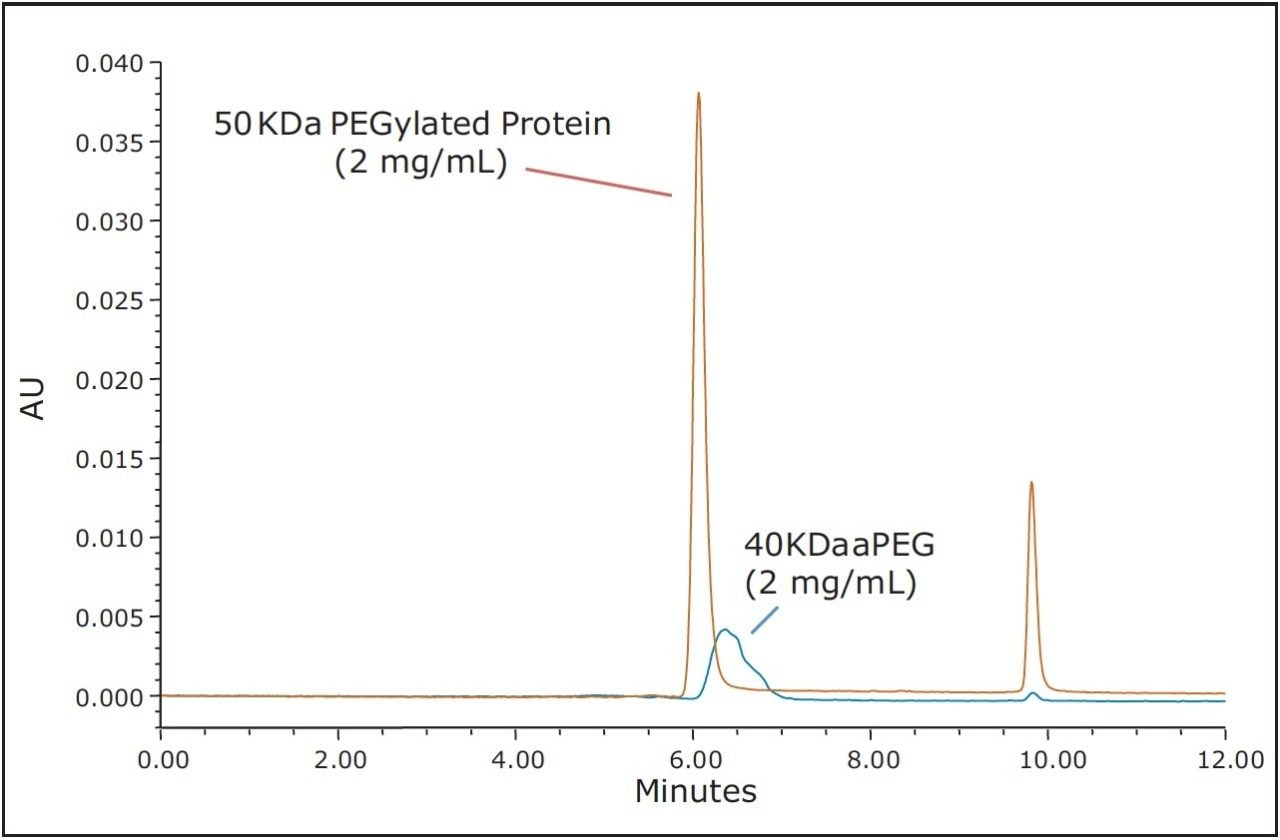
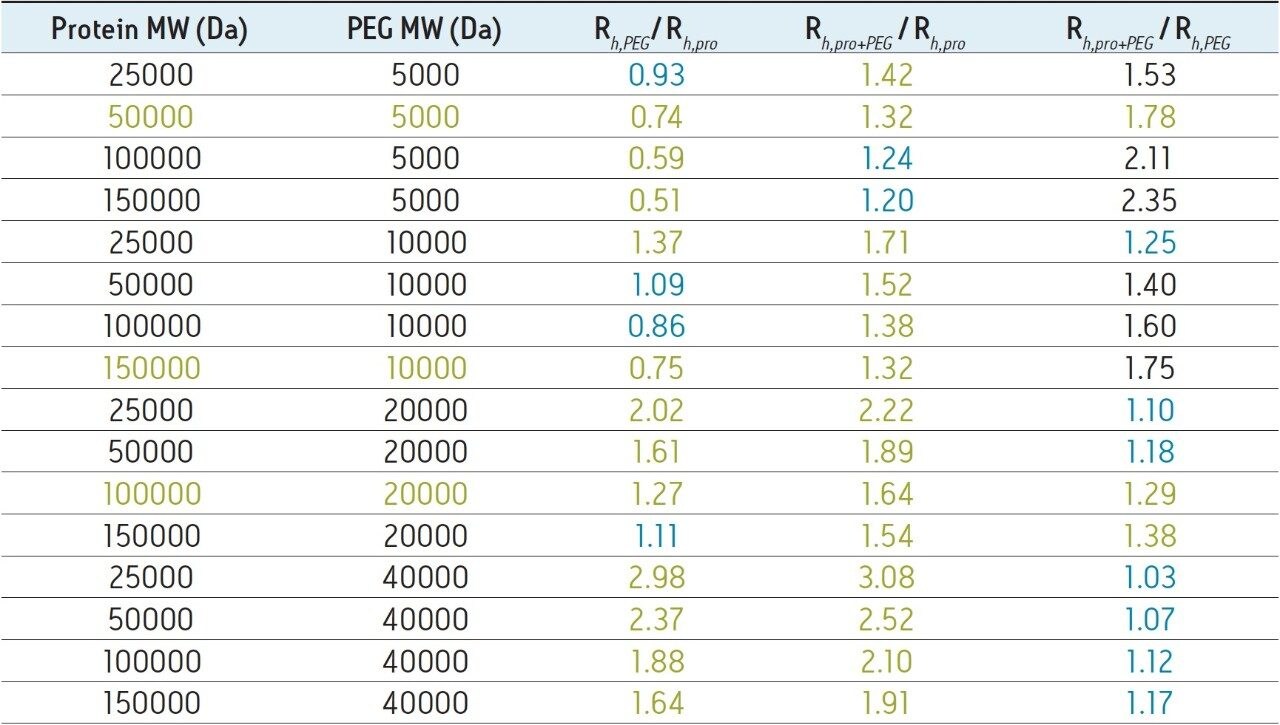
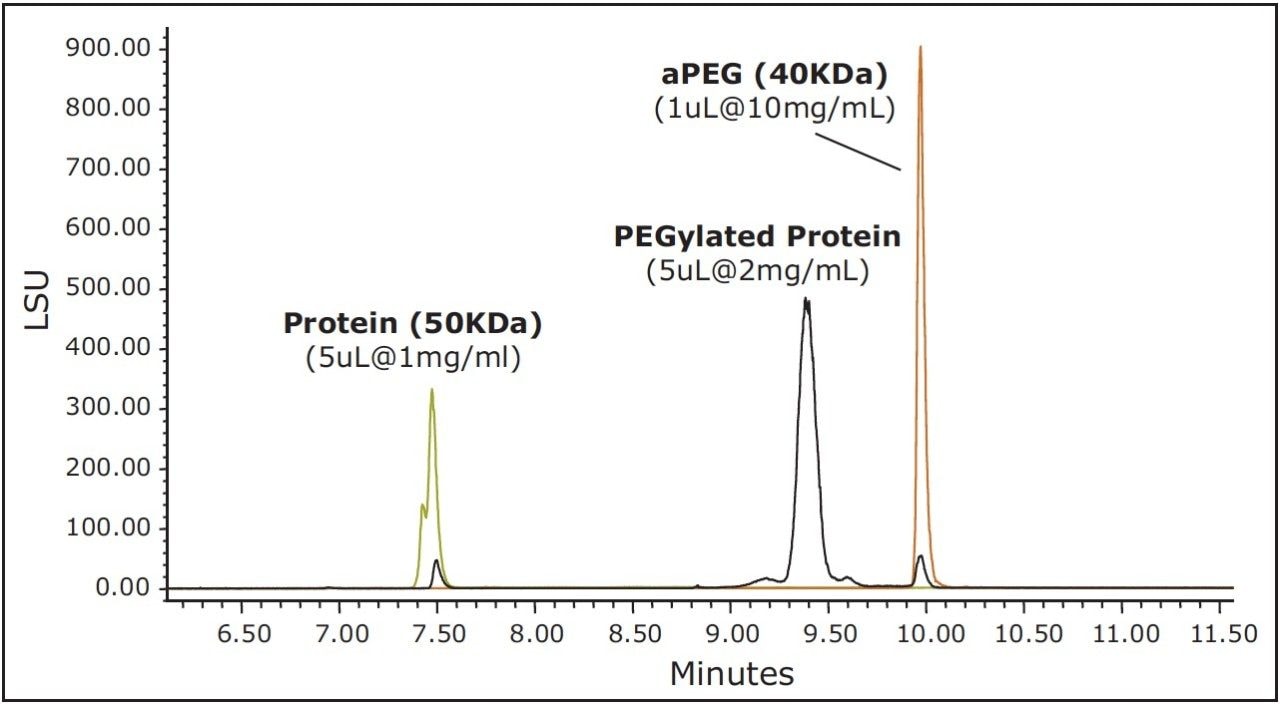
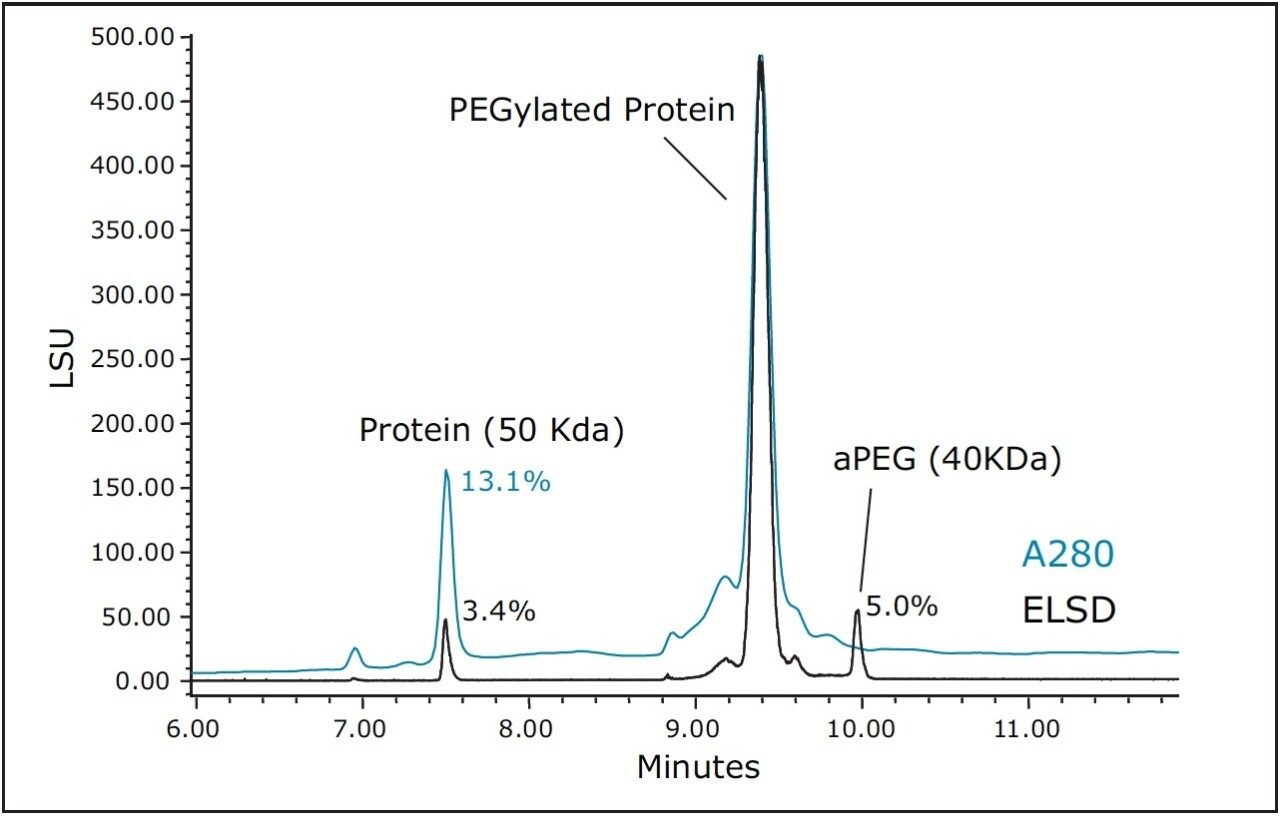
PEGylated proteins can be separated by a number of different methods including ion-exchange (IEC), size-exclusion (SEC), and reversed-phase (RPC) chromatography.4 For this application, the separation of three species, a 50 KDa molecular weight protein, a 40 KDa activated-PEG (aPEG) and the conjugate, were evaluated using UPLC configurations of both SEC (SE-UPLC) and RPC (RP-UPLC), as these methods can be readily developed to be compatible with an evaporative light scattering detector (ELSD). While the use of SEC for this type of analysis has been reported,5 the extent of success for the SEC mode of separation for this application type will ultimately be dependent upon the hydrodynamic viscosity radii of the three components as well as their polydispersity. Alternatively, the success of a RPC separation for this application is dependent on the differences in the hydrophobicities of the three components.

Experimental

Sample description

All samples were provided by a collaborator and stated concentrations are nominal values.

Method conditions (unless noted otherwise):

LC Conditions

LC System:

ACQUITY UPLC H-Class Bio System with 30 cm Column Heater

Detection:

ACQUITY UPLC TUV Detector with 5mm Titanium flow cell

Settings:

280 nm, 1 Hz sampling rate ACQUITY ELSD Detector

Settings:

Gain = 500,

Data Rate = 20 pps,

Time Cont. = Fast,

Gas Pressure = 40.0 psi,

Nebulizer Heating at 10% Power Level, Drift Tube Temp. 50 ˚C

Columns:

Waters ACQUITY UPLC PrST SEC Column, 450Å, 2.5 μm, 4.6 x 150 mm (p/n 176002996)

Waters ACQUITY UPLC PrST SEC Column, 200Å, 1.7 μm, 4.6 x 150 mm (p/n 186005225)

Waters ACQUITY UPLC PrST C4 Column, 300Å, 1.7 μm, 2.1 x 50 mm (p/n 186004495)

Column Temp.:

SEC=40 ˚C; RPC=90 ˚C

Sample Temp.:

10 °C

Injection Volume:

SEC = 10 μL; C4 = 5 μL (unless otherwise specified)

Flow Rate:

SEC = 0.4 mL/min, C4 = 0.5 mL/min

Mobile Phases:

SEC = 200 mM ammonium formate, 5% ACN; C4 = Water (A)/ACN(B), 0.1% (v/v) TFA

Sample Vials:

Deactivated Clear Glass 12 x 32 mm Screw Neck Total Recovery Vial, with Cap and Preslit PTFE/ Silicone Septa, 1 mL (p/n 186000385DV)

SEC=Isocratic
C4=Gradient

Gradient:

Time

%A

%B

Initial

95

5

1

95

5

16

5

95

17

5

95

20

95

5

25

95

5

Data Management

Chromatography Software: Waters Empower Pro (v2, FR 5)

Results and Discussion

SE-UPLC

The use of both BEH200 (200Å pore-size) and BEH450 (450Å pore-size) SE-UPLC columns (150 mm lengths) in series was selected for this evaluation due to the extended MW weight range that this combination of columns can provide.6 Proprietary samples were obtained from a collaborator and consisted of a 50 KDa molecular weight protein, a 40 KDa aPEG and the PEG-Protein conjugate. A volatile mobile phase comprised of 200 mM ammonium formate and 5% (v/v) acetonitrile was selected for these analyses. This buffer composition provided optimal separation of the active-PEG and conjugate critical pair and this volatile buffer could also be used if an evaporative light scattering detector (ELSD), which would provide improved sensitivity for the aPEG component in contrast to UV absorbance, was to be used. The 40 KDa aPEG used in this study has a broad and weak UV absorbance with a maximum at approximately 300 nm; therefore, for this study the UV absorbance at 280 nm provided adequate sensitivity for the high aPEG sample loads that were evaluated. The full-scale chromatograms of the conjugate, the 50 KDa protein, and the 40 KDa activated PEG are shown in Figure 1. Additionally, shown in Figure 2 is an overlay of the chromatograms of the aPEG and conjugate. Based on the chromatograms of these three samples, the SEC method provides useful resolution between the conjugated and the unconjugated protein, however, the separation between the conjugate and the aPEG is clearly not adequate for quantitation of a low level aPEG species in the presence of the predominant conjugate species.

Figure 1. SE-UPLC UV traces (280 nm) for the 50 KDa PEGylated protein (black), the 50 KDa protein (blue), and the activated 40 KDa PEG (green).
Figure 2. Overlaid SE-UPLC UV traces (280 nm) for the 50 KDa PEGylated protein (brown) and the activated PEG (blue).

These results demonstrate that achieving an SEC-based separation for the quantitation of PEGylated protein and the free aPEG forms may not be achievable in some cases. This can be due to a number of factors including the polydispersity of the aPEG, which will broaden its elution profile as well as that of the PEG-protein conjugate. Additionally, the nature of the interaction between the bound PEG and the surface of the protein may greatly limit the utility of a size-based separation. Ultimately, the critical factors that dictate the success of an SEC separation are the hydrodynamic viscosity radii (Rh) distributions of the aPEG, protein, and the conjugate. These Rh values can be empirically approximated using the relationships proposed in the work of Fee and Van Alstine.7, 8 Based on these relationships the Rh of PEG is typically much greater than that of a protein at a given molecular weight. Typically the ratio of the Rh values for two components should be approximately 1.26 or greater, or the inverse which is 0.79 or smaller, in order to resolve those components by SEC.8 For globular proteins, this corresponds to a 2-fold increase in MW (Rh ∝ MW1/3). Using these theoretical relationships, it is it is clear to see that to develop a size-based separation that can resolve the non-PEGylated protein, the aPEG, and the conjugate from a mixture will be challenging. Shown in Table 1 are the predicted Rh ratios for various combinations of MW for these three components. Based on these predicted values covering a broad range of protein and PEG MW, there are only three combinations of components that would be predicted to have all three components resolve by SEC. The prediction for the 50 KDa protein and 40 KDa aPEG used in this study confirms what was observed experimentally where adequate resolution was achieved between the protein and the both the aPEG and the conjugate. However, the Rh ratio between the conjugate and the aPEG is well below 1.26 (1.07), which is in agreement with the insufficient resolution observed between those two species.

Table 1. Predicted ratios of the hydrodynamic viscosity radii for several PEG (Rh, PEG ), proteins (Rh, pro ), and their conjugate forms (Rh, pro+PEG ). Ratio values of 1.26 or greater and 0.79 or less (green) indicate that adequate analytical separation between those species by SEC is predicted. Rh values between 0.79 and 1.26 (blue) predict that analytical resolution of the two compounds is not expected. The MW values of the protein and aPEG are highlighted in green for combinations for which resolution of all three components is predicted.

It should be noted that the predicted Rh ratios contained in Table 1 are approximations and that the possibility of successfully separating different species lessens as their Rh ratio approaches a value of 1.0. However, successful SEC separations could be obtained for species with borderline Rh ratios and such analyses may warrant experimental investigation. It is also worth noting that in cases where resolution of only two of the three components is required, such as in applications designed to quantitate the levels of the non-PEGylated protein and PEGylated protein a useful SEC separation is predicted (Column Rh,pro+PEG / Rh,pro in Table 1) for all but the largest proteins with the lowest MW 5 KDa PEGylation.

RP-UPLC

As an alternative to SEC, and with the understanding that PEGylation may likely have a profound effect on protein hydrophobicity, RP-UPLC using a C4-bonded stationary phase was evaluated for the separation of the non-PEGylated protein, aPEG, and conjugate mixture. For this analysis, an ELSD was used in series after the UV detector to aid in the characterization of the observed peaks and to provide greater sensitivity for the unreacted PEG. A column temperature of 90 ˚C was selected for this separation to maximize sample recovery and peak shape quality. An overlay of the chromatograms obtained for the three components is presented in Figure 3. Under these conditions, the selectivity and peak widths obtained resulted in excellent resolution between the three analytes. Shown in Figure 4 is an overlay of the ELSD and TUV (A280) traces for the conjugated sample. In the ELSD trace (black), a low level (nominally 5%) aPEG peak is observed as well a low level unmodified protein peak (nominally 3.4%). The values determined by ELSD are relative as the response is not linear and is dependent on the nature of the analyte and the mobile phase composition. As a result, the level of unmodified protein based on the measured A280 peak areas is significantly higher (13.1%). However, the low level of free aPEG in the sample was below the limit of detection by UV absorbance. Consequently, the use of both detectors in series is essential in order to effectively monitor the levels of all three components in a single analysis.

Figure 3. Overlay of the C4 RP-UPLC ELSD traces for the 50 KDa PEGylated protein (black), the 50 KDa protein (green), and the activated 40KDa PEG (brown).
Figure 4. Normalized overlay of the ELSD (black) and 280 nm UV absorbance (blue) chromatograms for the 50 KDa PEGylated protein separated using a RP-UPLC BEH300 C4 column.

Conclusion

SE-UPLC can provide rapid analysis of the products and unreacted components of a protein PEGylation reaction if the Rh values for the non-PEGylated protein, aPEG, and conjugate are sufficiently different. Based on predictions of the Rh values for combinations of protein and PEG molecular weights, in many circumstances SE-UPLC cannot provide the necessary analytical separation of all three components. This was indeed the case for this application where the model correctly predicted that the 40 KDa PEG and PEGylated 50 KDa protein Rh values were not significantly different to enable their separation by SE-UPLC. However, in many instances, SE-UPLC can be used to separate the modified and unmodified protein components of the sample, particularly for samples where large MW PEG (20 and 40 KDa) are being used. By comparison, for this specific application it was found that all the three components were well separated based on differences in their hydrophobicities using a 300Å BEH column at high temperature (90 ˚C). Additionally, the use both a UV and an ELSD detector in series may be used to for their quantitation.

References

  1. Banerjee SS, Aher N, Patil R, Khandare J. Poly (ethylene glycol)-Prodrug Conjugates: Concept, Design, and Applications. Journal of Drug Delivery. 2012; 2012.
  2. Armstrong JK, Hempel G, Koling S, Chan LS, Fisher T, Meiselman HJ, et al. Antibody against poly(ethylene glycol) adversely affects PEG-asparaginase therapy in acute lymphoblastic leukemia patients. Cancer. 2007; 110:103-11.
  3. Garay R, Labaune J, editors. Immunogenicity of polyethylene glycol (PEG). The Open Conference Proceedings Journal; 2011.
  4. Fee CJ, VAN ALSTINE JAM. Purification of pegylated proteins. Protein Purification: Principles, High Resolution Methods, and Applications. 2011; 149:339.
  5. Li N, Ziegemeier D, Bass L, Wang W. Quantitation of free polyethylene glycol in PEGylated protein conjugate by size exclusion HPLC with refractive index (RI) detection. J Pharm Biomed Anal. 2008; 48:1338.
  6. Koza S, Lauber, M., and Fountain, K.J. . The Analysis of Multimeric Monoclonal Antibody Aggregates. Waters Application Note. 2013; 720004713EN
  7. Fee CJ, Van Alstine JM. Prediction of the viscosity radius and the size exclusion chromatography behavior of PEGylated proteins. Bioconjug Chem. 2004; 15:1304-13.
  8. Fee CJ, Van Alstine JM. PEG-proteins: Reaction engineering and separation issues. Chemical engineering science. 2006; 61:924-39.

720004782, April 2014

返回顶部 返回顶部