• 应用纪要

A Sensitive Method for the Estimation of Scopolamine in Human Plasma Using ACQUITY UPLC and Xevo TQ-S

A Sensitive Method for the Estimation of Scopolamine in Human Plasma Using ACQUITY UPLC and Xevo TQ-S

  • P. Veeranjaneyulu
  • Tirupateswara Rao Boyidi
  • Sudarshan Mantha
  • Gopal Vaidyanathan
  • Waters Corporation

Abstract

The world of regulated bioanalysis faces several hallenges, such as the ability to achieve the hghest sensitivity for drug candidates, develop robust assays that meet high throughput requirements, meet regulatory requirements, address upcoming analytical demands, and also ensure instrument up-time while reducing cost per sample. This application note demonstrates the benefits of Waters Oasis Micro-Elution Plates for the extraction of compounds, ACQUITY UPLC Technology, and Xevo TQ-S in addressing some important challenges in bioanalysis, such as achieving the desired sensitivity in LC-MS assays while maintaining high throughput value, reproducibility, and robustness.

Benefits

  • The analytical options used in this application note can help the bioanalytical scientist to address several challenges faced in low level quantification of scopolamine.
  • The method developed here produced a robust, reproducible assay while addressing any regulatory concerns.

Introduction

Scopolamine is an anticholinergic alkaloid with medical applications in very minute doses, given in the form of Transdermal Patches.1 It is also used in the treatment of addiction-related disorders.2 Scopolamine is used to relieve nausea, vomiting, and dizziness associated with motion sickness and recovery from anesthesia and surgery. Scopolamine may also be used in the treatment of Parkinsons disease, spastic muscle states, irritable bowel syndrome, diverticulitis, and other conditions.

Figure 1. Molecular structure of scopolamine.

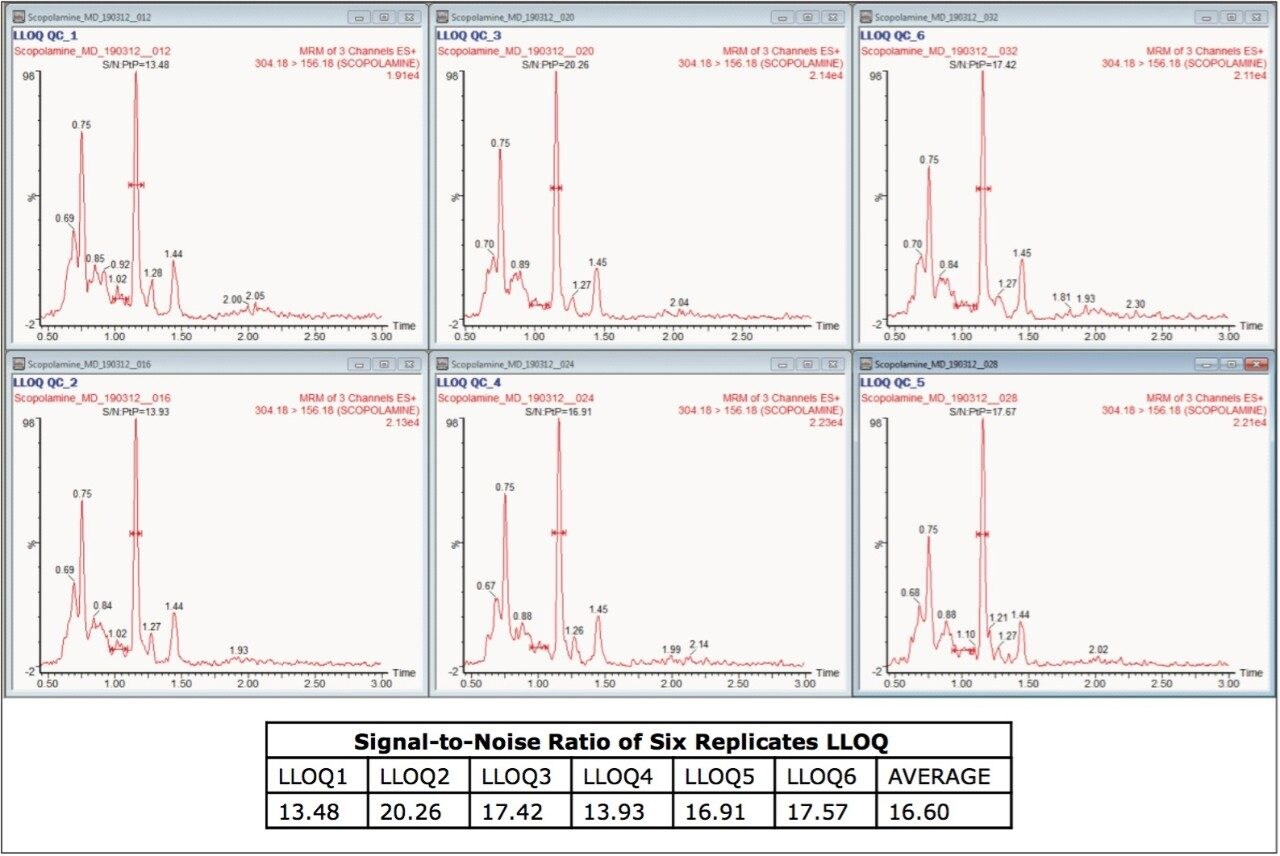
The analysis of tropane alkaloids has been studied using different instrumental techniques, including atomic emission spectrometry (AES), atomic absorption spectrometry (AAS), UV spectroscopy, enzyme-linked immunosorbent assay (ELISA), gas chromatography (GC), gas chromatography-mass spectrometry (GC-MS), quantitative thin-layer chromatography (TLC), high performance thin-layer chromatography-densitomery (HPTLC-densitometry), capillary electrophoresis (CE), micellar electrokinetic chromatography-mass spectrometry (MEKC-MS), and reversed-phase liquid chromatography (RP-LC). In addition, pharmacokinetic studies have been based on gas chromatography-mass spectrometry (GC-MS). Use of these methods requires 1 to 4 mL of plasma sample and complicated sample preparation, such as employing micro-dialysis3 to achieve required sensitivity levels. This application note uses a micro-elution method of Solid Phase Extraction (SPE), which simplifies the analysis and quantification of scopolamine with an LLOQ of 5 pg/mL. Such a highly sensitive LC-MS method and hence LLOQ was achieved with the components of Waters Regulated Bioanalysis System Solution and also without any of the complicated procedures mentioned above.

The spiked plasma samples were isolated using solid phase extraction employing Oasis HLB Micro-Elution Plates. A 400-μL aliquot of plasma was diluted with 200-μL diluted formic acid, and loaded onto the SPE micro-elution plate, which was previously conditioned with organic solvent and water. The bed was washed with water followed by an organo-aqueous solution, then eluted with organic solvent. The eluted samples were diluted with Milli-Q water, vortexed, and injected onto the system.

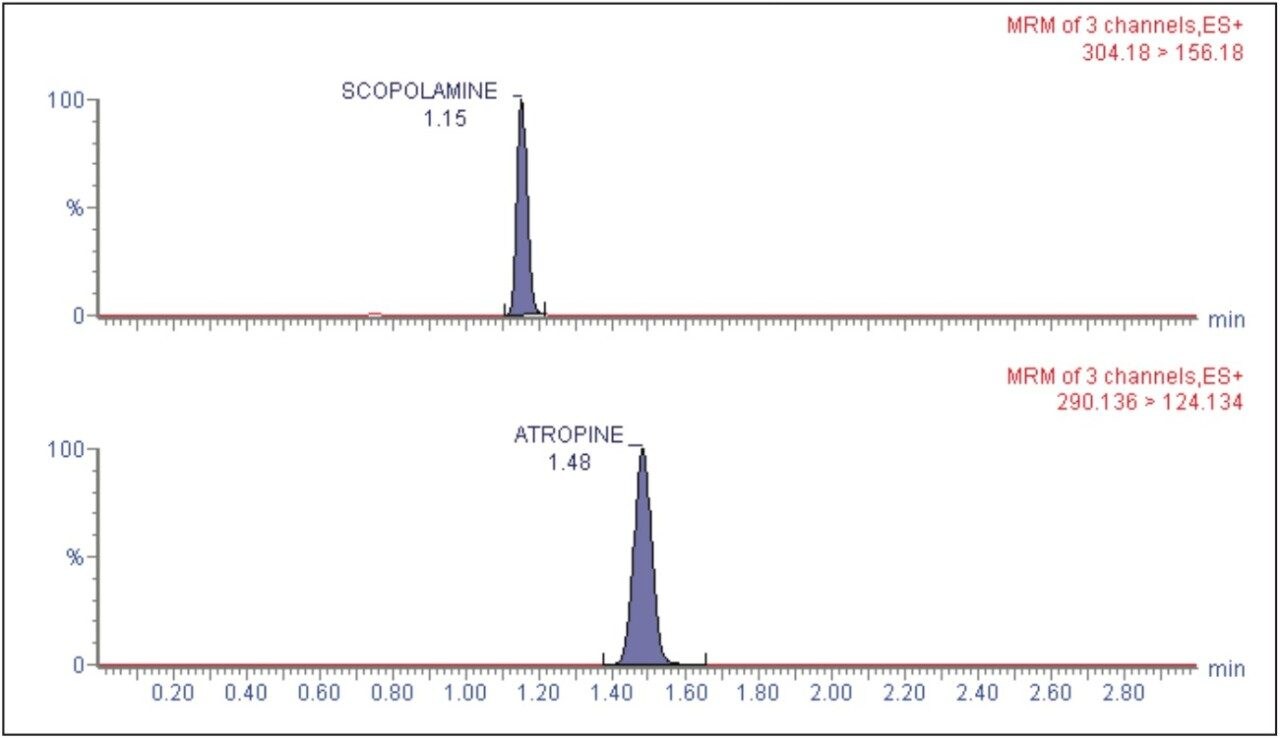
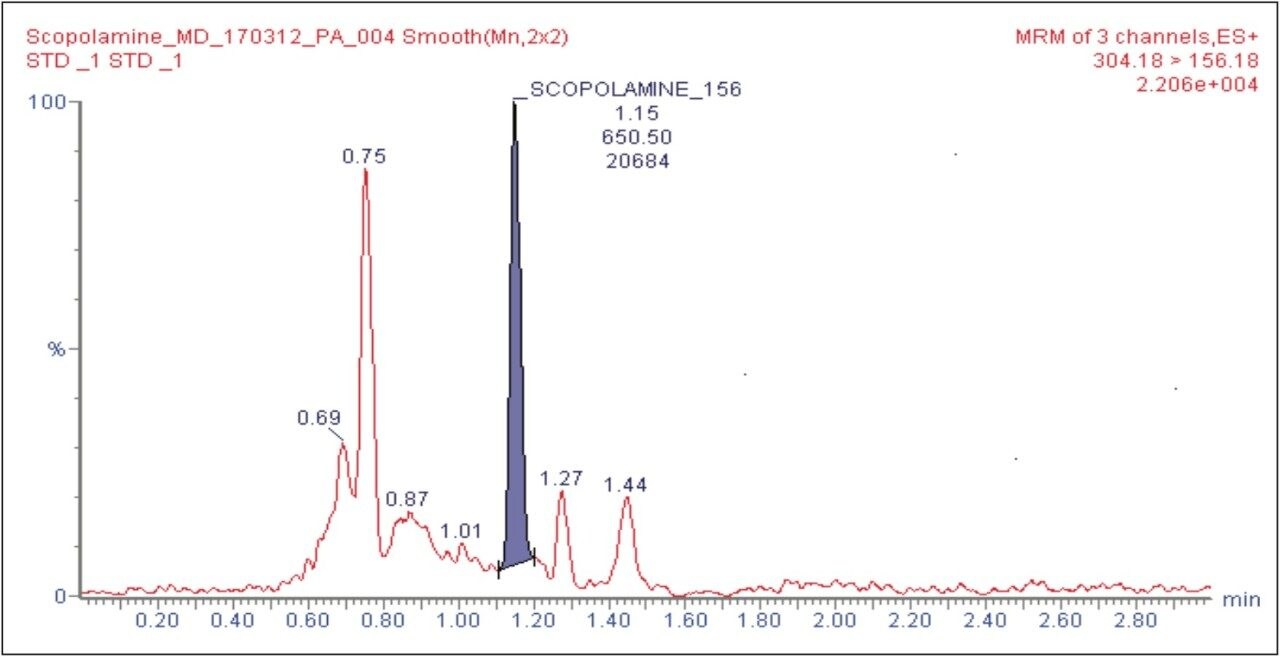
The extracted samples were analyzed by reversed phase gradient chromatography employing an acidic aqueous buffer and acetonitrile as the organic modifier.

Experimental

LC conditions

LC System:

ACQUITY UPLC

Column:

ACQUITY UPLC CSH C18 2.1 x 50 mm 1.7μm

Column temp.:

30 °C

Injection volume:

2 μL

MS conditions

MS system:

Xevo TQ-S

MS mode:

positive ion electrospray

MRM transition:

304.18 → 156.18

Atropine (M.W. 289.37), which is a tropane alkaloid, was used as an internal standard (IS).

Results and Discussion

The target analyte (scopolamine) and internal standard (atropine) were eluted at retention times of 1.15 and 1.48 mins, respectively, as shown in Figure 2. The chromatogram of scopolamine at the LLOQ concentration of 5 pg/mL was found to exhibit a signal-to-noise (S/N) ratio of 17 (for an average of six replicates), as shown in Figure 3, as compared to its corresponding blank chromatogram, shown in Figure 4. Furthermore, the LC-MS/MS chromatogram of scopolamine in the extracted LLOQ, shown in Figure 5 demonstrated excellent sensitivity and was resolved from possible co-eluting endogenous components arising from plasma.

Figure 2. LC-MS/MS chromatogram of scopolamine and atropine (IS) with retention times of 1.15 and 1.48 mins, respectively.
Figure 3. LC-MS/MS chromatogram of 5 pg/mL of scopolamine exhibiting a S/N ratio of about 17.
Figure 4. LC-MS/MS chromatogram of extracted blank.
Figure 5. LC-MS/MS chromatogram of an extracted LLOQ.

The LC-MS/MS method for scopolamine developed in this application note delivered a linear calibration response over the range of 5 to 640 pg/mL, with a correlation coefficient of 0.998, shown in Table 1. Table 1 also shows the back-calculated concentrations of the standards (column titled “Conc”). Table 1 and Figure 6 show that the values obtained for the original and back-calculated concentrations were similar. The percent (%) recovery data was also in very good agreement within the standards at different concentrations, shown in Table 1 and Figure 7.

Table 1. Linearity results for scopolamine from 5 to 640 pg/mL. An injection volume of 2 μL was used for all samples, where scopolamine and atropine (IS) showed a retention time of 1.15 and 1.48 min, respectively.
Figure 6. Comparison of original and back-calculated concentrations of scopolamine standards.
Figure 7. Percent (%) recovery for scopolamine standards.

Table 2 demonstrates the precision and accuracy for QC global studies, with four different batches of samples at four different concentration levels: LLOQQC, LQC, MQC, and HQC. The data shown in Table 2, suggest that the standard deviation within the data for all four different batches and in four different concentration levels were well within the permissible limits (± 20% LLOQ and ± 15% at LQC, MQC, and HQC levels). Such results exhibit the excellent linearity and precision of the method that was developed using the Regulated Bioanalysis System Solution.

Table 2. QC global results for scopolamine performed in four batches and at four different concentration levels (LLOQQC, LQC, MQC, and HQC).

Conclusion

This application note reports determination and quantification of scopolamine with an unforeseen LLOQ. A high sensitivity LC-MS/MS assay for the quantification of scopolamine in plasma was developed with an LLOQ of 5 pg/mL. The assay was shown to be linear over the range of 5 to 640 pg/mL. The high sensitivity and linearity of the method can be attributed to the extraction specificity of the Oasis HLB Micro-Elution Plates, the high resolution of the ACQUITY UPLC System, and the sensitivity of\ the Xevo TQ-S Mass Spectrometer. The analytical options used in this application note can help the bioanalytical scientist to address several challenges faced in low level quantification of scopolamine. In addition to addressing sensitivity challenges, the method developed here also produced a robust, reproducible assay while addressing any regulatory concerns.

References

  1. P F White ,J Tang , D Song et al. Transdermal Scopolamine: An Alternative to Ondansetron and Droperidol for the Prevention of Postoperative and Postdischarge Emetic Symptoms. Anesthesia and Analgesia. 2007, 104 (1): 92–96. doi:10.1213/01.ane.0000250364.91567.72. PMID 17179250. http://www.anesthesia-analgesia.org/cgi/pmidlookup?view=long&pm id=17179250.
  2. E C Pearce. Pearce’s Medical and Nursing Dictionary and Encyclopaedia. Faber & Faber, 1941.
  3. Mahboubeh Masrournia, Zarrin Es’haghi, Mostafa Amini. Liquid Chromatographic Determination of Scopolamine in Hair with Suspended Drop Liquid Phase Microextraction Technique. American Journal of Analytical Chemistry. 2011, 2, 235-242.

720004411, June 2012

返回顶部 返回顶部