Detector Cell Considerations in Using, Scaling, and Evaluating Large Scale Chromatography at High Flow Rates
Abstract
Benefits
Introduction
The purification of compounds at high concentration and at high flow rate makes judging chromatographic resolution difficult as an isolation increases in scale. As more material is loaded onto a column, the representation of the resolution is either compromised or lost completely. The chromatogram shows rounded or flat peak tops because they exceed the range of the detector scale. This leads to many fractions being collected and analyzed, often with low purity and poor recovery. In addition, high flow rates used in large scale chromatography create pressure on the detector flow cell. The high pressure can break the cell.
The resolution, efficiency, and recovery of a preparative separation should be maximized while maintaining the detector’s dynamic range and flow rate compatibility. Flow cells do not change the chromatography, but they do impact how we observe the chromatographic results of an isolation. Several options are compared for accurately monitoring a separation at high flow rate and mass load.
Experimental
Four solutions are proposed for monitoring a separation at high flow rate and mass load. Each solution is illustrated using a standard chemical mixture at both the small pilot and preparative scales:
- Analytical flow cell with a custom splitter
- Semi-prep flow cell
- AutoPurification™ flow cell
- Analytical flow cell with split and dilute technique
Instrumentation
|
LC system: |
Waters 2525 Binary Gradient Module, 2767 Sample Manager, Column Fluidics Organizer, 2996 Photodiode Array Detector, ZQ™ Mass Spectrometer |
|
Column: |
XBridge™ Prep OBD™ C18 Column 19 x 50 mm, 5 μm (p/n: 186002977) |
|
Flow rate: |
25 mL/min |
|
Mobile phase A: |
0.1% Formic acid in water |
|
Mobile phase B: |
0.1% Formic acid in acetonitrile |
|
Gradient: |
5–30% B in 5 min, 280 nm |
|
Sample mixture: |
Sulfamethizole, 70 mg/mL Sulfamethoxazole, 70 mg/mL Sulfisoxazole, 70 mg/mL |
Results and Discussion
Detector with a Custom Splitter
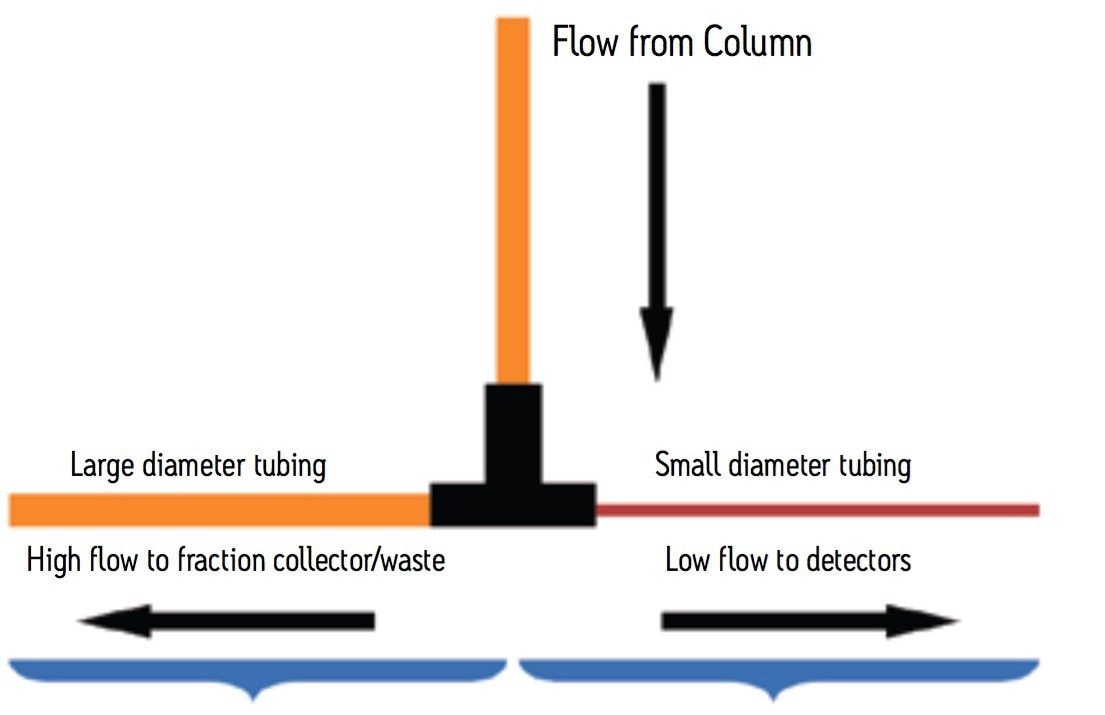
Monitoring isolation experiments exceeds the flow limit of an analytical flow cell, usually 2–10 mL/min, depending on the model or brand of the detector. A passive splitter is a simple device that directs a small amount of effluent from the main prep stream to the detectors while sending the remainder of the effluent to the fraction collector or to waste. Once the splitter is made and flow tested, the split ratio will remain the same provided that the system plumbing after the splitter is not modified. A passive splitter ensures that the amount of flow going to the detector is within the acceptable flow rate range for the flow cell. The constant flow that passes into and out of the splitter is controlled by the length and diameter of the tubing making the device. As shown in Figure 1, small diameter tubing restricts flow and allows only a minor portion of the main effluent stream to enter the detector for analysis. Larger diameter tubing carries the remainder of the column effluent to the fraction collector or to waste. To make a flow splitter, the pressure on both sides of the split must be the same. The pressure is adjusted by varying the length and diameter of the tubing on the two sides of the split. The Waters Prep Calculator is a useful tool for estimating the required tubing dimensions.
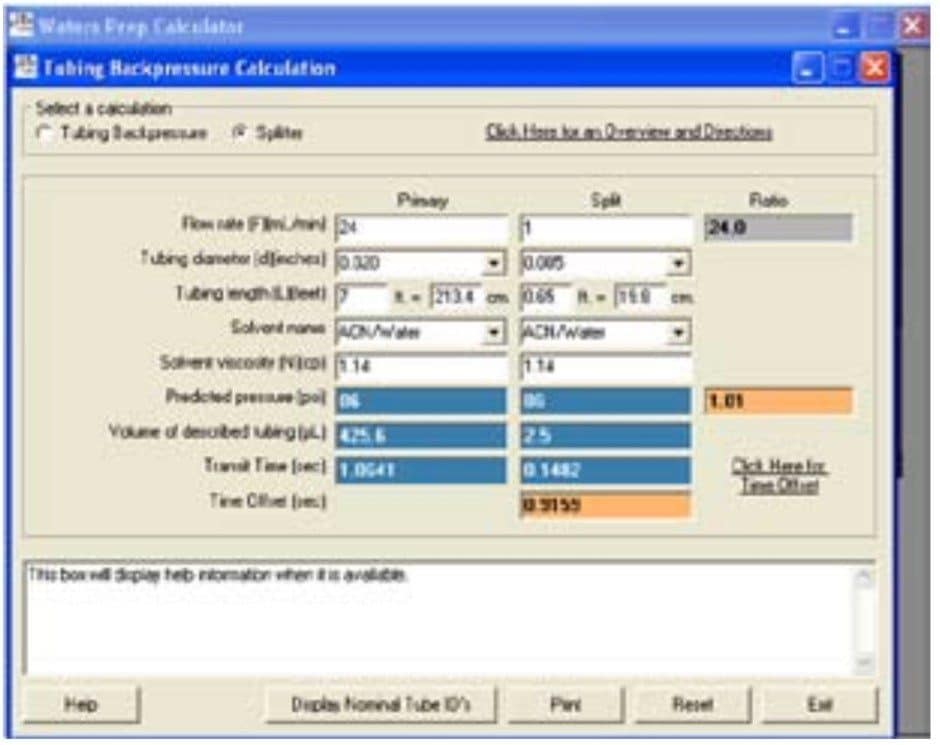
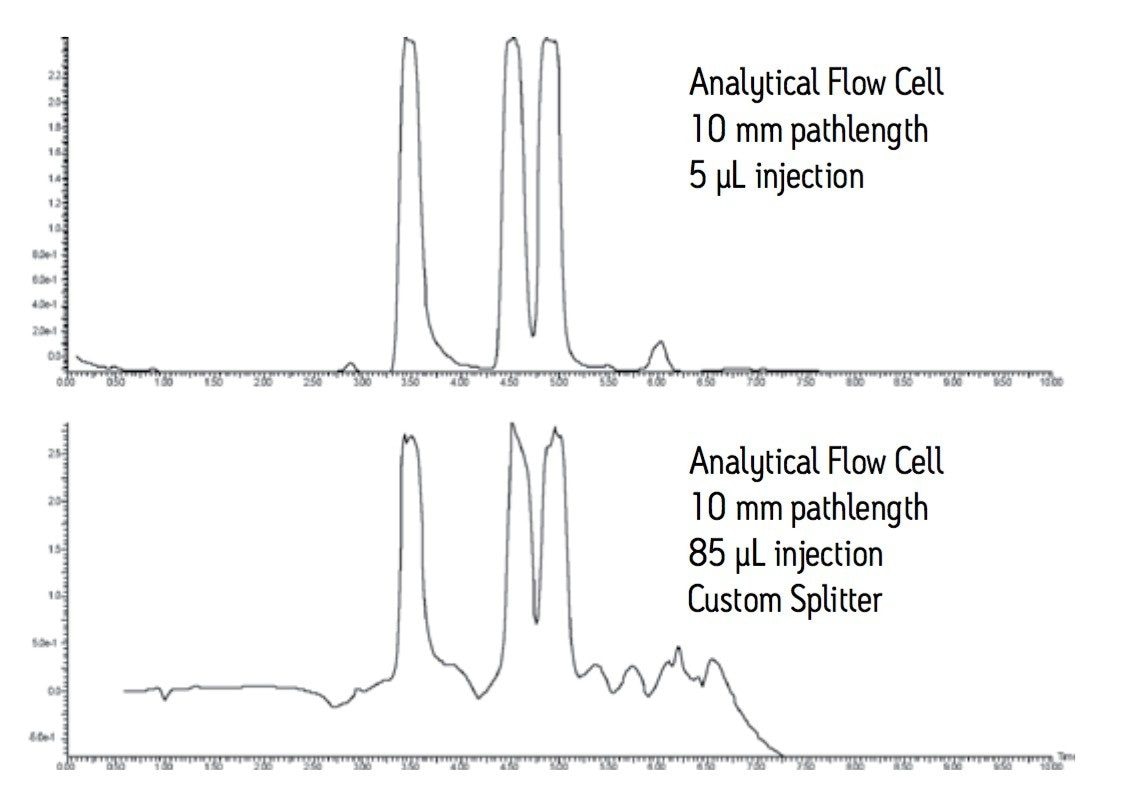
As shown in Figure 2, for a preparative separation with a flow rate of 25 mL/min, 1 mL is split from the main flow to go to the detector. The remaining 24 mL/min goes to the fraction collector. The tubing going to the fraction collector is 0.020” ID and 7 feet long. A piece of 0.005” ID tubing 19.8 cm long gives a predicted pressure of 86 psi equal to the predicted pressure of 86 psi for the primary side of the splitter. The concentration of the column effluent is the same on both sides of the splitter. In Figure 3, the chromatography observed at the large scale, run at 25 mL/ min with an 85 µL injection (bottom trace) is similar to the chromatography observed for the pilot scale, run at 1.46 mL/min with a 5 µL injection (top trace). Peak shapes and peak heights are comparable. The baseline in the large scale run is elevated due to the high concentration of the sample going to the detector and the long pathlength of the flow cell. Note that the concentration of the sample is the same for both traces, the amount of sample is the same, the separation is the same, but it is the representation of the chromatography that is different. Using a long pathlength cell to monitor a large scale separation serves only to allow high flow rates with an analytical flow cell if a short pathlength cell is not available. A longer pathlength flow cell would only be used if isolations are done infrequently. Better solutions for monitoring isolations include operating in the linear absorbance range of the detector or changing the analytical flow cell to a suitable preparative flow cell.
Detector with Semi-Prep Flow Cell
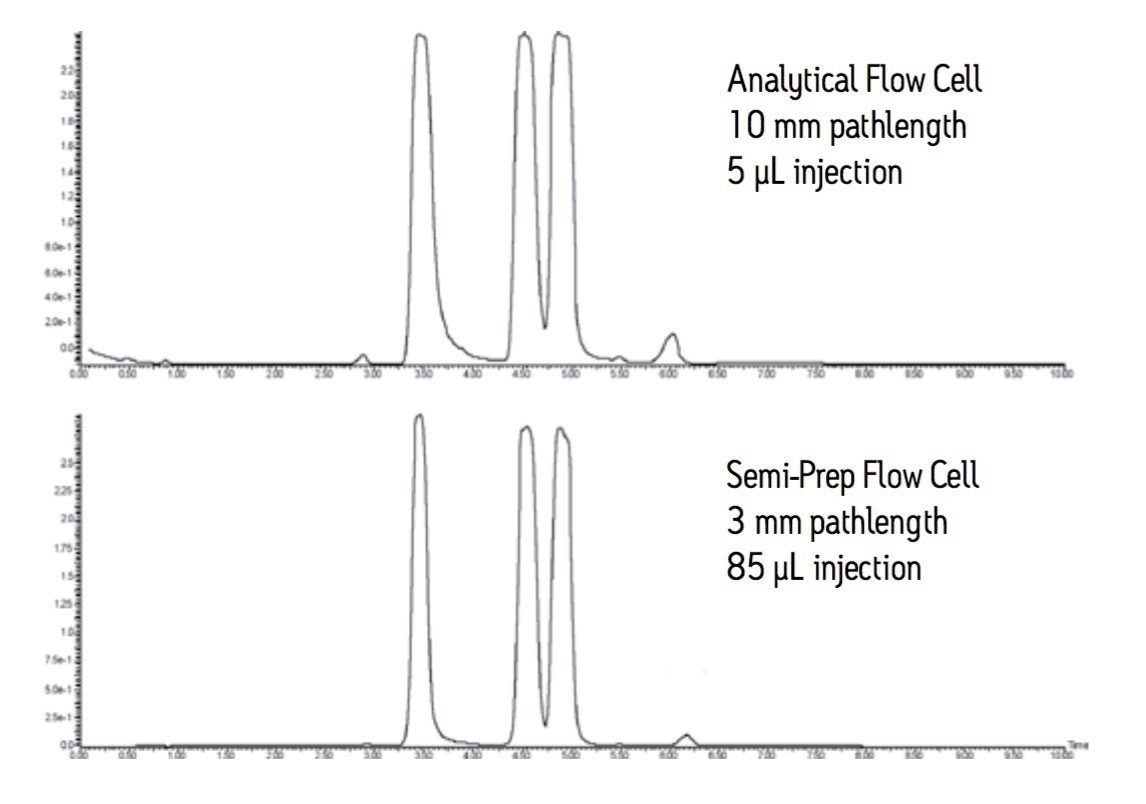
Semi-prep flow cells are detector cells that have a 3 mm pathlength and can accommodate flow rates up to about 300 mL/min. This flow cell addresses both high flow and off-scale response that is seen with longer pathlength cells. The chromatography shown in Figure 4 compares the three compound mixture injected at the pilot scale and then scaled to prep using the semi-prep flow cell in the detector. The shorter pathlength flow cell used at the large scale keeps the peaks on scale showing slightly better resolution between the second and third compounds. All three peaks are also slightly narrower. This chromatography clearly illustrates Beer’s Law, A=εbc, where ε is the molar absorptivity of the compound expressed in mole/liter, b is the pathlength expressed in cm, and c is the concentration of the solution. ε and c are constant, therefore, the absorbance changes with the pathlength.
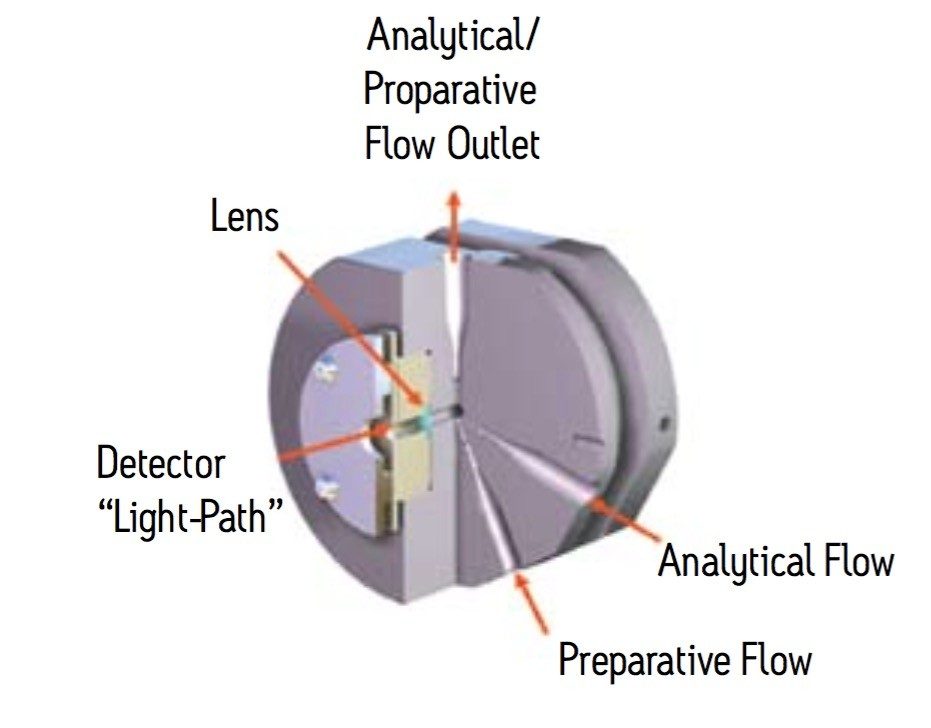
Detector with AutoPurification Flow Cell
The AutoPurification flow cell shown in Figure 5 is a short pathlength cell, specially designed by Waters, used to address both high flow and off-scale response that is seen with longer pathlength cells. The AutoPurification cell designed for the photodiode array detector has two inlets, a 0.009” ID tubing small scale inlet and a larger 0.020” ID tubing large scale inlet. The common outlet tubing is 0.040” in diameter. The 0.5 mm pathlength flow cell is short enough to ensure that concentrated prep samples remain on scale with excellent peak shape and resolution.
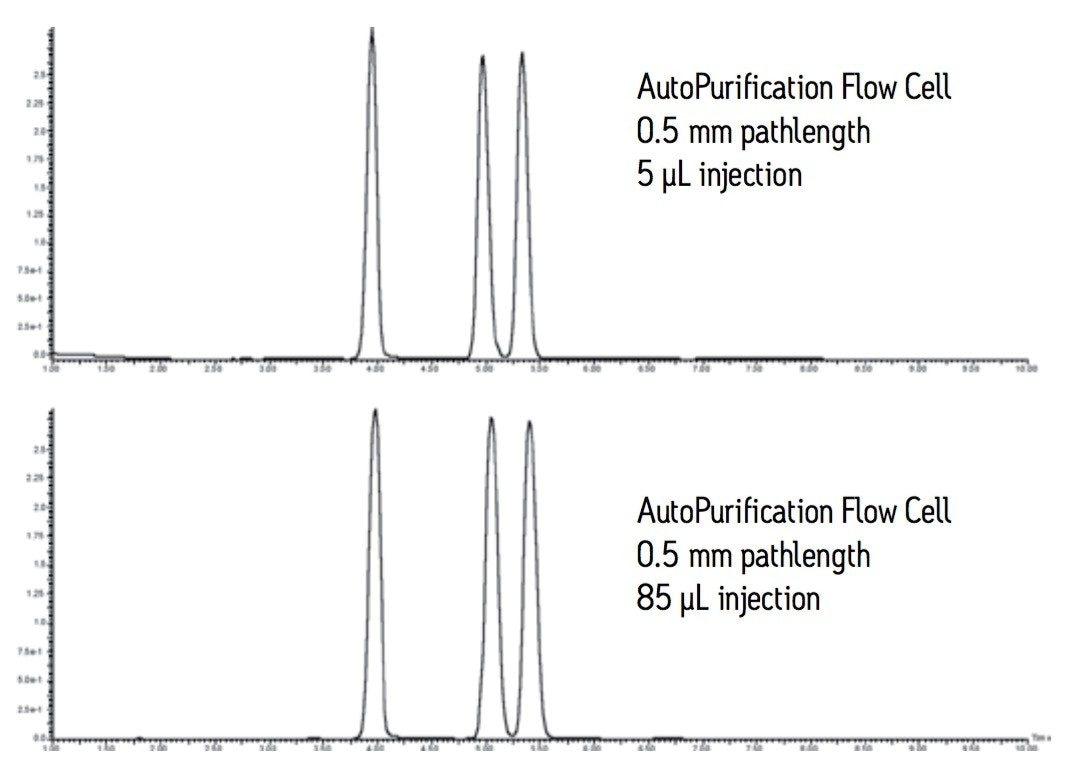
The pilot and large scale injections shown in Figure 6 are virtually identical. The peaks are sharp, narrow, and well resolved. Good resolution promotes improved purity and recovery of target compound.
Detector with Analytical Flow Cell and Split and Dilute
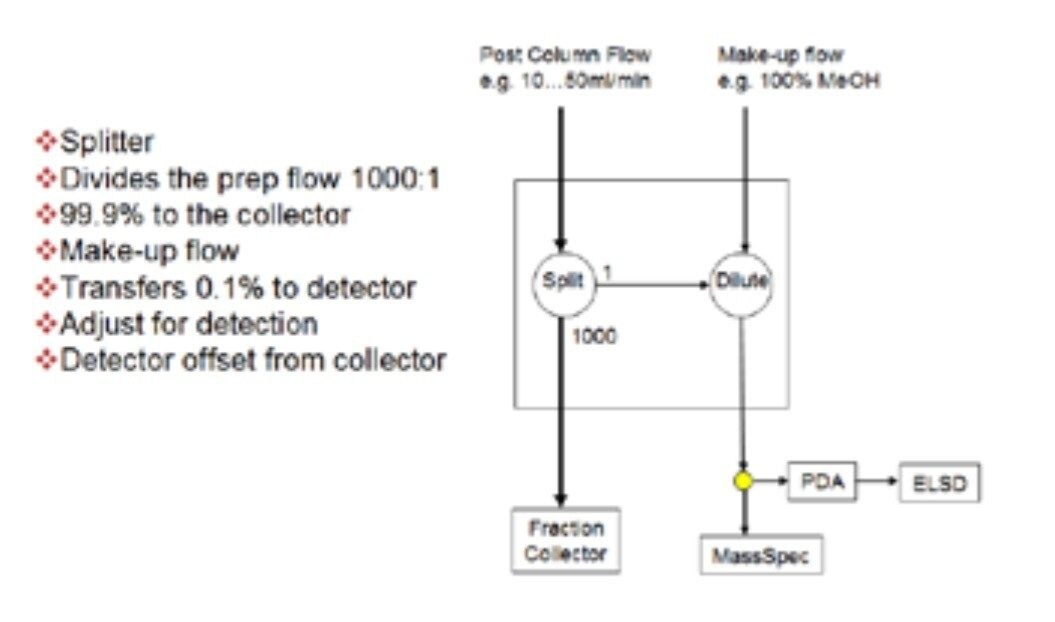
The split and dilute technique is an on-line passive flow splitting process that constantly samples the effluent stream, dilutes the sample taken from the stream with a makeup solvent, and then sends the diluted sample to the detector. Split and dilute can be used with any detector, but is required with destructive detectors, such as a mass detector or an evaporative light scattering detector. The technique helps to manage the chromatographic signal, keeping it on scale, preserving sample, and preventing fouling of the detector due to high sample concentration. As shown in Figure 7, a splitter placed in-line before the detectors effectively divides the prep flow 1000:1, sending 99.9% of the flow to the collector. A makeup pump delivering 1 mL/minute of makeup solvent transfers 0.1% of the flow to the detectors. Different flow splitters with different split ratios are available for use in systems running at higher or lower flow rates.
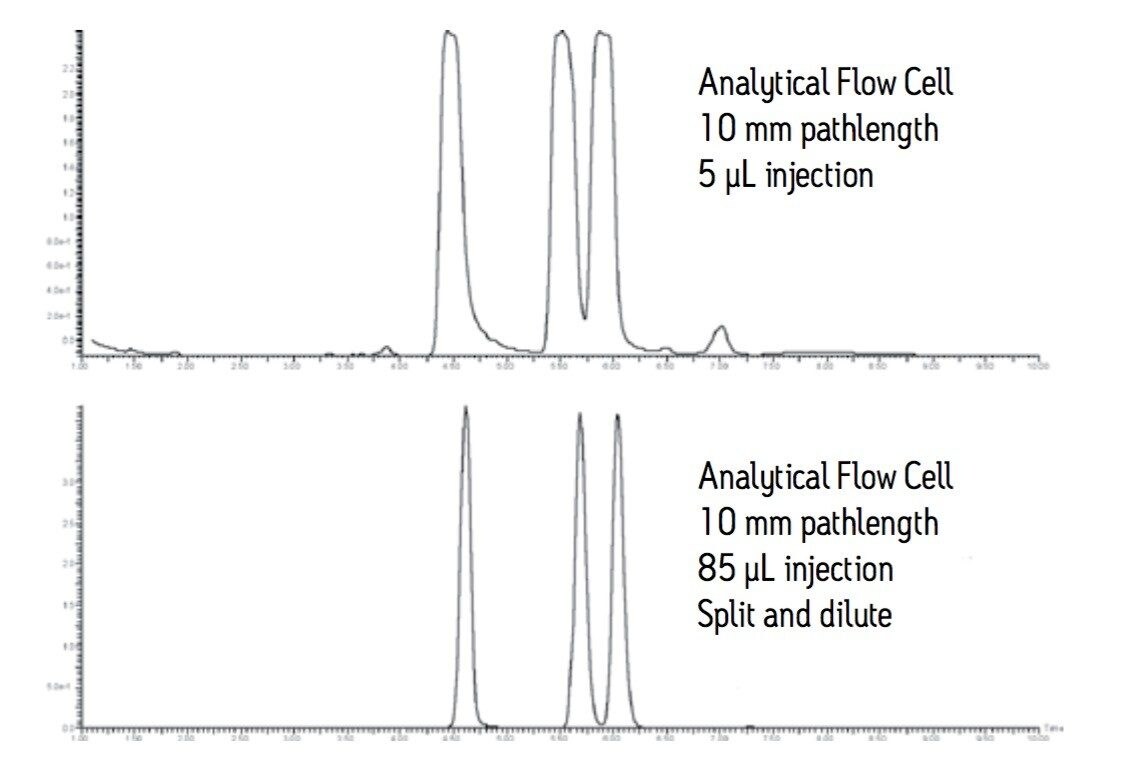
The resolution and peak shape in the bottom trace of Figure 8 illustrate the effectiveness of the split and dilute technique. The preparative scale peaks are narrower and sharper than the peaks obtained in the analytical pilot scale run.
We have shown four different options for managing the high flow rate and high detector response typical in purification experiments. A comparison of the four detection solutions illustrates the dramatic impact each has on the observed chromatogram where the actual separation is the same.
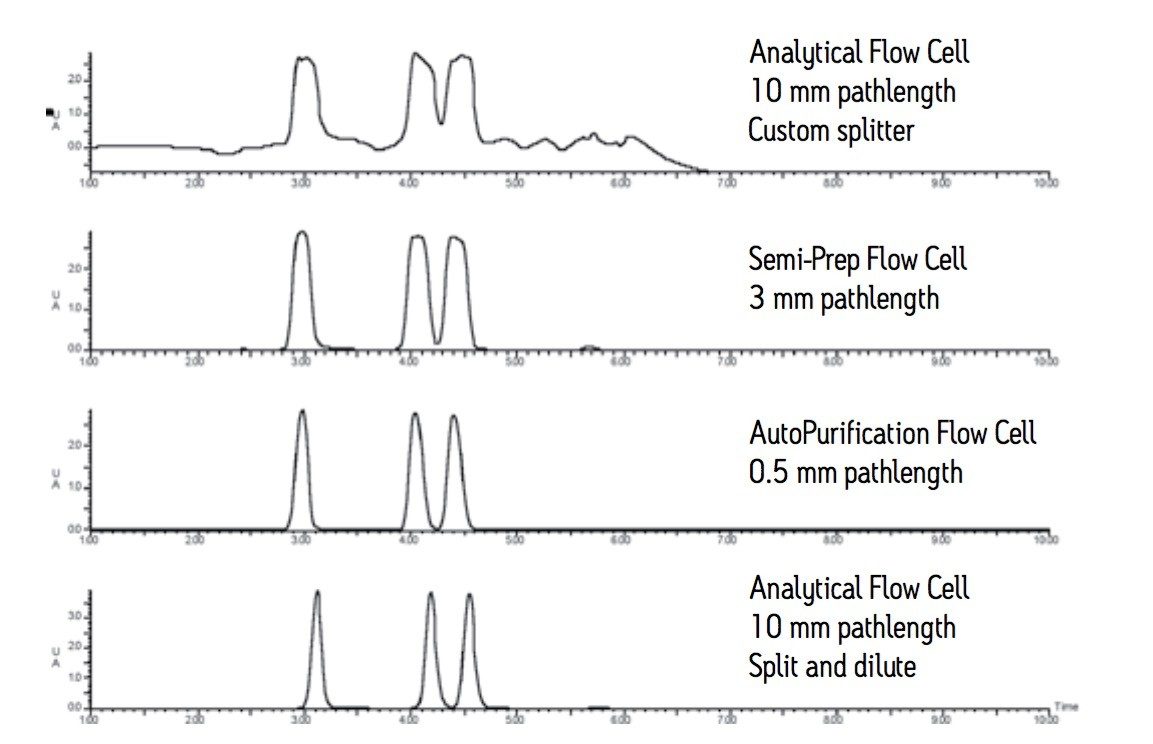
The analytical flow cell with the custom splitter allows the chromatographer to monitor a large scale separation at high flow rate. This option can be useful for those instances when a short pathlength flow cell is not available. The high sample concentration and the long 10 mm pathlength flow cell make isolation slightly more difficult due to the noisier baseline.
Semi-prep flow cells have a shorter 3 mm pathlength and improve the quality of the detector response, thus addressing both the high flow rates and high concentrations used in large scale isolations.
Changing from pilot scale separations to large scale separations requires removing the analytical flow cell and installing the semiprep flow cell.
The AutoPurification flow cell option provides a viable way to monitor both pilot scale and large scale isolations by managing both the high flow rate and high sample concentration. The short 0.5 mm pathlength used for both scales makes the large scale chromatography almost indistinguishable from the pilot scale chromatography. Peaks are narrow, sharp, and on-scale. The dual flow cell inlet accommodates both low and high flow rates.
The split and dilute technique is an on-line passive flow splitting process used with any very sensitive, destructive detector. The technique can be used with high flow rates and high sample concentrations. The detector signal is kept on scale, sample is preserved, and the detector is not fouled due to high sample concentration. Large scale chromatographic peaks are narrow, sharp, and well resolved.
Conclusion
The purification of compounds at high concentration and at high flow rate makes judging chromatographic resolution difficult as an isolation increases in scale. As the amount of material loaded onto the column increases, resolution is lost, peaks tops go off scale, and ultimately purity and recovery are compromised. High flow rate separations must meet the detector’s flow rate compatibility specification to avoid high pressure and flow cell breakage.
The feasibility and success of an isolation are impacted by detector influences in large scale chromatography. Although the detector does not change the chromatography of a separation, it does affect how we observe that chromatography. Four detection options have been tested with separation conditions, sample mixture, and injection volume kept constant. Short pathlength flow cells improve the apparent resolution and peak shape in preparative separations and keep the chromatography on scale. The split and dilute technique, used with destructive detectors, makes the quality of the chromatogram comparable to a UV-directed system outfitted with a 0.5 mm AutoPurification flow cell. A simple custom splitter can be useful for those instances when a short pathlength flow cell is not available. The dramatic effect that each solution offers to the purification scientist proves that the resolution, efficiency, and recovery of a separation can be maximized while maintaining the detector’s dynamic range and flow rate compatibility. Better representation of the chromatographic separation makes isolation of the target compound easier. A detector signal that accurately represents resolution ensures the collection of product in sufficient purity and concentration for subsequent experiments.
References
Featured Products
720002953, February 2009