• 应用纪要

MassFragment for Structural Elucidation in Metabolite ID using Exact Mass MS

MassFragment for Structural Elucidation in Metabolite ID using Exact Mass MS

  • Kate Yu
  • Jose M. Castro-Perez
  • John P. Shockcor
  • Waters Corporation

Abstract

This application note demonstrates the use of a UPLC-SYNAPT MS System employing the MSE strategy for metabolite identification. Using the TOF MSE, the LC-MS data from the low collision energy (CE) MS scan and high CE MS scan can be both obtained during a single UPLC injection1-2. The structural elucidation was easily performed with the aid of a software tool, MassFragment, by directly importing the fragment ions from raw data file or from the MetaboLynx Application Manager’s MSE Fragment Analysis window.

Benefits

Enhanced productivity with superior data

Introduction

Metabolite identification (Met ID) plays a crucial rule throughout the drug discovery and development process. The key analytical requirements for an effective Met ID study are: high chromatographic resolution with a fast turnaround time, metabolite identification with positive confirmation, and comprehensive structure elucidation.

Waters UltraPerformance LC (UPLC) technology has been gaining wide acceptance throughout the pharmaceutical industry since its first commercial instrument, the ACQUITY UPLC System, was introduced in 2004. The system’s ability to operate at 15,000 psi (1000 bar) backpressure enables the use of the sub-2 μm particle columns. The optimal linear velocity of this particle size extends far higher than that of the conventional 3 μm or 5 μm column packing. This higher linear velocity produces chromatographic separation with significantly enhanced resolution, speed, and sensitivity.

Waters SYNAPT MS TOF-based mass spectrometers are rapidly becoming the preferred analytical tool for Met ID studies. Its high full-scan sensitivity and exact mass measurement capability greatly enhance metabolite identification. In addition, the rich fragmentation information provided makes the task of localizing the site of biotransformation easier and more precise.

Finding metabolite “soft spots” is often a major bottleneck for the Met ID process. It is beneficial to have a tool that enables the scientist to take advantage of the information-rich data provided by the UPLC/Synapt MS system to rapidly find these soft spots.

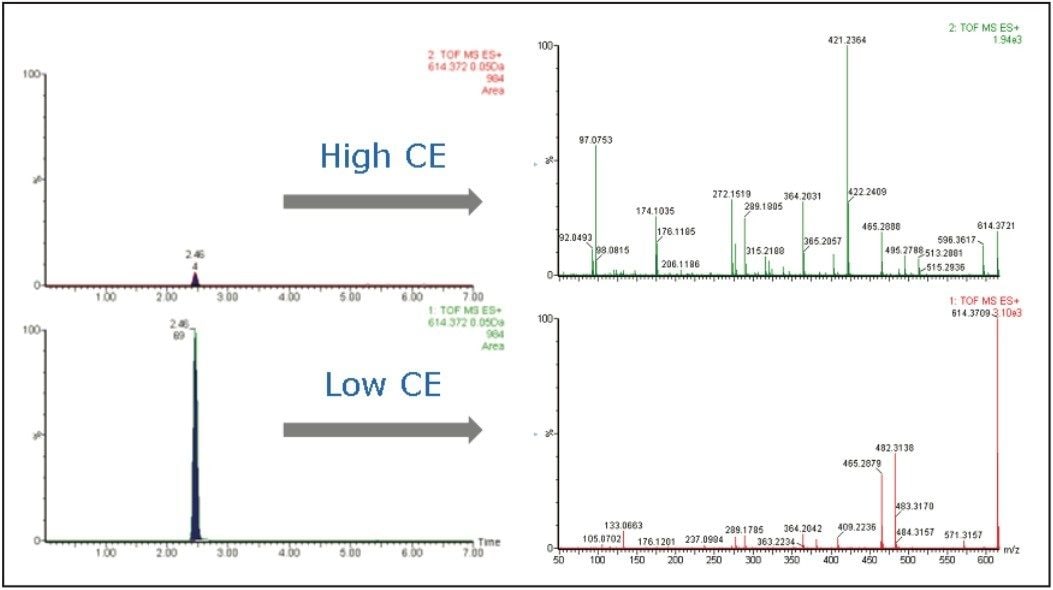
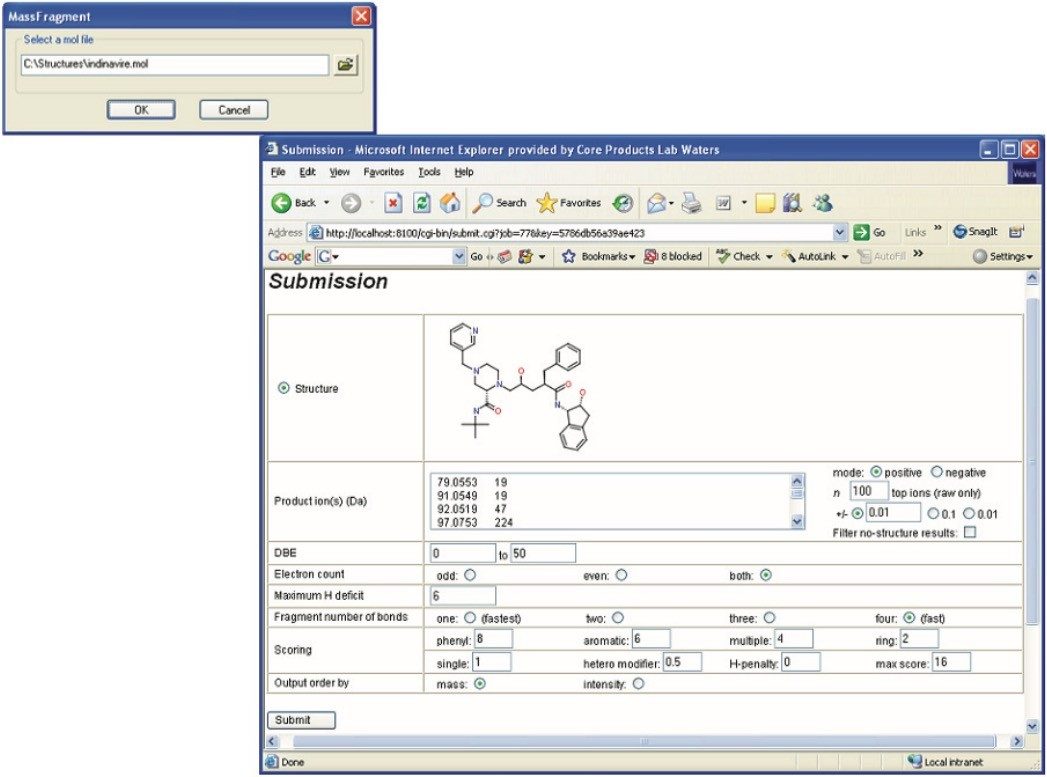
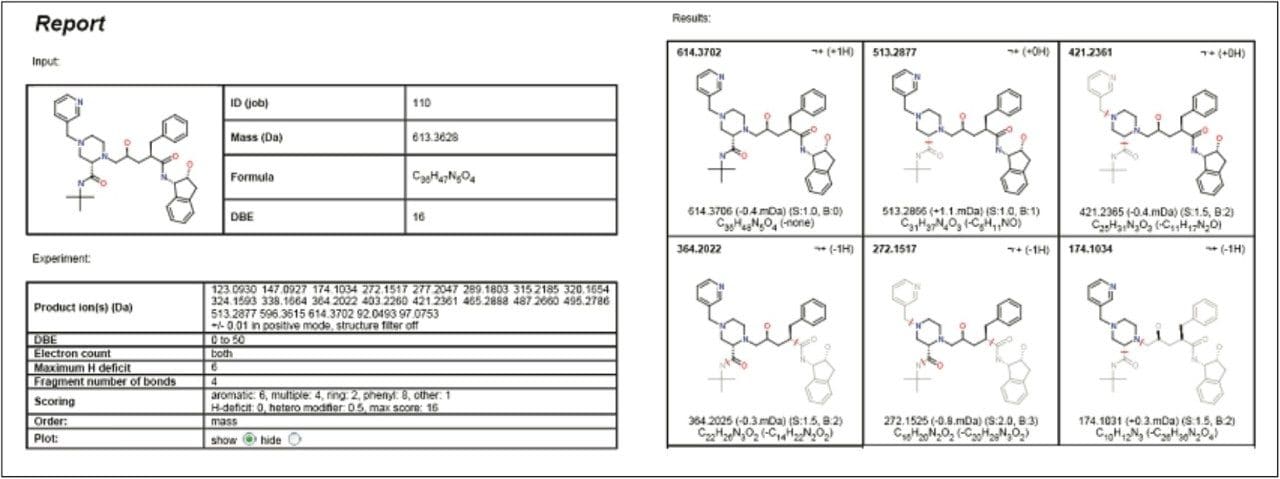
This application note demonstrates the use of a UPLC-SYNAPT MS system employing the MSE strategy for metabolite identification. Using the TOF MSE, the LC-MS data from the low collision energy (CE) MS scan and high CE MS scan can be both obtained during a single UPLC injection1-2. The structural elucidation was easily performed with the aid of a software tool, MassFragment, by directly importing the fragment ions from raw data file or from the MetaboLynx Application Manager’s MSE Fragment Analysis window.

Experimental

LC Conditions

LC system:

Waters ACQUITY UPLC System

Column:

ACQUITY UPLC HSS T3 Column 2.1 x 100 mm, 1.7 μm, 45 °C

Flow rate:

600 μL/min

Mobile phase A:

Water + 0.1% Formic Acid

Mobile phase B:

Acetonitrile

Gradient:

5% B to 95% B in 5 min, step to 100% and hold for 1 min

Run time:

8 min

Injection volume:

5 mL

MS Conditions

MS system:

Waters SYNAPT MS

Ionization mode:

ESI Positive in TOF mode

Capillary voltage:

3000 V

Desolvation temp.:

450 °C

Desolvation gas:

800 L/Hr

Source temp.:

120 °C

Acquisition range:

50 to 800 m/z

TOF MSE experiment

During an MSE experiment, the mass spectrometer (MS) acquires full scan data in two separate functions. The first function applies low collision energy (CE) such as 5 eV. The second function applies high CE. There are three possible ways to set up the high CE scan. The collision energy can be set at a fixed value (e.g. 35 eV), or as a ramp (e.g. 20 eV to 40 eV), or as a profile (e.g. 15 eV, 30 eV, 45 eV).

The raw data file contains two chromatogram traces, one for each acquisition function. Other more biased approaches, such as traditional data-dependant experiments, may also be carried out with the SYNAPT MS. However, MSE is an unbiased approach, which allows a much broader data coverage.

Results and Discussion

The data from the low CE MS acquisition typically offers parent ion information, while the data from the high CE MS scan offers fragment ion information. Figure 1 shows the comparison of the extracted ion chromatograms (XICs) and the MS spectra obtained from the two acquisitions during a single injection. The m/z 614 XIC at the low CE shows much higher intensity than that of the high CE spectrum. At higher CE, more fragmentation from the same parent ions occurred, resulting in the parent ion intensity being decreased.

Figure 1. Extracted ion chromatograms and MS spectra obtained from low and high CE scans.

Figure 2 shows the chemical structure of indinavir. This structure can be easily created with any chemical drawing software and should be saved as a .mol file that can be used by MassFragment during the elucidation step discussed in more detail later in this note.

Figure 2. Chemical structure of indinavir (C36H47N5O4, MW 613.3628).

Once the MSE data acquisition is complete, screening metabolites from the low CE data as well as the alignment of the fragment ion information from the high CE data is accomplished by the use of MetaboLynx, a MassLynx Software Application Manager. The MassFragment Software tool can be easily accessed from within MetaboLynx and helps to assign fragment ions displayed in the MSE window in MetaboLynx.

MassFragment is also accessible from the Spectrum window in MassLynx (Figure 3). Upon selecting MassFragment, the dialog window opens requesting user’s input of the parent drug .mol file (Figure 4).

Figure 3. The MassFragment window in MetaboLynx displays the MS/MS information from an MSE experiment.
Figure 4. The mol file input window and the MassFragment interface.

Once the .mol file is selected, MassFragment is launched and a submission page is opened (Figure 4) with all the fragment ions automatically imported. The results window will display the proposed ion structures along with the exact mass errors and scores for each proposed structure. The scores are obtained based on the likelihood of breaking certain bonds and how well the results match with the exact mass generated. Therefore, the lower the score and the better the mass accuracy, the higher the confidence is in obtaining the correct structure for the fragment ion interrogated. The user can choose the fragment structures and print it into a .pdf file as a complete report (Figure 5).

Figure 5. The PDF report generated by MassFragment.

Figure 6 shows the final report from the MetaboLynx fragment analysis window. The fragment information obtained for the parent drug was assigned with fragments with the help of MassFragment. The lower half of the window shows the precursor ion scan from the m/z 272.1517, which is a signature fragment ion from the parent drug. This provides common fragment ion information with the parent and other drug related metabolites. This common precursor ion information helps to localize the position of the biotransformation in the molecule in a single injection.

The advantage of MSE together with MassFragment is that it allows the user to obtain all this information (fragment ion, precursor ion, and neutral losses) from a single injection and organize the information for structure elucidation in a simple data viewer.

Figure 6. Structural elucidation for indinavir MS/MS fragment ions by MassFragment.

Conclusion

In this application note, we have demonstrated a strategy for the rapid approach to metabolite identification and structural elucidation using Waters SYNAPT MS TOF-based Mass Spectrometer operating in MSE mode, with streamlined data analysis using the MetaboLynx and MassFragment Software tools.

Compared with the traditional data-dependant approach, which requires multiple injections for screening potential metabolites and performing structural elucidation with fragment ion information, this strategy offers enhanced productivity while providing superior data.

References

  1. K. Bateman, J Castro-Perez, et al. MSE with Mass Defect Filtering for In Vitro and In Vivo Metabolite Identification. Rapid Commun Mass Spectrom. 2007; 21 (9): 1485–96.
  2. R. Mortishire-Smith, D. O’Connor, et al. Accelerated Throughput Metabolic Route Screening in Early Drug Discovery using High-Resolution Liquid Chromatography/Quadrupole Time-of-flight Mass Spectrometry and Automated Data Analysis. Rapid Commun Mass Spectrom. 2005; 19 (18): 2659–70.

720002572, March 2008

返回顶部 返回顶部