• 应用纪要

An HTS Methodology for Reactive Metabolite Detection and Identification Using an LC-MS/MS Data-Independent Strategy

An HTS Methodology for Reactive Metabolite Detection and Identification Using an LC-MS/MS Data-Independent Strategy

  • Jose M. Castro-Perez
  • Kate Yu
  • John P. Shockcor
  • Henry Shion
  • Emma Marsden-Edwards
  • Waters Corporation
White laboratory rat on vials

Abstract

This application note demonstrates a streamlined, comprehensive, and generic workflow for metabolite identification, structural elucidation, and a specific search for GSH conjugations. 

Introduction

The identification of metabolites, whether from in vitro or in vivo studies, is an ongoing challenge for drug discovery and development. Metabolite identification typically uses an array of chromatographic and mass spectrometric methods, and may require multiple injections of the same sample. This is to ensure that enough information has been collected to detect all metabolites and to have sufficient fragmentation information available to elucidate structures. 

We describe in this application note a workflow that enables the collection of both parent and fragment information from a single injection (Figure 1). This MSE data acquisition uses two interwoven scan functions: the first (low collision energy, or low CE) function contains data from the intact metabolites, and the second (high collision energy, or high CE) function contains data from the fragment ions.

Workflow for metabolite identification.
Figure 1. Workflow for metabolite identification using the ACQUITY UPLC/SYNAPT MS systems in TOF-MSE mode.

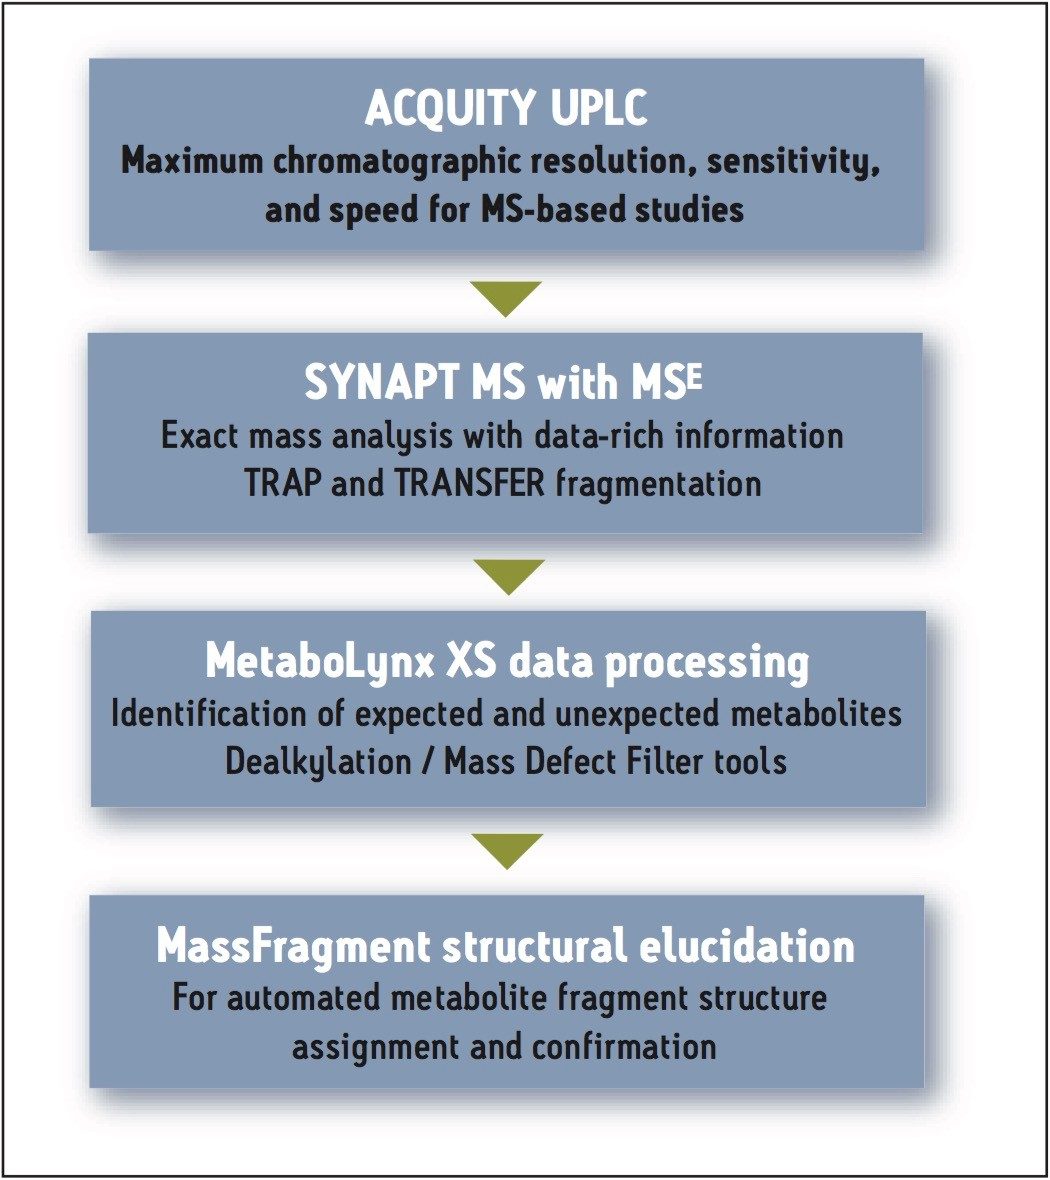
The high throughput screening (HTS) analysis was performed using ACQUITY UPLC and SYNAPT Mass Spectrometry systems. The resulting LC-MS data were obtained with mass accuracies typically in the sub-2 ppm range. 

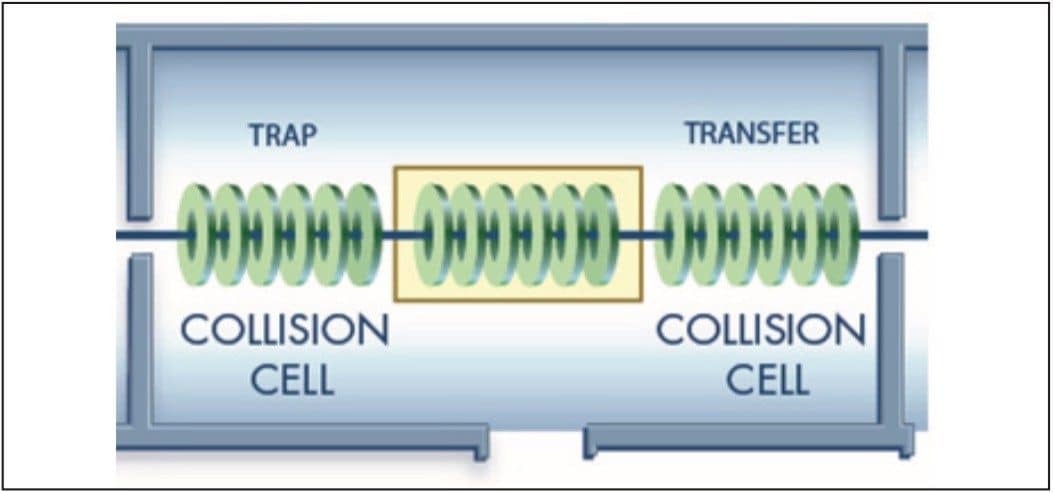
Since all data are collected in one run, post-acquisition processing of multiple fragment ions is possible. With this approach, the entire data-set is mined post-acquisition for specific metabolite masses, precursor and fragment ions, and neutral losses because all the necessary data has been collected simultaneously. Selectivity for biotransformation of the parent drug is achieved through exact mass measurement. 

A variety of data processing algorithms have been used to extract metabolite information from these data. 

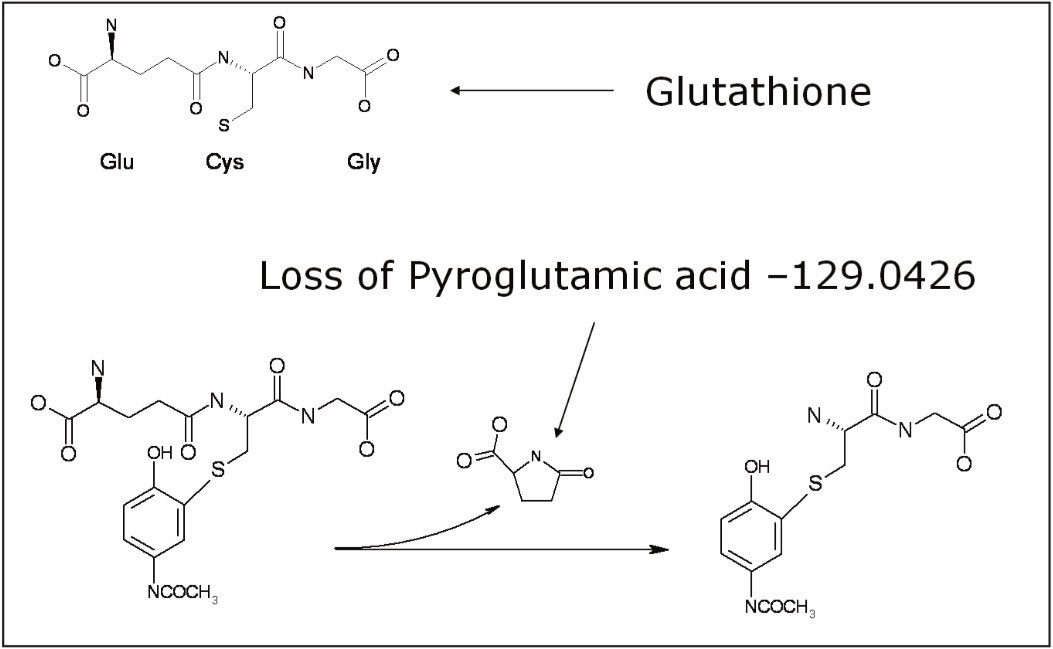
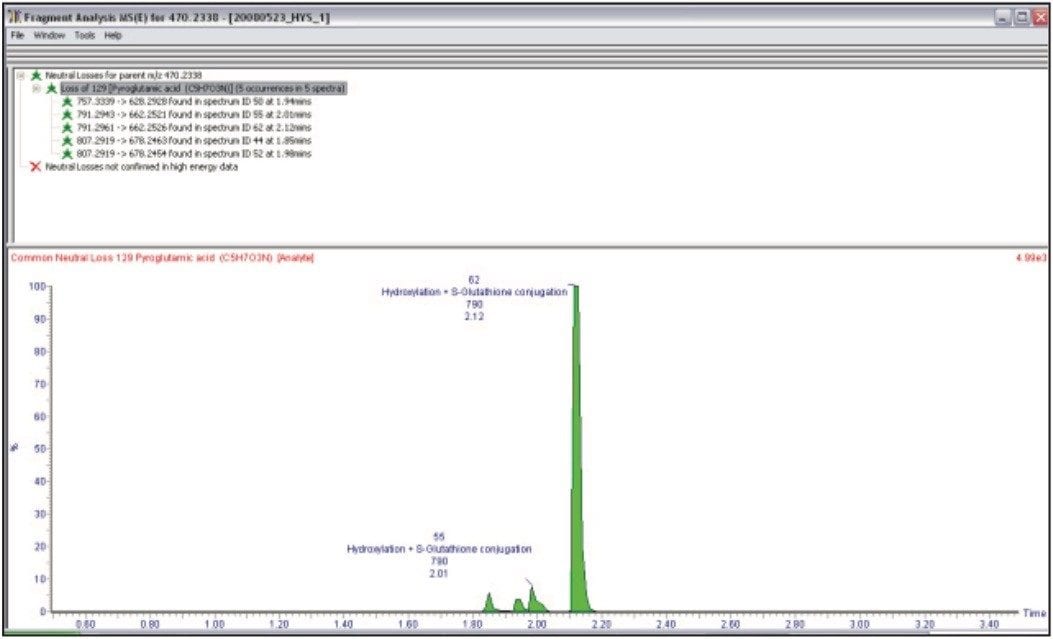
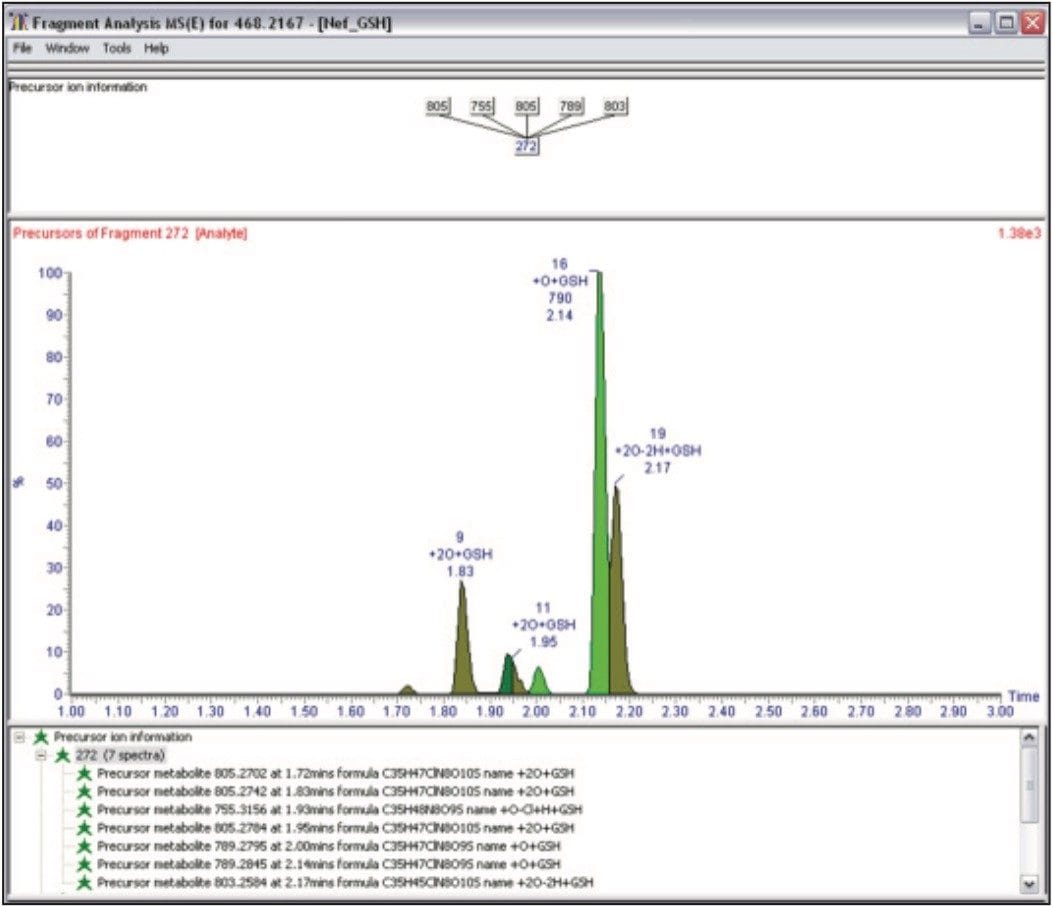
From a single injection, it is possible to obtain neutral loss and precursor ion information with exact mass containing diagnostic losses for reactive metabolites for both neutral and precursor ions acquisitions. In turn, these diagnostic neutral losses and precursor ions may also be used for in vitro reactive metabolism screening, in conjunction with the low energy data, to confirm the presence of a reactive electrophile intermediate.

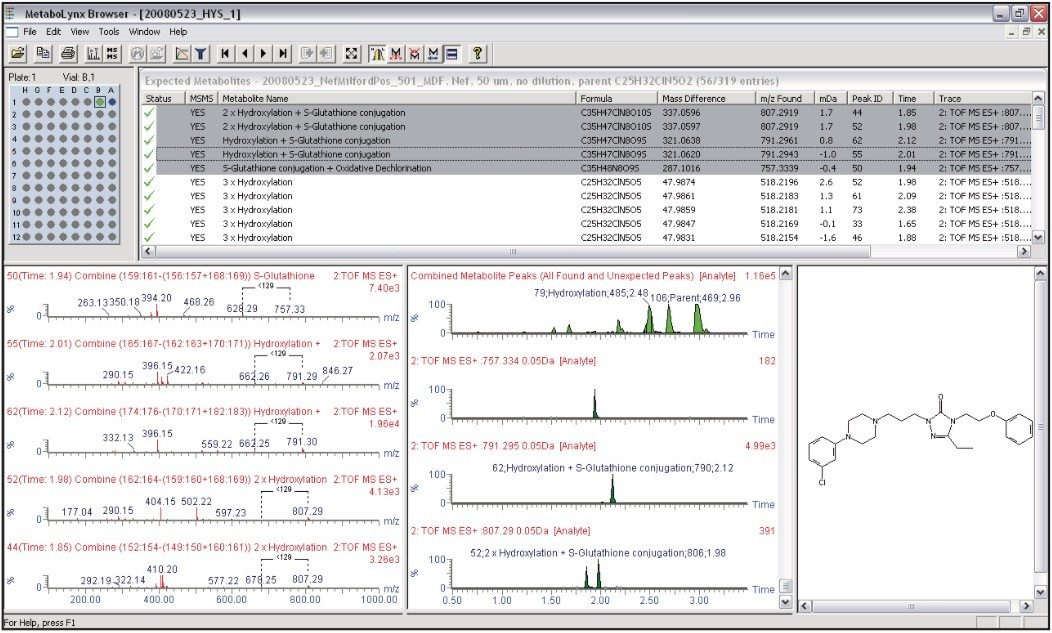
We illustrate this data-independent UPLC-MS reactive metabolite screening approach using samples from an incubation of Nefazodone human liver microsomes in the presence of glutathione (GSH).

Experimental

Samples

Nefazodone was incubated at 37 °C with rat liver microsomes at a final substrate concentration of 10 μM, in a Tris buffer adjusted to pH 7.4 containing the appropriate co-factors. GSH was added at a concentration of 10 mM to the microsomal incubation. The reaction was terminated after 90 minutes with two volumes of cold acetonitrile to one volume of sample. Then the sample was centrifuged at 13,000 rpm for 15 minutes and the supernatant was diluted in half with water +0.1 % formic acid. The diluted supernatant was injected directly to the UPLC-MS System for analysis.

Background on Nefazodone

Nefazodone is an antidepressant that was approved in the U.S. in late 1994. In spite of its therapeutic effects, there have been a number of cases – 55 cases of liver failure, 20 fatal, and another 39 cases of less severe liver failure – reported showing hepatobiliary dysfunction and cholestasis.1

LC Conditions

LC System:

Waters ACQUITY UPLC System

Column:

ACQUITY UPLC BEH C18 Column, 2.1 x 100 mm, 1.7 μm

Column temp.:

45 °C

Mobile phase A:

0.1% Formic acid

Mobile phase B:

Acetonitrile

Flow rate:

0.6 mL/min

Injection volume:

5 μL

Gradient

Time (min)

Profile

Curve

%A

%B

0.00

98

2

-

8.00

40

60

6

9.50

0

100

6

12.50

98

2

1

MS Conditions

Mass spectrometer:

Waters SYNAPT MS System

MS scan range:

50 to 900 Da

Mode of operation:

+ ion and – ion mode ESI

Lock mass:

Leucine enkephalin at 200 pg/μL

Data Processing

The MetaboLynx XS Application Manager, available for MassLynx Software, was used for MSE data mining and detection of putative metabolites. MassFragment Software was used for structural elucidation of metabolites.

MSE Methodology2, 3

The SYNAPT MS System was operated in the MSE data acquisition mode with a wide band RF mode in Q1, which allowed all ions to be transmitted from the source into the Triwave4 collision cells. The data were collected into a single data file with two functions. Function (1) Low CE acquisition (5 eV), which contained molecular ion information, and Function (2) High CE acquisition (using a 20 to 50 eV ramp), which contained all of the fragment ion information. 

The Triwave device provides the ability to induce fragmentation in two regions, TRAP and TRANSFER (Figure 2), which results in enhanced fragmentation coverage across the mass range. For example, one can readily obtain valuable information at low m/z values with this approach that further assists the structural elucidation process.

Schematic showing Triwave TRAP and TRANSFER collision cells.
Figure 2. Schematic showing Triwave TRAP and TRANSFER collision cells, which enable optimized fragmentation and structural coverage.

GSH Trapping5, 6

Typical in vitro incubation in microsomes forced the reaction to form GSH adducts.

For positive ion mode, we monitored the loss of the pyroglutamic acid moiety m/z 129 (Figure 3), the loss of GSH m/z 307 for aliphatic and benzylic thioethers, and the loss of glutamic acid m/z 147 for thioesters.

Neutral loss monitoring with the loss of the pyroglutamic acid moiety.
Figure 3. Neutral loss monitoring with the loss of the pyroglutamic acid moiety.

For negative ion mode, we monitored the precursor ion at m/z 272 arising from the γ glutamyl-dehydroanalyl-glycine.

Results and Discussion

The data obtained by this approach were automatically processed with MetaboLynx XS. This automated metabolite identification software tool uses molecular structure to generate a list of dealkylations, which is then used to create an automated mass defect filter specific to the dealkylations and the additions of GSH plus any other phase I biotransformation combinations. This results in a much reduced list of false positives, helping to increase throughput and minimize time spent reviewing the data. 

A total of five GSH adducts were detected in positive ion mode. These corresponded to m/z 757 (+O-Cl+GSH), 2x m/z 791 (+O+GSH), and 2x m/z 807 (+O2+GSH). The five GSH adducts were confirmed by reviewing the data in the low energy scan using exact mass (Figure 4).

MetaboLynx browser report.
Figure 4. MetaboLynx browser report showing all five GSH adducts as well as other biotransformations.

For further confirmation of these GSH adducts, the high energy data obtained in MSE mode may also be used in parallel to further verify the existence and to localize the position of the GSH addition to the molecule. In this particular case, we searched for the signature neutral loss of the pyroglutamic acid m/z 129.0426, which is lost in the high energy mode (Figure 5).

MetaboLynx Fragment Analysis report.
Figure 5. MetaboLynx Fragment Analysis report showing neutral loss of pyroglutamic acid for all five GSH adducts.

This approach is not confined to just searching one particular diagnostic loss since all the data are contained within the low and high energy acquisitions; we could potentially search for an unlimited number of neutral losses.

It is worth mentioning that, in some cases, the diagnostic neutral losses or precursor ions for GSH are not always generated. Even if this is the case, intact full-scan exact mass MS data is always available with this approach. This may not be the case with other techniques such as neutral loss scanning with a tandem quadrupole mass spectrometer, thus resulting in not detecting a potential GSH adduct. MSE can be used to confirm the presence of a GSH adduct that does not follow the neutral loss rules and can be further verified in high energy mode.

Negative ion MSE was also carried out and the GSH adducts were confirmed by extracting the diagnostic precursor ion of m/z 272 (Figure 6). In this example, we are showing the fragment data derived from the precursor ion of m/z 272 (the γ glutamyl-dehydroanalyl-glycine).

MetaboLynx negative ion precursor ion information for GSH adducts of Nefazodone.
Figure 6. MetaboLynx negative ion precursor ion information for GSH adducts of Nefazodone.

All the GSH adducts found in positive ion mode were confirmed, and two new adducts were confirmed in negative ion mode corresponding to m/z 803 (+2O-2H+GSH) and m/z 805 (+2O+GSH).

Conclusion

This application note demonstrates a streamlined, comprehensive, and generic workflow for metabolite identification, structural elucidation, and a specific search for GSH conjugations. It is possible to mine the data acquired in this fashion to extract information on multiple neutral losses or common precursor ions, which assist in identifying and localizing the sites of biotransformation.

From a single injection, we obtain data that would otherwise require numerous injections when utilizing traditional data-dependant analysis approaches such as those performed on tandem quadrupole or ion trap MS systems.

The novel software tools employed in this approach, MetaboLynx XS, allow the user to generate meaningful information from their samples in an automated manner with more confidence, thereby addressing one of the major bottlenecks in the drug discovery and development process.

References

  1. Kalkutkar et al. DMD. 2005; 33: 243–53.
  2. Bateman K, Castro-Perez J et al. RCM. 2007; 21: 1485–96.
  3. Mortishire-Smith R, O’Connor D et al. RCM. 2005; 19: 2659–70.
  4. The traveling wave device described here is similar to that described by Kirchner in U.S. Patent 5,206,506: 1993.
  5. Baillie and Davis. Biol Mass Spectrom. 1993; 22 (6), 319–25.
  6. Dieckhaus et al. Chem Res Toxicol. 2005 ; 18 (4), 630–8.

720002717, July 2008

返回顶部 返回顶部