
Routine Quantification of Polychlorinated Dibenzo-para-dioxins, Polychlorodibenzofurans and Dioxin-like Polychlorinated Biphenyls in Food by Atmospheric Pressure Chemical Ionization GC-MS/MS
Emmanuelle Bichona, Charlotte Rouauda, Anaïs Vénisseaua, Philippe Marchanda, Fabrice Monteaua, Bruno Le Bizeca, Peter Hancockb, Nicolas Boucherc
a Laboratoire d’Etude des Résidus et Contaminants dans les Aliments, Oniris, Nantes, France
b Waters Corporation, Wilmslow, United Kingdom
c Waters Corporation, France
Published on November 05, 2026

Abstract
This application note describes the coupling of gas chromatography tandem quadrupole mass spectrometry with atmospheric pressure chemical ionization (GC-APCI-MS/MS) for polychlorodibenzo-para-dioxins (PCDDs), polychlorinated dibenzofurans (PCDFs) and polychlorinated biphenyls (PCBs) analysis in food samples. Regulated congeners (17 PCDD/Fs and 12 dioxin-like PCBs (DL-PCB)) were quantified in 68 different food items (e.g., milk, eggs, grass, meat, peri-renal fat of several farm animals) with the APGC™ Source and Xevo™ TQ Absolute Mass Spectrometer. Results were compared to those obtained with an electron ionization high resolution mass spectrometer (GC-(EI)-HRMS) instrument.
Both systems gave highly correlated results from 1 to 50 pg/g WHO TEQ2005 with a determination coefficient (R²) of 0.999. Quantification values were equivalent across the instruments, with a regression slope of 1.05. Moreover, the robustness of the GC-APCI-MS/MS System was demonstrated, with no maintenance performed during the two weeks of operation. The relative standard deviations of the QC results were equivalent on both systems and complied with the precision criteria set out in Regulation (EU) 2017/771.1
Benefits
- The robustness and performance of APGC on the Xevo TQ Absolute Mass Spectrometer for the analysis of dioxins, furans and PCBs were proven to be at least equivalent to those of traditional analysis using electron ionization magnetic sector, making it ideally suited to the most demanding regulatory and standard methods
- Operator training is reduced from several months to a few weeks, thanks to the switch from a magnetic sector method to a tandem quadrupole MS
- The APGC and Xevo TQ Absolute System takes up less space in a laboratory and involves fewer constraints in terms of calibration, maintenance, and stabilization than magnetic sector MS
Introduction
In the general population, 90% of human exposure to dioxins and PCBs is attributable to the diet (AFSCA, 2018).2 Dioxins (PCDD/Fs) and PCBs are listed in the Stockholm Convention as Persistent Organic Pollutants (POPs) due to their high stability, widespread distribution in the environment, accumulation in living organisms and toxicity. Their similar physicochemical properties allow the use of a single analytical method for monitoring these different chemical classes (EU regulations 277/20123 on animal feed and 2023/9154 on foodstuff).
The traditional analytical technique, GC-(EI)-HRMS, faces competition from tandem quadrupole mass spectrometry, particularly GC-(APCI)-MS/MS for dioxins and PCBs analysis. APGC, with gentle ionization, which allows a relatively high abundance of the M+. molecular ion under dry conditions, offers the possibility of harnessing the potential of selectivity through MS/MS. This coupling enables the detection of very small quantities, in the femtograms range (10-15 g)5,6 with fewer budgetary constraints in terms of training and running costs. Ultimately, sensitivity alone is insufficient without robustness. Therefore, the robustness of APGC coupled with the Xevo TQ Absolute Mass Spectrometer was evaluated, particularly for food monitoring applications and in the context of the requirements set out in Regulation (EU) 2017/771.
The study evaluated the GC-APCI-MS/MS technique for the monitoring of PCDD/Fs and PCBs in food and feed, taking into account the performance recommendations associated with current European regulations.
Experimental
Materials
68 samples were analyzed, including fat samples (12 pig fat samples, 8 bovine fat samples, and 1 sheep fat sample), 6 chicken egg samples, 3 soil samples, 13 samples of various food supplements, 4 seafood samples, 3 poultry muscle samples, 12 grass samples, and 6 milk samples. These samples were anonymized and mainly sourced from official French monitoring plans. The quantification method used was based on the principles of isotopic dilution. Internal standards were purchased from Wellington Laboratories and Cambridge Isotope Laboratories.
Sample Preparation
Sample preparation is detailed by Hagberg et al.7 Briefly, the first step consists of water elimination by freeze drying or desiccation. Extraction is performed by a pressurized liquid extraction (PLE) step. For pigment and grass samples, a pre-purification step on acidified silica column by sulphuric acid is carried out before switching to the Miura® Automated System. This device purifies and splits the extract in two fractions, using four successive columns. Coplanar dioxins and PCBs are then separated from non-coplanar PCBs before analysis.
Instruments
GC-(APCI)-MS/MS
GC Conditions
|
GC system: |
8890 with 7693A Autosampler (Agilent Technologies, Inc.) |
|
Syringe solvents: |
Dichloromethane followed by toluene |
|
Column for dioxins and coplanar PCBs: |
Optima 5MS Accent 60 m x 0.25 mm, 0.25 μm (Macherey-Nagel®, France) |
|
Column for non-planar PCBs: |
HT8-PCB 60 m x 0.25 mm, 0.25 μm (Trajan®, Australia) |
|
Flow rate for dioxins and coplanar PCBs: |
1.4 mL/min |
|
Flow rate for non-planar PCBs: |
1.0 mL/min |
|
Injection for dioxins and coplanar PCBs: |
Pulsed splitless (32 psi until 1 min) at 280 °C, Liner with single gooseneck (4 mm i.d.) with wool |
|
Injection for non-planar PCBs: |
Splitless at 280 °C, Liner with single gooseneck (4 mm i.d.) with wool |
|
Purge flow: |
50 mL/min after 1 minute wait |
|
Temperature program for dioxins and coplanar PCBs: |
90 °C hold for 1 minute, ramp to 200 °C at 50 °C/min, ramp to 300 °C at 4 °C/min, ramp to 310 at 40 °C/min, hold for 3 minutes |
|
Temperature program for non-planar PCBs: |
90 °C hold for 1 minute, ramp to 200 °C at 20 °C/min, ramp to 270 °C at 2 °C/min, ramp to 320 at 30 °C/min, hold for 5 minutes |
MS Conditions
|
MS system |
Xevo TQ Absolute Mass Spectrometer |
|
Ionization source: |
APGC at 150 °C |
|
Nitrogen generator: |
Calypso DP (F-DGSi®, France) delivering simultaneously two N2 gas supplies. One for the makeup gas to support ionization at 400 mL/min (99.999 % purity) and the other for the MS source at 35 L/min (99 % purity) |
|
Heated transfer line: |
280 °C |
|
Corona current: |
2.0 µA |
|
Cone voltage: |
40 V |
|
Cone gas: |
265 L/hr, Nitrogen |
|
Auxiliary gas: |
150 L/hr, Nitrogen |
|
Makeup gas: |
350 mL/min, Nitrogen |
|
Acquisition: |
MRM |
GC-(EI)-HRMS
The GC used was a 7890A equipped with a 7683B Autosampler (Agilent Technologies, Inc). The mass spectrometer was a JMS-800D (Jeol®, Japan) model operating at a resolution of 10,000 (10% valley). The detailed method used is described by Cariou et al.8
Results and Discussion
Humidity
APGC can be operated in either charge or proton transfer ionization modes depending on the source gas flows (auxiliary, cone gas and make up) and the ambient conditions (humidity) in the ion source. For PCDD/F and PCB analysis, as they are non-polar molecules, charge transfer is expected, requiring very dry conditions. A control chart was established based on the species ratio (M+H)+ versus M+▪ of phenanthrene to monitor the effectiveness of charge transfer ionization throughout this study (Figure 1).
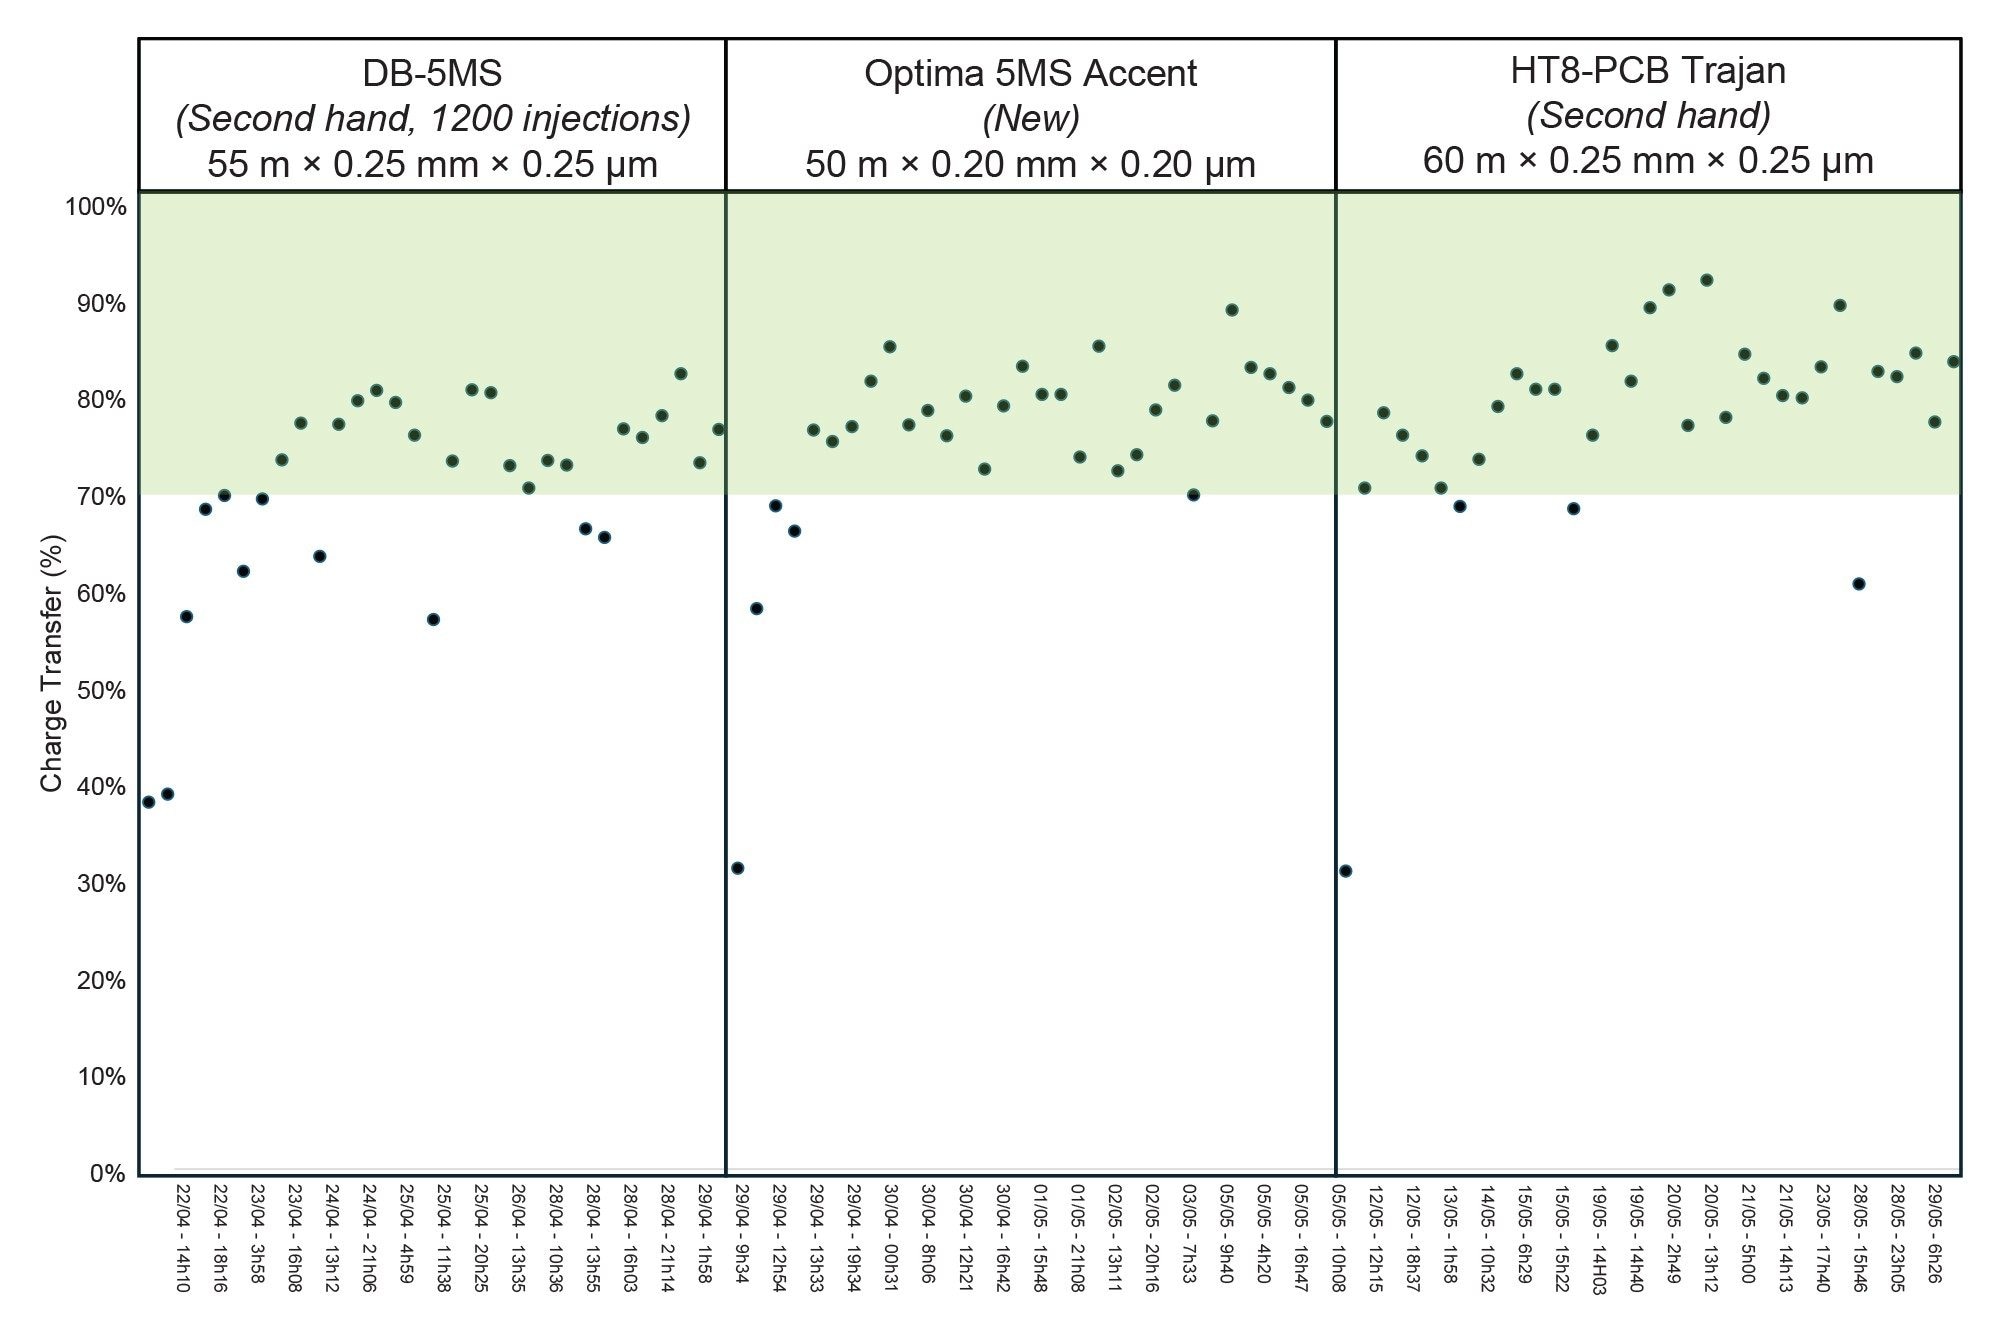
Throughout the study, the charge transfer ionization of 70% was easily reached and stabilized after each column change. Immediately after installing a new column, the charge transfer rate decreased to approximately 30% because the transfer line was separated from the source and the ionization chamber was exposed to the lab’s ambient air. For the first column installation, it took one week to stabilize the humidity level because the nitrogen generator was also first connected to the instrument on the same day. However, when the nitrogen generator was used continuously, the time required for the ambient conditions to become acceptable was reduced to only two hours (e.g., when installing the last column). This settling time is compatible with routine analyzes.
Ambient conditions were also influenced by using the instrument; at the beginning of the injection series, the percentage of charge transfer is lower than at the end of the series. This demonstrates that APGC works most reliably with the best operating conditions for analysis when the system is operated continuously. One control point was measured in conditions with a 60% charge transfer rate; however, this did not affect sensitivity or the performance achieved. Finally, it was not necessary to install a filter on the Calypso nitrogen generator, as it proved to be very efficient. It should be noted that the nitrogen generator was used exclusively with the Xevo TQ Absolute System for this study.
Precision
After checking the chromatographic resolution rules set out in the EU Regulation 2017/771, the accuracy of the instrument was checked throughout the batches using a mid-range calibration point (QCcal) injected every day as well as an in-house reference material (butter, QCb) at the end of each series. The relative standard deviations (RSD) obtained for QCcal and QCb were 0.9% (n = 12) and 4.3% (n = 8), respectively. QCb was injected over a three-month period, and the precision was similar to those reached with GC-HRMS (i.e. 4.7%).
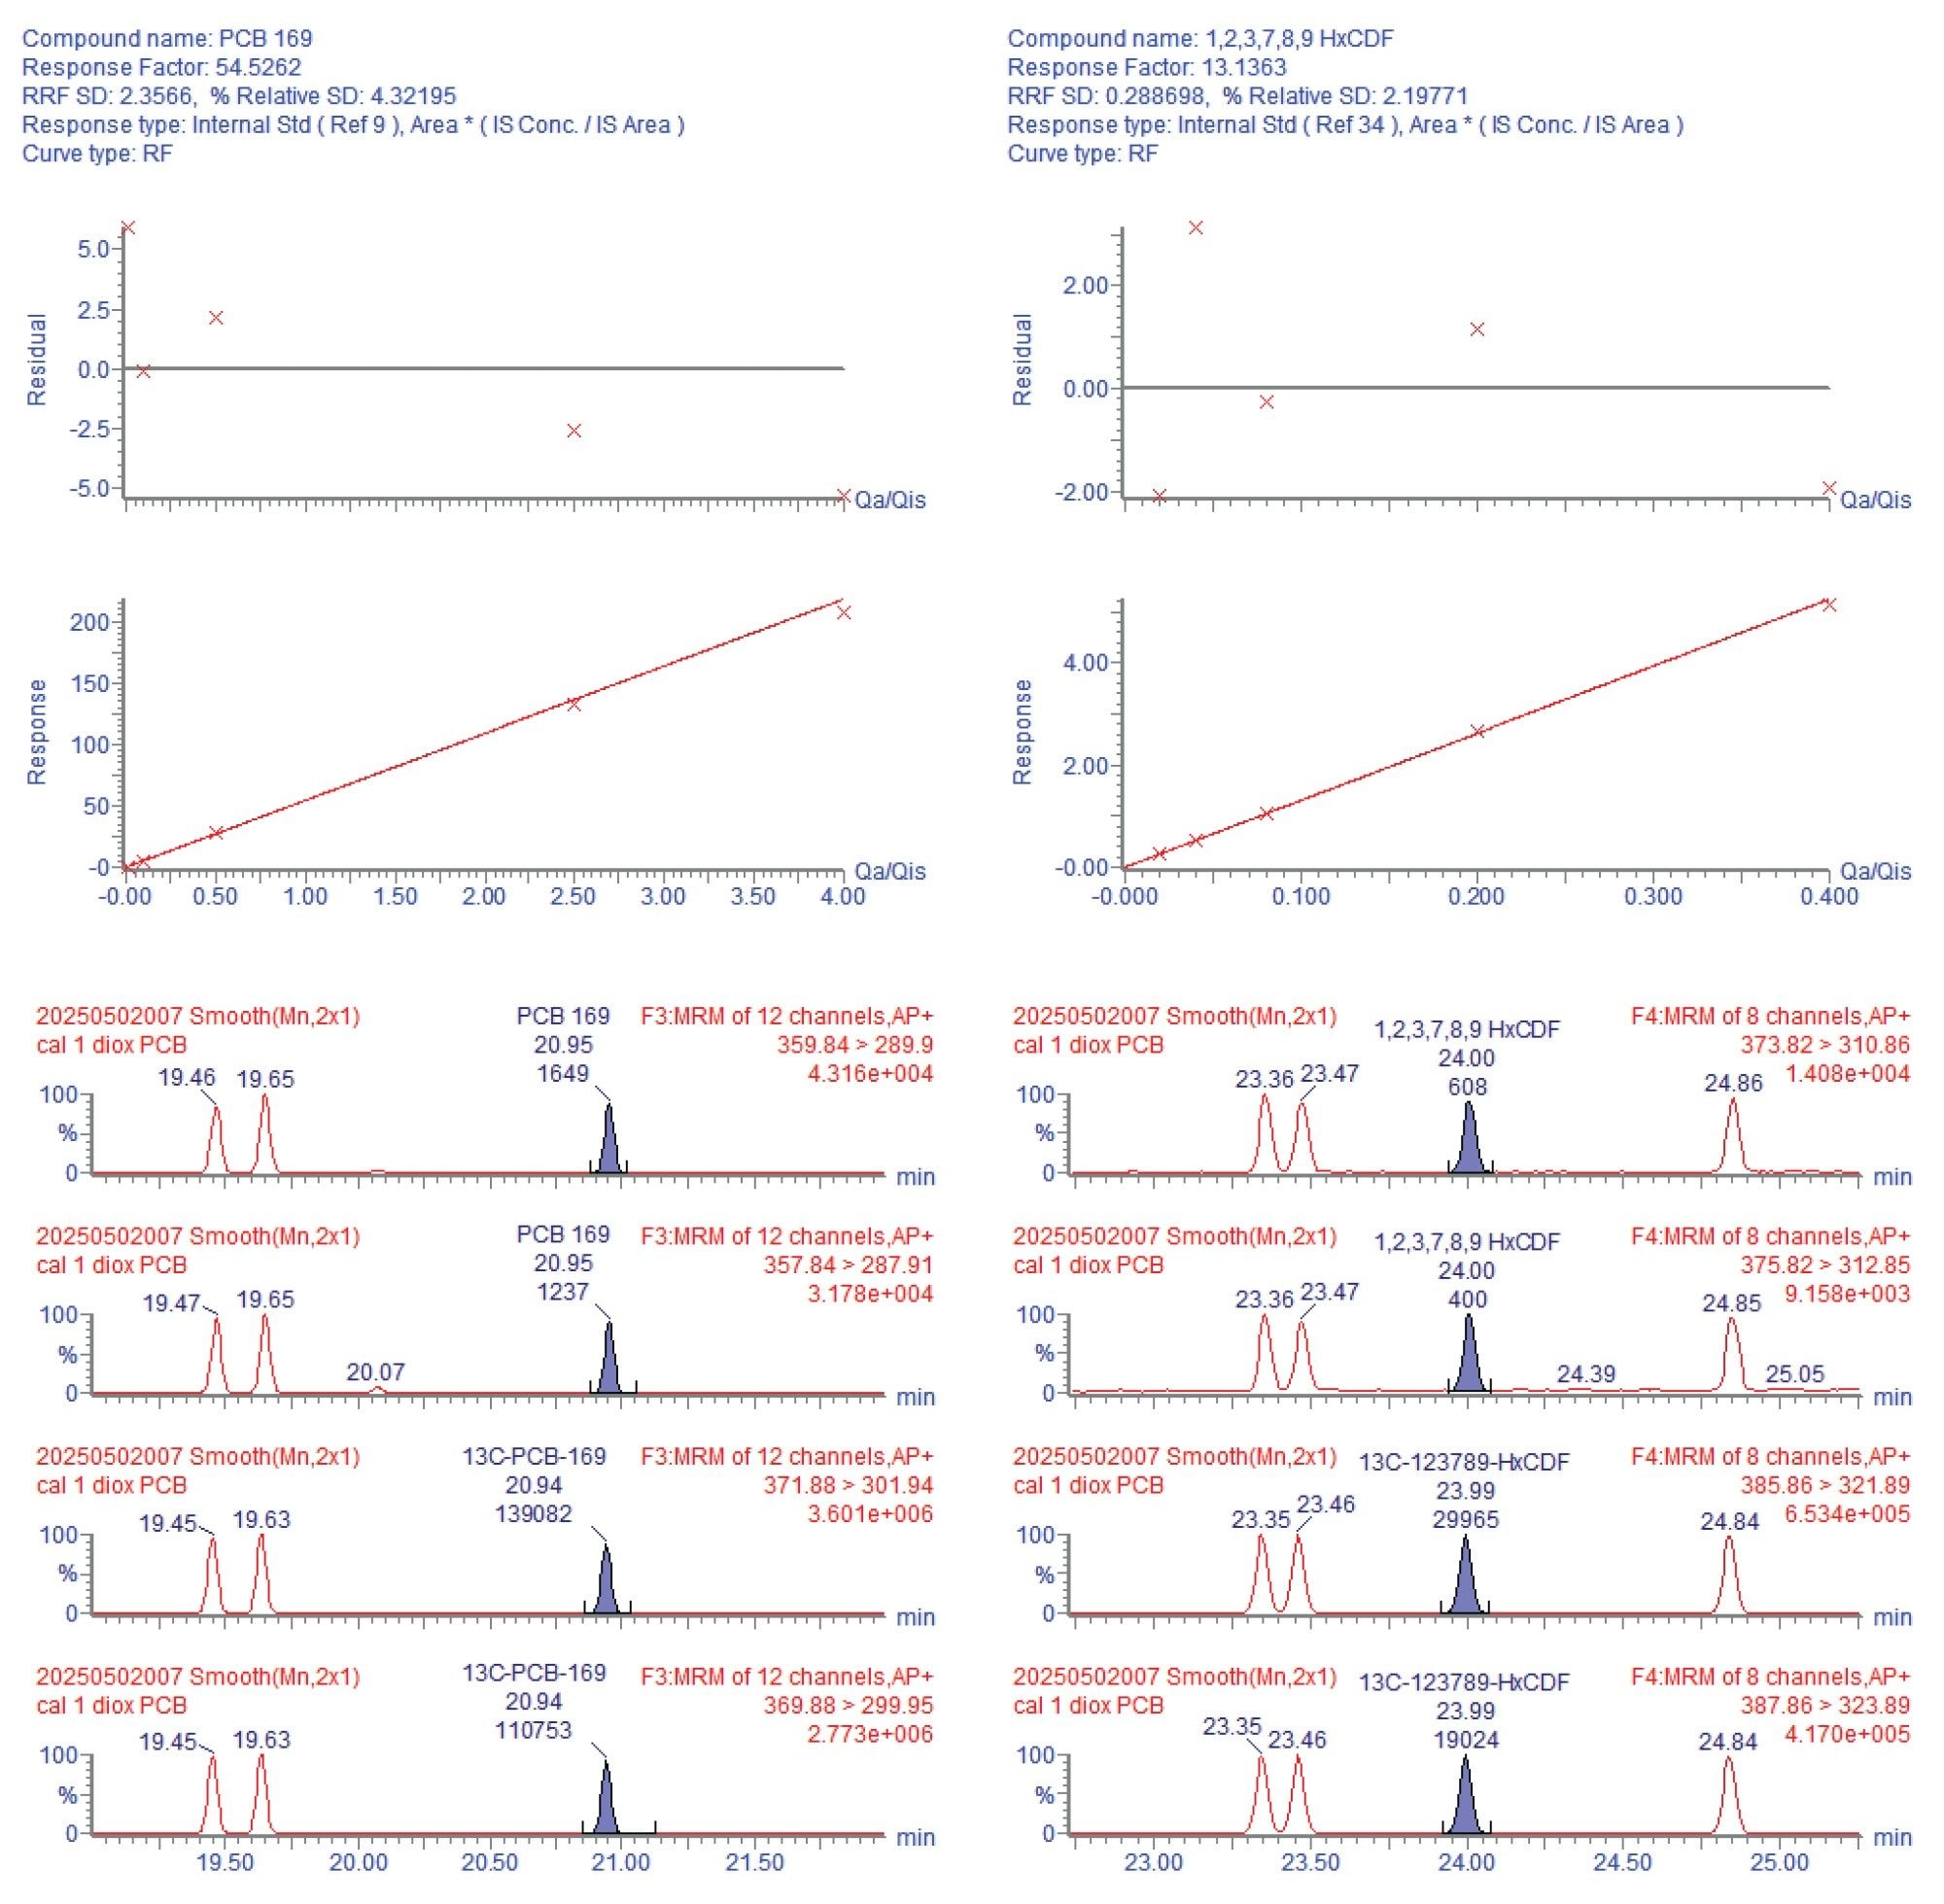
The calibration curves were linear over the five calibration points. The response factor variation is between +20 and -20%, as required by Regulation (EU) 2017/771. Example calibration curves, for PCB 169 and 1,2,3,7,8,9-HxCDF, and response factors over the range of calibration points are presented in Figure 2. The chromatographic profiles of both compounds are also represented on this figure for the first calibration point, illustrating the sensitivity of the APGC and Xevo TQ Absolute System on the lowest standard solution.
Quantitative Results
A TargetLynx™ Software processing method was used on all the chromatograms for quantification. When a compound could not be quantified, its quantity was set to zero. The sum of regulated congeners was weighted by their toxic equivalency factor (OMS-TEQ2005). Since the 2,3,7,8-Tetrachlorodibenzo-p-dioxin (TCDD) is the most toxic dioxin, its TEF is set at 1, and the TEFs of the other congeners are derived from this.
The resulting weighted quantities of dioxins and PCBs were then converted into levels in four different ways: in pg/g of fat, in pg/g of fresh weight, in pg/g of dry weight, or in pg/g at 12% moisture content, depending on the unit expected by the regulations. These contents were plotted in Figure 3. This approach of representing the data allows us to visually see the comparison between the GC-APCI-MS/MS and GC-EI-HRMS Systems.
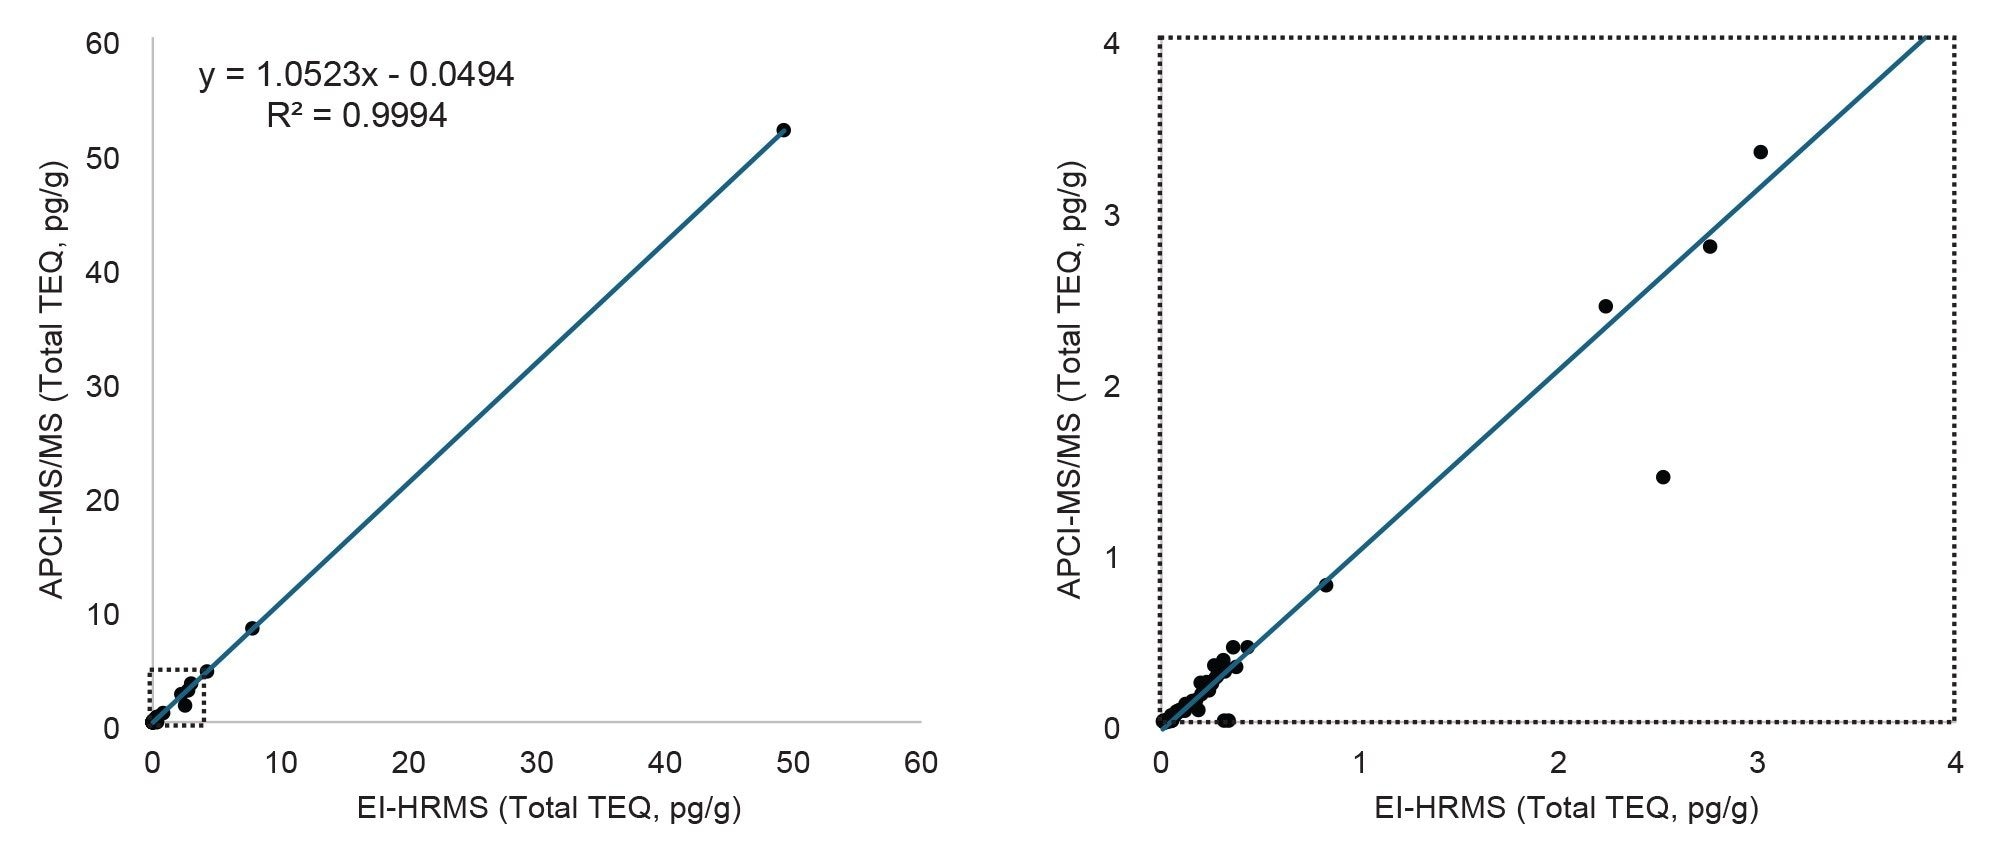
The determination coefficient (0.9994) demonstrates the appropriateness between GC-APCI-MS/MS and GC-EI-HRMS Systems results while the slope (1.05) reveals good correspondence of the quantitative results. An article by Van Bavel et al.5 which uses the older Xevo TQ-S Mass Spectrometer with APGC showed a similar result with a slope also equal to 1.05, considering food but also environmental samples.
The intercept is slightly negative, but this can be explained by the different calculation methods of the limits of quantification (LOQ). For the GC-APCI-MS/MS System, LOQs were set at zero when congeners are undetected, whereas the software associated with the GC-EI-HRMS System calculated a LOQ value from the background for each sample and each congener. The quantification from the GC-EI-HRMS System is, therefore, slightly higher than that obtained with the Xevo TQ Absolute System.
Robustness
The APGC source together the Xevo TQ Absolute Mass Spectromer is a robust system that required no maintenance during the two weeks of analysis. Furthermore, no cleaning of the ionization chamber was required as the sensitivity remained satisfactory throughout. The liner was kept unchanged without any cleaning, thanks to the low volume injected (1 µL).
The operator using the APGC System was a first-year master's student. This demonstrates the ease of use of the system, from both viewpoints of hardware and software (MassLynx™ and TargetLynx).
Conclusion
This study evaluated the analytical performance of a commercially available GC-APCI-MS/MS System for the determination of PCDD/Fs and PCBs in foodstuffs and animal feed under routine conditions. A representative panel of samples was analyzed simultaneously by GC-EI-HRMS and GC-APCI-MS/MS Systems. It was confirmed that the GC-APCI-MS/MS System offered robustness and quantitative performance at least equivalent to the GC-EI-HRMS approach. The coupling of the APGC source with Xevo TQ Absolute Mass Spectrometer proved to be a very good alternative to the traditional analytical approach based on a magnetic sector MS. The APGC and Xevo TQ Absolute System is mid-size and takes up less space in a laboratory than a magnetic sector MS. It also requires fewer specialist skills from the operator and involves fewer constraints in terms of calibration, maintenance, and stabilization than magnetic sector mass spectrometry systems.
References
- 2017/771. Commission Regulation (EU) 2017/771 amending Regulation (EC) No 152/2009 as Regards the Methods for the Determination of the Levels of Dioxins and Polychlorinated Biphenyls, 2017 O.J. L 115/22 (Text with EEA relevance). 2017.
- 2 AFSCA. Contamination de denrées alimentaires et des aliments pour animaux par des dioxines et des PCB : FAQ. 2018, Version n°2, July 2018.
- EC. Règlement (UE) n° 277/2012 de la Commission du 28 mars 2012 modifiant les annexes I et II de la directive 2002/32/CE du Parlement européen et du Conseil en ce qui concerne les teneurs maximales et les seuils d’intervention relatifs aux dioxines et aux polychlorobiphényles. In 277/2012, Union, O. J. o. E., Ed.; 2012; Vol. 277/2012.
- Commission, E. COMMISSION REGULATION (EU) 2023/915 of 25 April 2023 on Maximum Levels for Certain Contaminants in Food and Repeaing Regulation (EC) No 1881/2006. Official Journal of the European Union: 2023; p L 119/103.
- Van Bavel, B.; et al. Atmospheric-pressure Chemical Ionization Tandem Mass Spectrometry (APGC/MS/MS) - An Alternative to High-resolution Mass Spectrometry (HRGC/HRMS) for the Determination of dioxins. Anal. Chem. 2015, 87 (17), 9047-9053. DOI: 10.1021/acs.analchem.5b02264 From NLM.
- Li, X.; et al. Application of Gas Chromatography Coupled to Triple Quadrupole Mass Spectrometry (GC-(APCI)MS/MS) in Determination of PCBs (mono-to deca-) and PCDD/Fs in Chinese Mitten Crab Food Webs. Chemosphere 2021, 265, 129055. DOI: 10.1016/j.chemosphere.2020.129055.
- Hagberg, J. Analysis of Brominated dioxins and furans by High Resolution Gas Chromatography/High Resolution Mass Spectrometry. J. Chromatogr. A 2009, 1216 (3), 376-384. DOI: 10.1016/j.chroma.2008.10.022.
- Cariou, R.; et al. Prediction of the PCDD/F and dl-PCB 2005-WHO-TEQ Content based on the Contribution of Six Congeners: Toward a New Screening Approach for Fish Samples? Environ. Pollut. 2010, 158 (3), 941-947. DOI: http://dx.doi.org/10.1016/j.envpol.2009.09.010.
720009622, November 2026


