High-Throughput Native HRMS ProA-MS Analysis of mAb Variants in Cell-Culture Samples
Stephan M. Koza, Matthew A. Lauber, Stephen J. Shiner
Waters Corporation, United States
Published on January 21, 2025
Abstract
The use of rapid Protein-A (ProA) 1-minute elution gradients along with a high resolution mass spectrometer (HRMS), Xevo™ G3™ QTof Mass Spectrometer, for the high-throughput native intact ProA-MS analysis of a monoclonal antibody (mAb) directly from clarified cell culture filtrate samples (CCCF) is presented. This ProA-MS method is facilitated with a high-efficiency ProA affinity column (BioResolve™ Protein A Affinity Column, MaxPeak™ Premier, 3.5 µm, 2.1 x 20 mm). Additionally, in combination with 280 nm UV absorbance data (A280), product titer can also be determined. The LC-MS method employed ammonium acetate (AMA) and formic acid mobile phases at a low flow rate to allow for direct connection to a QTof MS, to provide the detection of trace-level mAb (NISTmAb) variants.
Benefits
- ProA-MS rapid analysis (4-minutes) of mAb variants
- Intact mass HRMS identification of variants
- A280 determination of titer
Introduction
Analytical methods that enable the rapid structural evaluation of monoclonal antibodies mAb, msAb, and fusion proteins are sought after throughout the multiple stages of biopharmaceutical development. One such approach is ProA-MS for the direct analysis of CCCF samples.1–3 In this study, the impact of using high efficiency affinity columns was evaluated, along with a high-throughput method for ProA-MS analyses.
In prior studies, the value of the minimal elution peak volumes generated when using a high-efficiency, nonporous 3.5 µm, 2.1 X 20 mm ProA column in 2D ProA-SEC and high-resolution ProA-MS analyses was demonstrated.4–6 The efficiency of this column format could also provide improved native ProA-MS sensitivity in addition to titer information when deployed with a steep pH gradient using MS-compatible mobile phases. Accordingly, NISTmAb™ was assessed as both a pure sample and spiked into CCCF to evaluate the capability of the proposed ProA-MS method to identify intact NISTmAb variants and to determine product titer in CCCF using A280 detection.
Experimental
Sample Descriptions
1. NISTmAb reference material, RM 8671 (10 mg/mL).
2. CHO CCCF, clarified, 0.2 µm filtered, ~90% viability, with ~0.035 mg/mL trastuzumab.
Method Conditions:
LC Conditions
|
LC system: |
ACQUITY™ UPLC™ Instrument with BSM, FTN Sample Manager, and ACQUITY TUV Detector (5 mm flow cell) |
|
Column: |
BioResolve Protein A Affinity Column, MaxPeak Premier, 3.5 µm, 2.1 x 20 mm (p/n: 186011369) |
|
Column temperature: |
Ambient |
|
Sample temperature: |
6 °C |
|
Injection volume: |
as indicated |
|
ProA loading mobile phase: |
100 mM ammonium acetate (LC-MS grade) |
|
ProA elution mobile phase: |
200 mM formic acid (LC-MS grade) |
|
UV absorbance: |
280 nm |
|
Data management: |
UNIFI™ Application and waters_connect™ Platform |
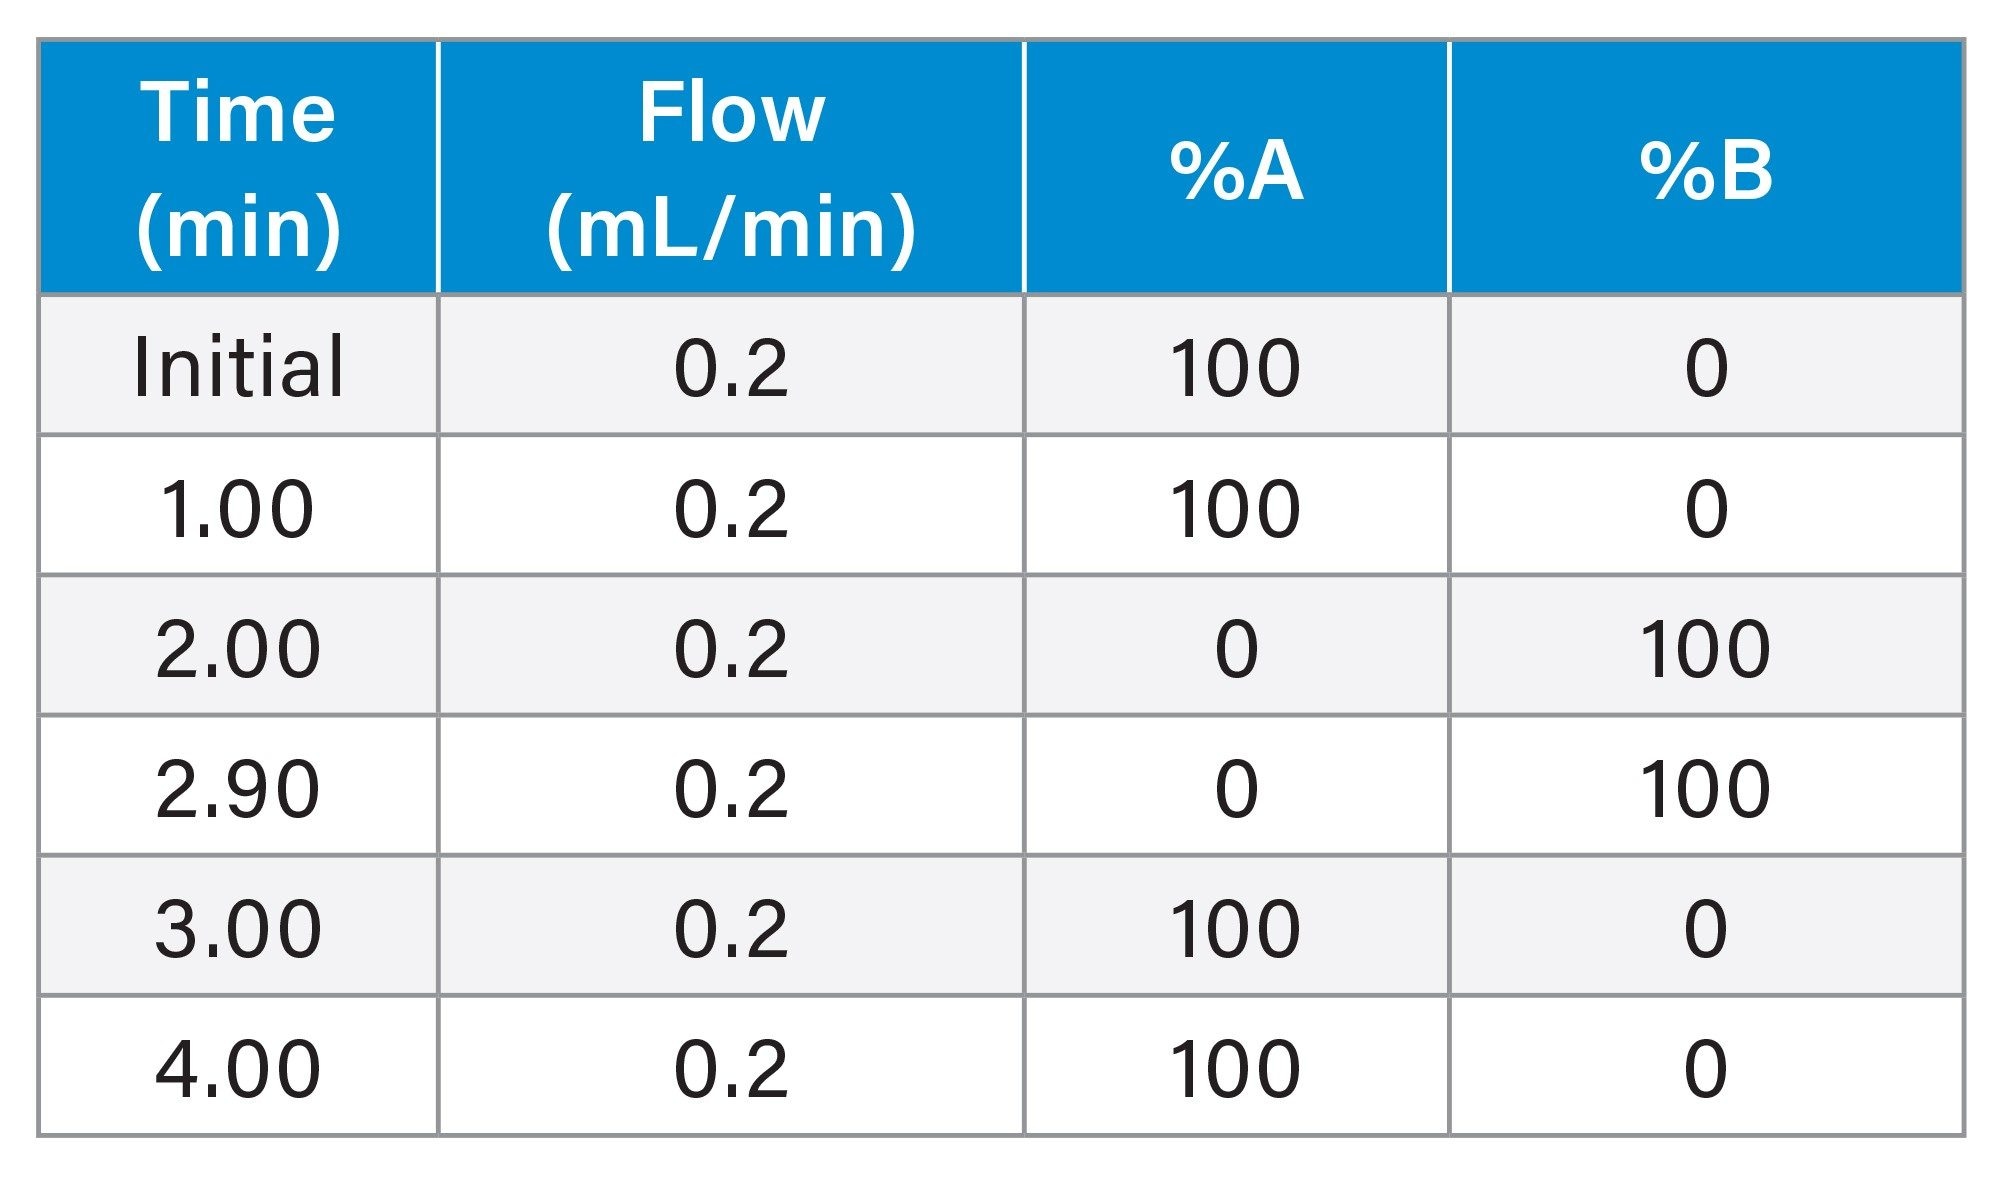
HT ProA-MS NISTmAb Gradient
Xevo G3 QTof Mass Spectrometer Parameters
|
Low mass: |
400 m/z |
|
High mass: |
8000 m/z |
|
Scan time: |
1.000 s |
|
Collision energy mode: |
Off (6V) |
|
Intelligent data capture threshold: |
Custom (1) |
|
Source temperature: |
120 °C |
|
Desolvation temperature: |
500 °C |
|
Cone gas: |
50 L/h |
|
Desolvation gas: |
600 L/h |
|
Capillary voltage: |
2.00 kV |
|
Sample cone voltage: |
150 V |
|
Data collection and analysis: |
UNIFI Application and waters_connect Platform |
Results and Discussion
NISTmAb ProA-MS
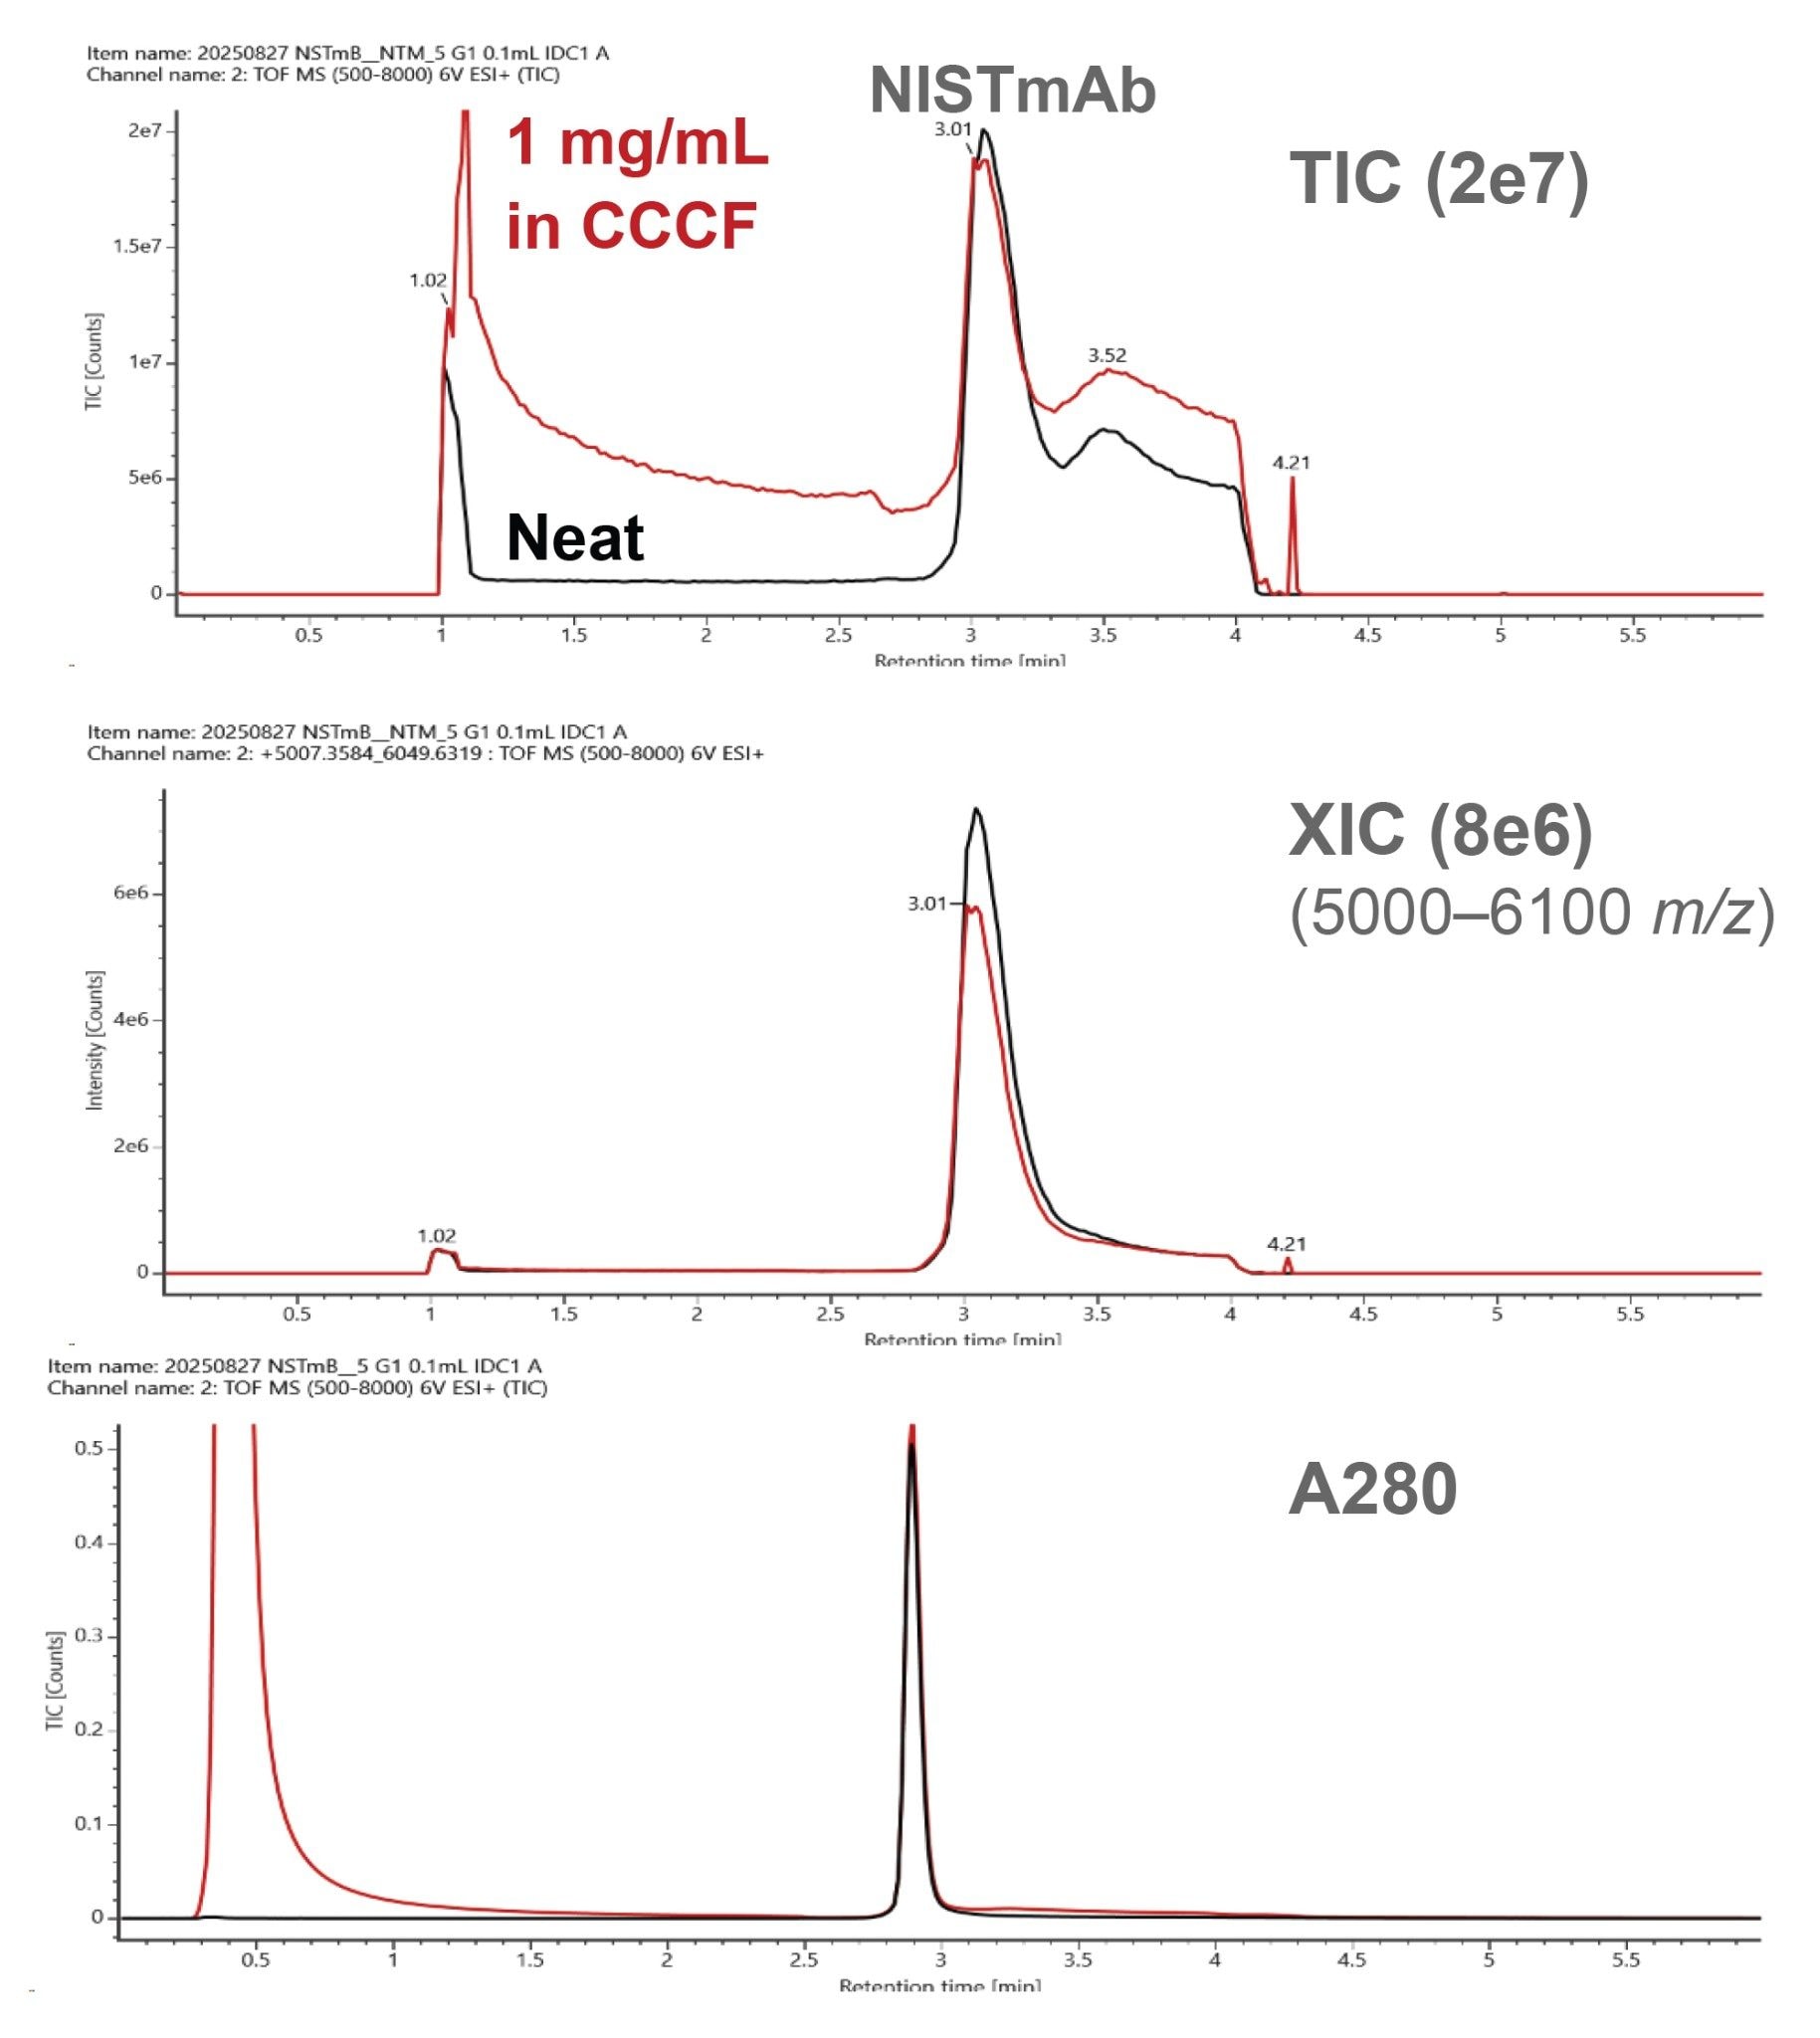
For this ProA-MS study, NISTmAb was evaluated neat (10 mg/mL) at column loads of 2, 5, 10, and 20 µg and evaluated diluted to 1.0 mg/mL in CCCF at column loads of 2, 5, and 10 µg. Representative chromatograms for the 5 µg sample loads are presented in Figure 1. Comparable peak areas were obtained for the A280 chromatograms while a lower extracted ion chromatogram (XIC) peak area was observed for the CCCF-diluted sample. This observation is likely the result of reduced ionization efficiency due to sample matrix components not being fully washed from the column prior to elution as evidenced by the total ion chromatograms. These results were generated using MS-compatible mobile phases (see Experimental) and an MS-friendly flow rate of 0.20 mL/min. These conditions were selected to provide effective binding and elution along with minimal analysis time while not significantly compromising MS performance. However, further optimization of mobile phases in addition to LC and MS settings could provide improvements in the MS response for cell culture samples.
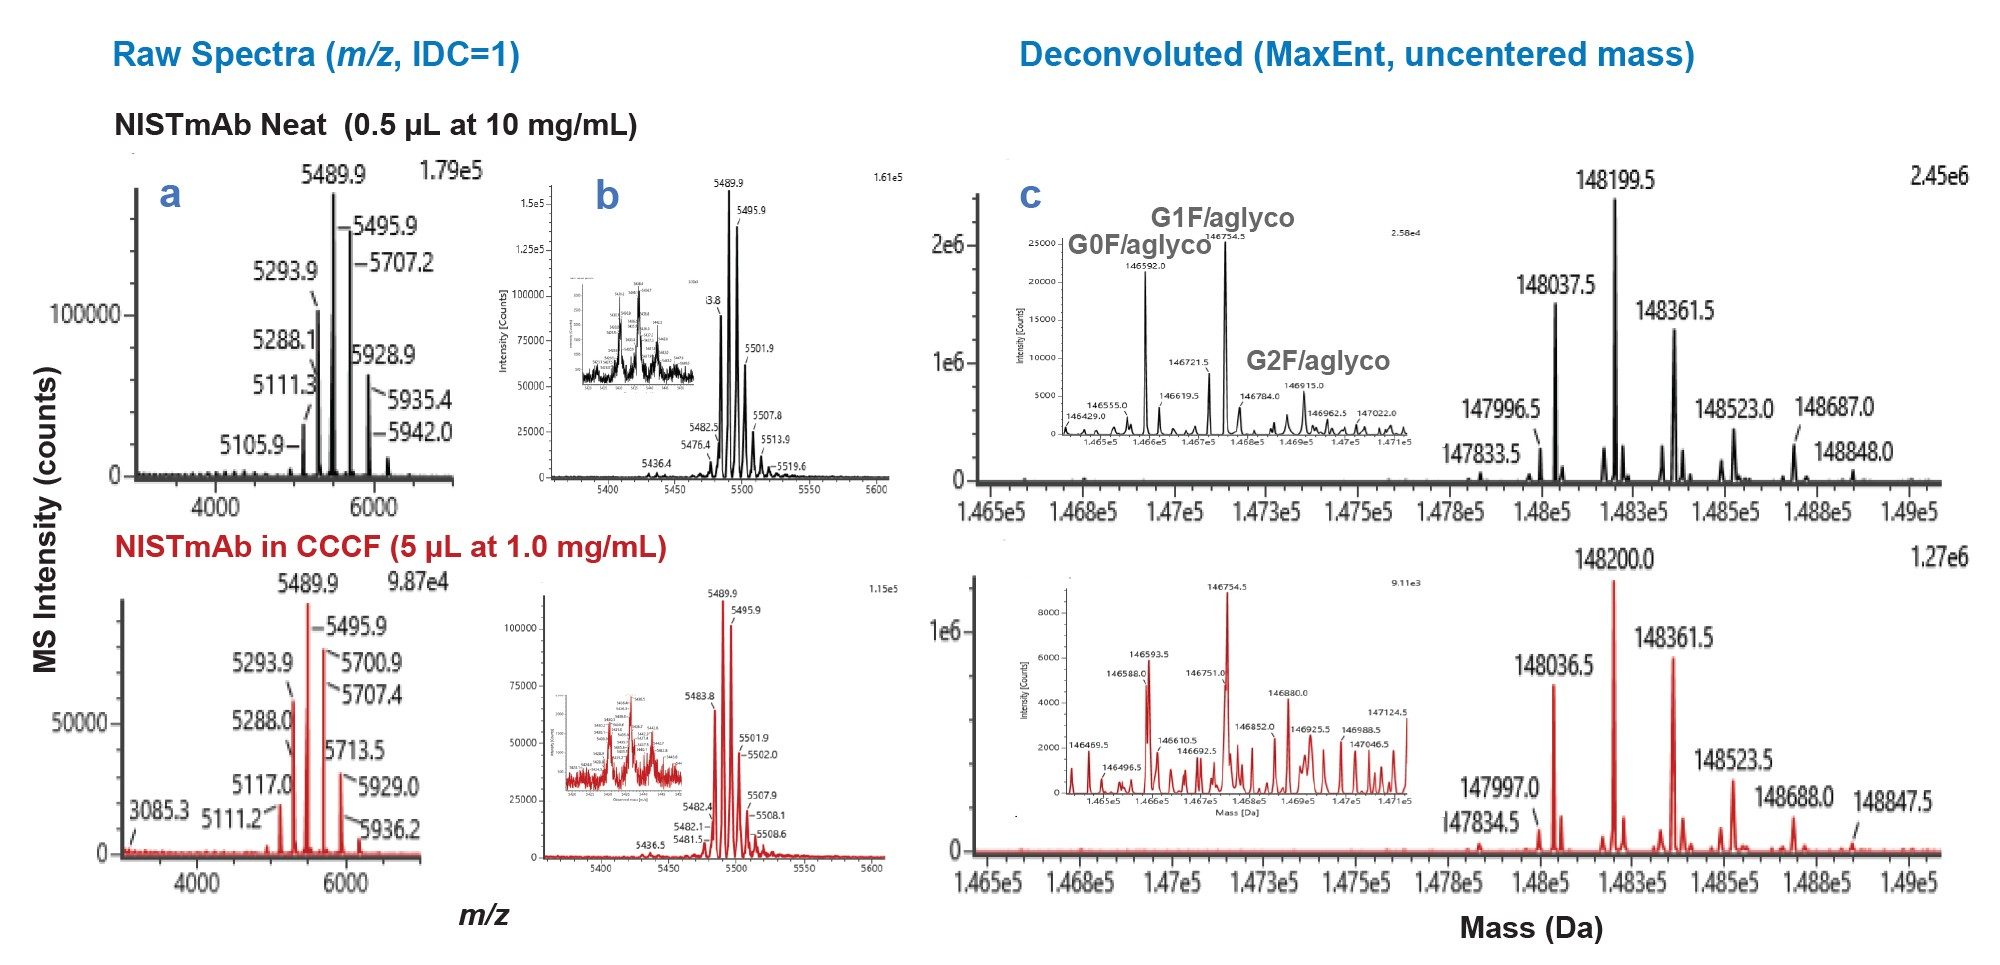
The resultant native intact MS spectra for the 5 µg NISTmAb sample loads are presented in Figure 2. Comparable MS spectra were obtained for the neat and CCCF-diluted samples, with the neat sample providing slightly higher signal-to-noise (s/n) than the CCCF-diluted sample, consistent with the slightly lower response of the latter. Highlighted in the MS data are a series of three low abundance singly glycosylated variants that could be identified. These and other intact variants had been previously reported by NIST in results from collaborative multi-lab MS analyses of NISTmAb analyzed under denaturing conditions.5
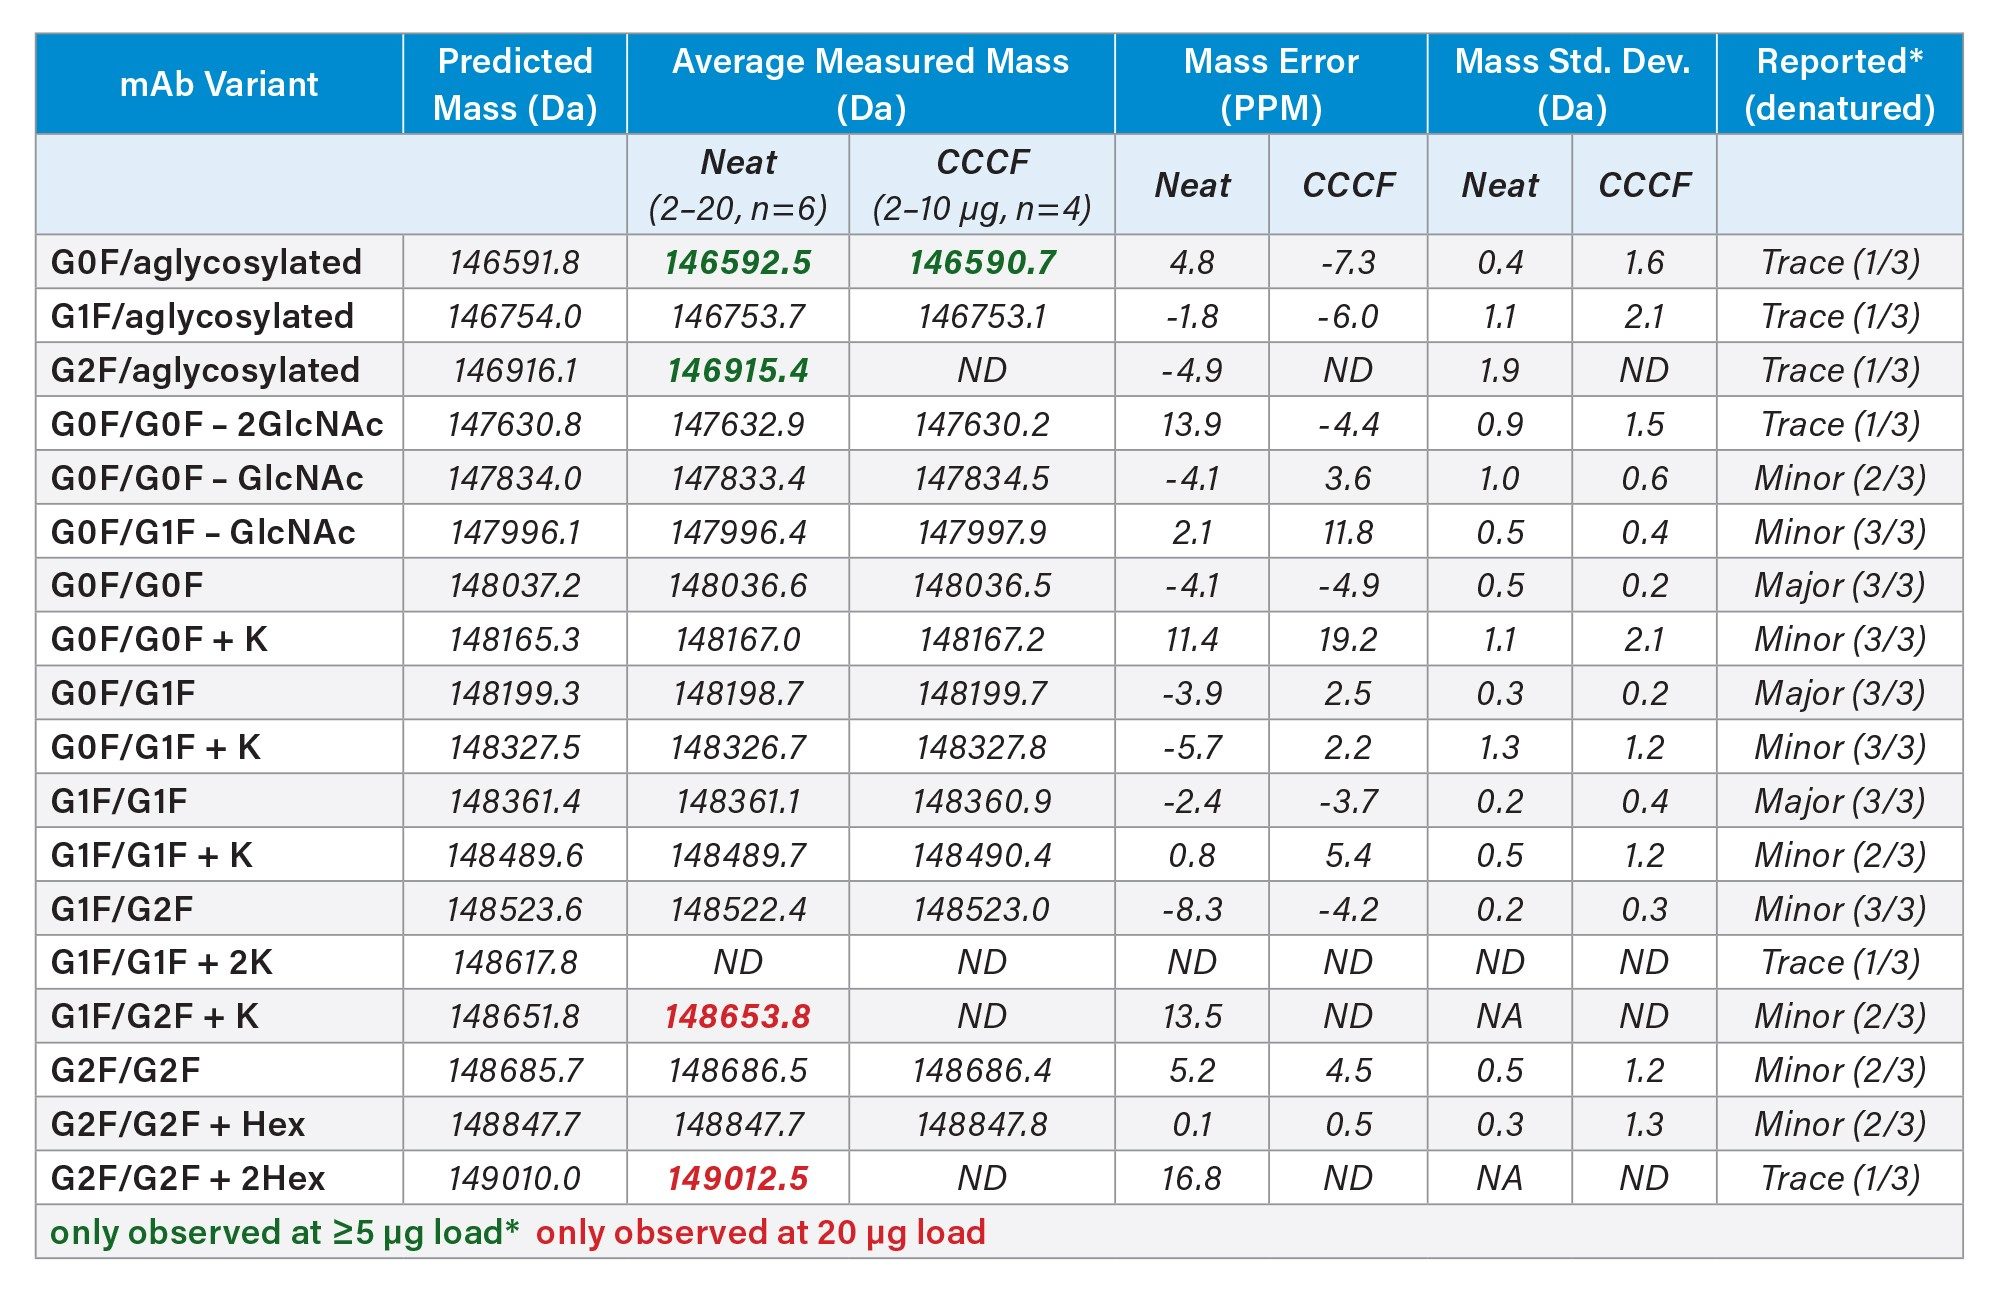
Further comparisons of the ProA-MS data to the previously reported intact NISTmAb variants are presented in Table 1.7 Variants observed by ProA-MS within a mass error of 20 PPM were considered positively identified. Also shown in Table 1 are the number of labs that identified a given variant out of the three labs that contributed to the NIST study. The majority of the reported variants were identified with the ProA-MS method, at sample loads of 2 µg, with a few of the lowest level variants requiring minimal loads of 5 µg or 20 µg. Consistent with the lower s/n observed for the CCCF-diluted sample, the G2F/aglycosylated variant could not be positively identified in the CCCF sample at a 10 µg load, while that variant was identified at a 5 µg load in the neat NISTmAb sample.
Collectively, these data demonstrate the capability of this ProA-MS method to identify and monitor both high and low abundance intact mAb variants directly from cell culture samples. Further optimization of both the ProA and MS conditions could also be considered to improve these capabilities.
Titer Determination
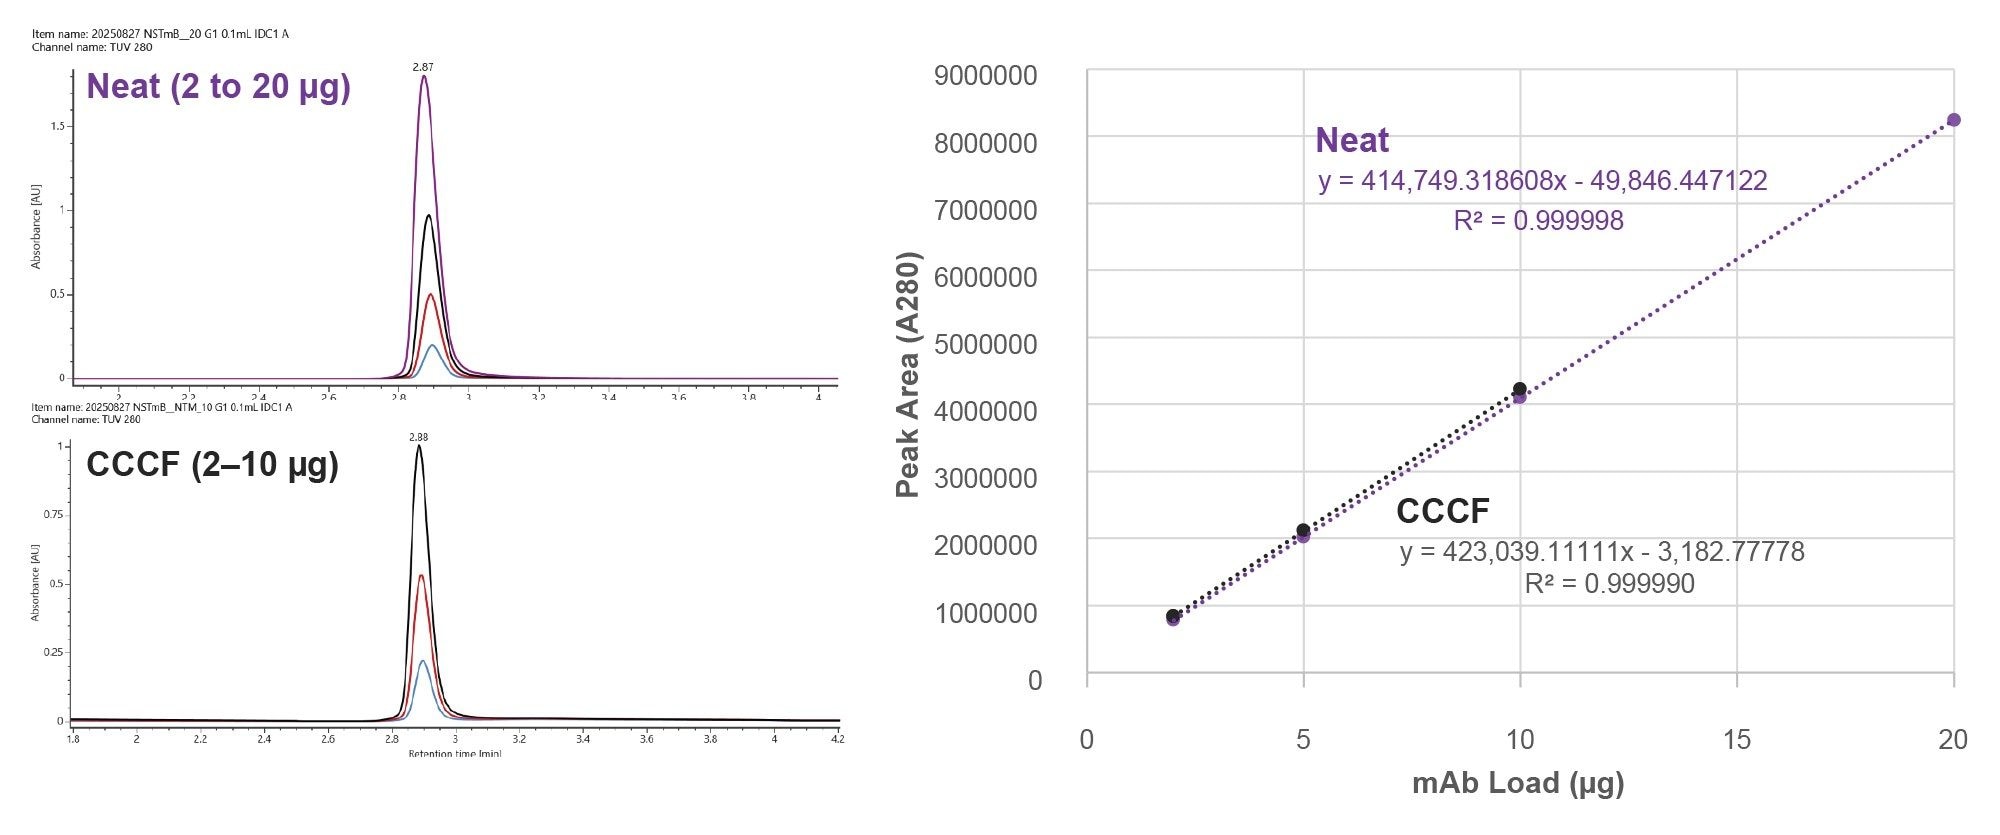
The A280 titer determination capabilities of this ProA column have been reported.8 Accordingly for this study, the fit-for-purpose recoveries and linearity of this HT ProA-MS method were confirmed. Chromatographic overlays and A280 peak area linear responses for NISTmAb analyzed both neat and diluted into CCCF are shown in Figure 3. Linear responses were observed with percent residual values ranging from -0.17% to 0.21% for neat NISTmAb sample and from -0.39% to 0.39% for the CCCF diluted NISTmAb. The average percent recovery of NISTmAb was 105% when comparing the CCCF diluted NISTmAb samples to the same load of the neat samples, indicating potential low-level interference from components in the CCCF sample matrix. Additional wash steps, higher AMA concentrations, or the addition of a low concentration of organic modifier (e.g. acetonitrile or IPA) could further reduce these interferences.
Conclusion
This study demonstrates the exceptional quality of HRMS data that can be realized when using a high efficiency ProA column (3.5 µm, 2.1 x 20 mm) for the ProA-MS intact native analysis of mAb and potentially other Fc-based protein constructs directly from CCCF samples within an analysis time of 4 minutes. In addition, when deploying an optical (A280) detector along with an HRMS detector, product titer in CCCF can also be determined.
References
- Dunham, W. H., Mullin, M., and Gingras, A-C. Affinity‐purification coupled to mass spectrometry: Basic principles and strategies. Proteomics 12.10 (2012): 1576–1590.
- Jakes, C., et al. Rapid analysis of biotherapeutics using protein A chromatography coupled to orbitrap mass spectrometry. Analytical Chemistry 93.40 (2021): 13505–13512.
- Cotham, V. C., et al. A generic platform to couple affinity chromatography with native mass spectrometry for the analysis of therapeutic monoclonal antibodies. Journal of Pharmaceutical and Biomedical Analysis 228 (2023): 115337.
- Koza, S. M., Shiner, S., Lauber, M. A. A Trap & Elute Style 2D Protein A–SEC Heart-Cut Method for the Analysis of Monoclonal Antibody Titer and Size Variants in Cell Culture. Waters Application Note. 720008902 (2025).
- Koza, S. M., et al. An Easy-to-Execute Direct-Connect 2D Protein A–SEC Method for the Analysis of Monoclonal Antibody Titer and Size Variants in Cell Culture. Waters Application Note. 720008780 (2025).
- Koza, S. M., et al. Extended Gradients with Efficient Protein A Columns for the ProA-MS Analysis of mAb and msAb Variants. Waters Application Note. 720009041 (2025).
- Formolo, T., et al. Determination of the NISTmAb primary structure. In State-of-the-art and emerging technologies for therapeutic monoclonal antibody characterization, volume 2. Biopharmaceutical characterization: the NISTmAb case study (pp. 1–62). American Chemical Society (2015).
- Koza, S. M., Shiner S., Lauber, M. A. Lowering Quantitation Limits for mAb Titer Measurements Using Small Volume 3.5 µm Particle-Size Protein-A Affinity Columns. Waters Application Note. 720008775 (2025).
720009210, January 2026