An Easy-to-Execute Direct-Connect 2D Protein A–SEC Method for the Analysis of Monoclonal Antibody Titer and Size Variants in Cell Culture
Stephan M. Koza, Beatrice Muriithi, Steve Shiner, and Matthew A. Lauber
Waters Corporation, United States
Published on May 26, 2025
Abstract
A simplified Protein A and size-exclusion chromatography direct-connect two-dimensional (2D) method (ProA-SEC) that does not require switching valves or a second LC pump is presented for the direct evaluation of monoclonal antibody (mAb) titer and the relative high molecular weight and low molecular weight size variant levels (HMWS and LMWS) in cell culture conditioned media (CM) samples. The method uses a high-pressure capable and efficient small volume (70 µL) ProA column (3.5 µm, 2.1 X 20 mm) connected in series to the inlet of a highly inert and efficient SEC column (1.7 µm, 4.6 X 150 mm).
Analysis is performed in two steps. The mAb sample is loaded through ProA-SEC columns in the first step, binding the mAb and mAb size variants possessing ProA affinity sites. In the second step, once the sample components not captured by the ProA column have traversed through the SEC column, 10 µL of concentrated citric acid (pH 2) is injected to elute the ProA bound size-variants in a minimal peak volume (≤15 µL) that are then separated on the SEC column. Analysis time per sample is approximately 15 minutes and analytical performance metrics including linearity, recovery, and the veracity of the size variant determinations are addressed.
Benefits
- Simplified 2D ProA-SEC using a single-pump UHPLC system with an autosampler and UV detector, and the ProA and SEC columns are connected in series.
- 15-minute analysis of mAb titer, high molecular weight species (HMWS), and ProA binding low molecular weight species (LMWS) in cell culture samples.
Introduction
Analytical ProA affinity columns have been routinely used to monitor the titer of mAb and other Fc containing constructs such as fusion proteins and bi-specific antibodies in cell culture. In addition, ProA columns have also been deployed for online 2D purification in front of SEC to enable the direct size variant analysis of mAbs in cell culture by either connecting the two columns via switching valves or in series without switching valves.1–3 These 2D ProA-SEC configurations can allow for the direct analysis of both titer and certain size variants (HMWS and LMWS) that possess either an Fc domain or an Fab domain that has a VH3 region that can also bind to Protein A.
Here, we present a direct-connect 2D ProA-SEC method that makes use of a recently developed high efficiency, low volume ProA column that is packed with 3.5 µm non-porous particles in a 2.1 X 20 mm column configuration and is capable of operating at column pressures of 6000 PSI (414 bar). In addition, the metal surfaces of the column hardware and frits, and the packed particles for both the ProA and SEC columns are modified with hydrophilic MaxPeak™ High Performance Surfaces to minimize undesired protein-surface interactions under a broad range of conditions.4 For this direct-connect 2D ProA-SEC application, the 2.1 X 20 mm ProA column was paired with a 1.7 µm, 250 Å, 4.6 X 150 mm SEC column.
Analysis was performed via two sample injection events. The mAb sample was first loaded through the tandem ProA-SEC columns binding the mAb size variants with ProA affinity. Once the sample components not captured by the ProA column had traversed through the SEC column, 10 µL of concentrated citric acid (pH 2) was injected to elute the ProA bound mAb size-variants in a minimal volume (≤15 µL). The size-variants were then separated on the SEC column with a total analysis time of approximately 15 minutes per sample.
The method was assessed for mAb titer in addition to ProA-binding HMWS and LMWS size-variant abundance determinations over a range of NISTmAb and trastuzumab concentrations spiked into separate sets of clarified CHO cell conditioned media samples. Trastuzumab was selected since it has an additional ProA binding site in the Fab domain, while NISTmAb does not.
Experimental
Method Conditions
LC Conditions
|
LC system: |
ACQUITY™ Premier QSM UPLC™ with TUV |
|
Columns & connector: |
BioResolve™ Protein A Affinity Column, MaxPeak Premier, 3.5 µm, 2.1 x 20 mm (p/n: 186011369) ACQUITY Premier Protein SEC Column, 250 Å, 1.7 µm, 4.6 x 150 mm (p/n: 186009963) 0.005" X 1.75" UPLC SEC Connection Tubing (p/n: 186006613) |
|
Column temperature: |
ambient |
|
Sample temperature: |
6 °C |
|
Injection volume: |
10 µL or as indicated |
|
ProA loading and SEC mobile phase: |
Dulbecco’s PBS at 2X concentration, pH 7.4 (0.1 µm sterile-filtered) |
|
ProA elution mobile phase: |
100 mM citric acid (10 µL injection volume) |
|
Flow rate: |
0.30 mL/min |
|
UV absorbance: |
280 nm, 20 points/sec |
|
Data management: |
Empower™ Chromatography Data System |
Results and Discussion
It has previously been reported that low HMWS recovery and method-induced HMWS can be significant challenges for samples analyzed by 2D ProA-SEC.3 Therein the results further highlighted that compromises between HMWS recovery and the generation HMWS artifacts may be difficult to circumvent when developing a direct-connect 2D ProA-SEC method, concluding that while ProA-SEC determinations of HMWS can be precise, they are best used comparatively.
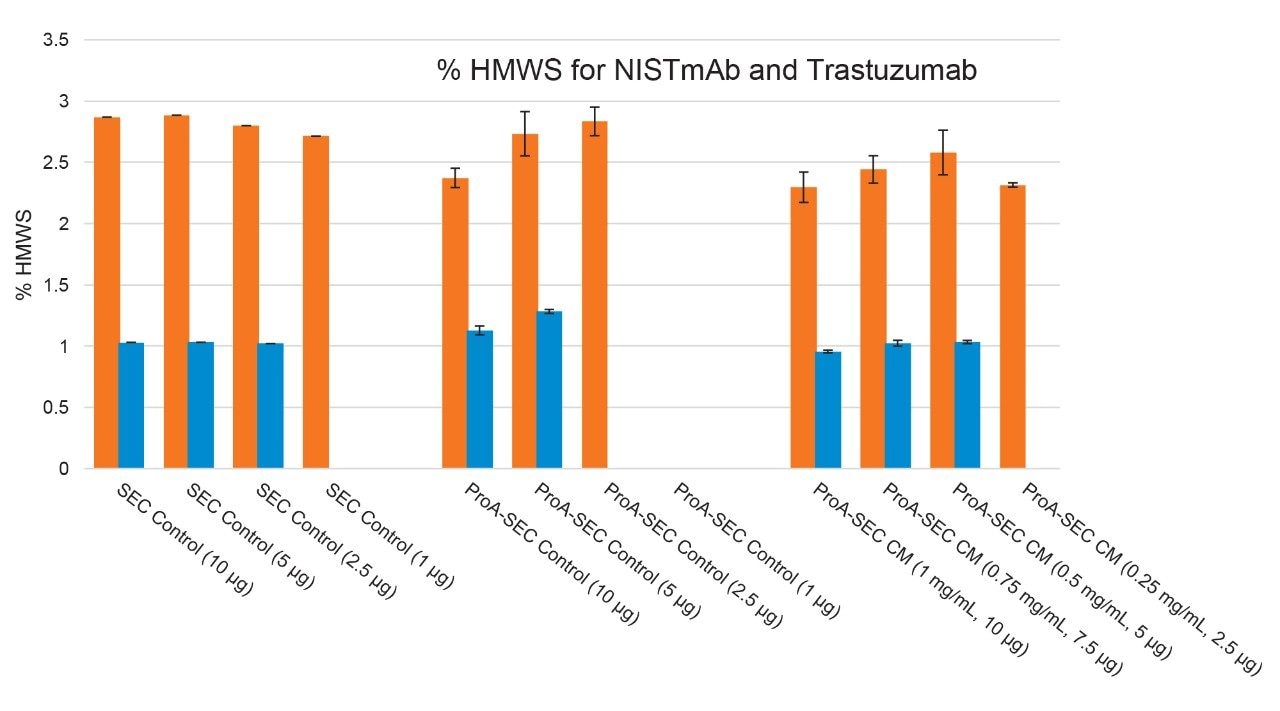
The performance of direct-connect 2D ProA-SEC for the determination of HMWS levels in NISTmAb and trastuzumab are shown in Figure 1 and the relative amounts of HMWS for the series of samples tested are provided in Figure 2. For the direct connect 2D ProA-SEC method, the relative abundances of HMWS for the same control samples were lower for the ProA-SEC method versus SEC alone for NISTmAb. For trastuzumab, the relative abundances of HMWS were higher for the ProA-SEC method versus SEC alone for the same control samples. The higher trastuzumab HMWS level for the ProA-SEC method is indicative of some level of method-induced HMWS formation. Further study is required to elucidate the extent to which this method recovers HMWS and induces HMWS formation for both NISTmAb and trastuzumab.
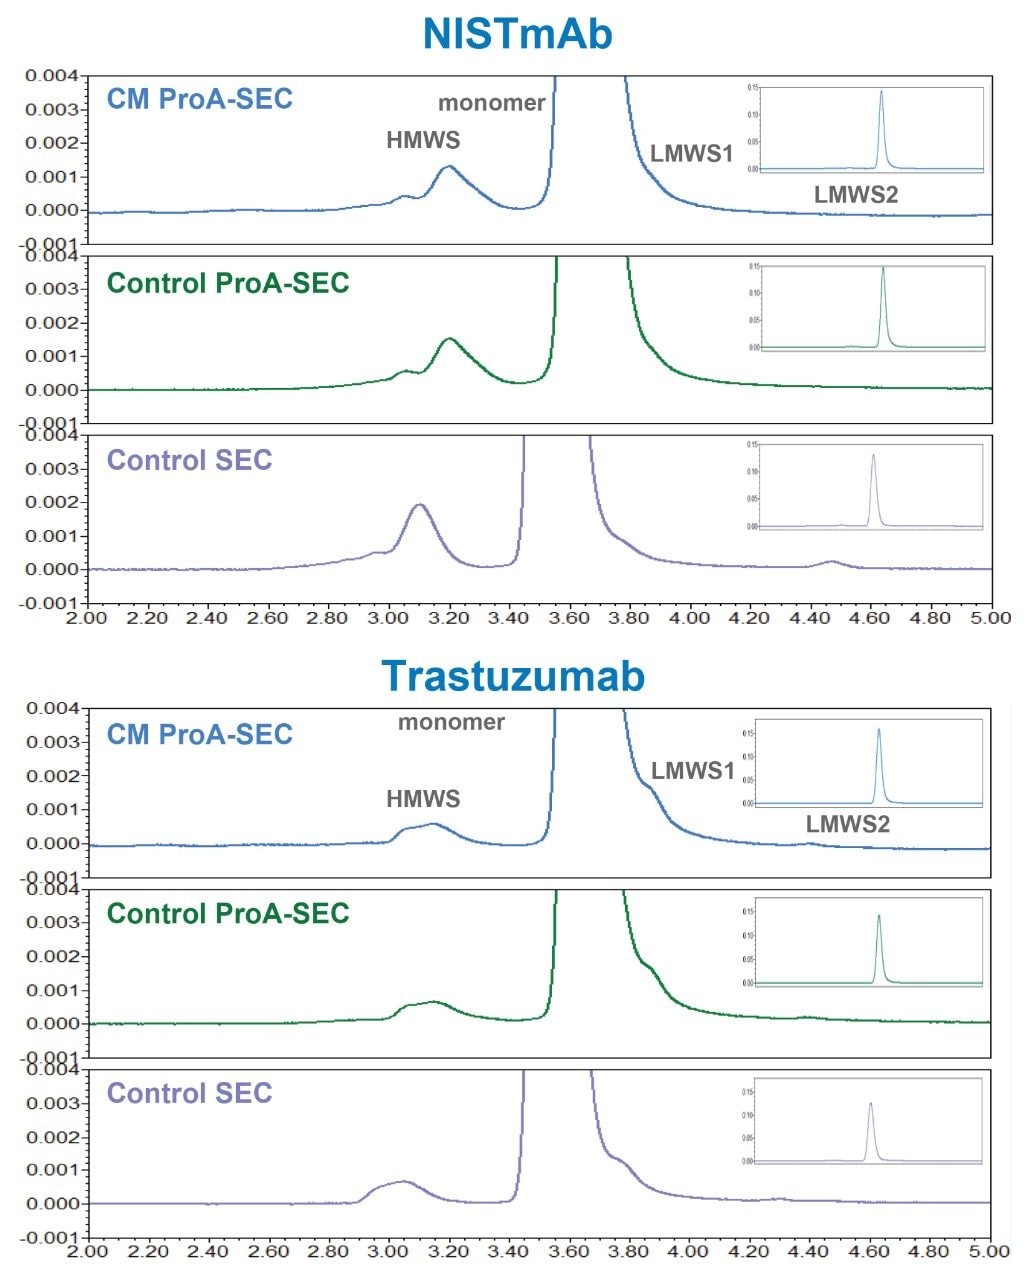
An interesting observation could also be made for LMWS. While LMWS1 (100 KDa, mAb minus 1 Fab) is observed in the direct-connect 2D ProA-SEC profiles for both mAbs, LMWS2, which is predominantly Fab, is only observed in the ProA-SEC profile of trastuzumab, which is consistent with the Fab of trastuzumab possessing a ProA binding site. LMWS1 was not resolved well enough and LMWS2 was too low in abundance to quantify, however, significant increases in either LMWS should be readily observed.
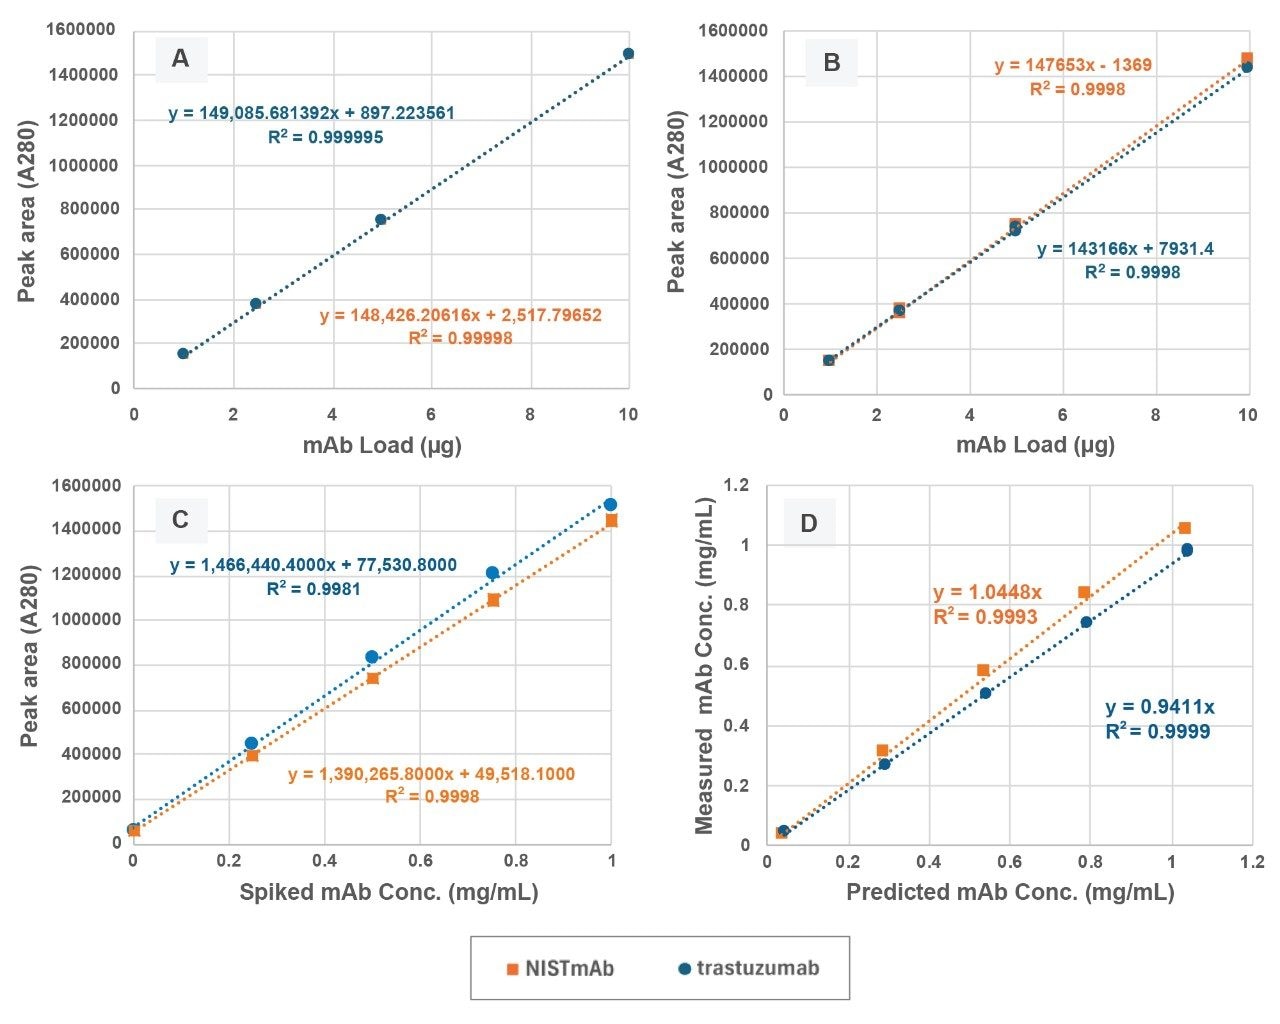
In addition to size variant analysis, direct-connect 2D ProA-SEC can also provide mAb titer, or more specifically monomer titer, for CM samples. Initial evaluation of the method included a comparison of the SEC only and direct-connect 2D ProA-SEC calibration curves for purified NISTmAb and trastuzumab (Figures 3A and 3B). Here we see that the slopes for the direct-connect 2D Pro-SEC curves are slightly shallower than the slopes for the SEC curves. This can be attributed to the fact that average recoveries from these direct-connect 2D analyses were 98.6% for NISTmAb and 97.8% for trastuzumab. Both analyses demonstrated useful linearity with maximum percent residuals over the mAb loading range (1.0 µg to 10.0 µg) of 1.5% for SEC and 3.3% for ProA-SEC.
This ProA-SEC method was also evaluated for its applicability using mock cell culture media (CM) samples. The mock CM samples were prepared by spiking purified NISTmab or trastuzumab at concentrations of 1.0, 0.75, 0.50, and 0.25 mg/mL into a clarified CHO cell CM sample containing ~0.04 mg/mL trastuzumab and with ~90% cell viability (Figure 3C). In this study, the endogenous mAb was treated as an unknown for demonstration purposes. These standard additions curves (Figure 3C) were found to be linear for spikes between 0.25 and 1.00 mg/mL with maximum percent residuals of 1.8% for NISTmAb and 3.1% for trastuzumab. Based on the standard additions curves (-X intercept) the concentrations of endogenous mAb in the un-spiked CM were measured as 0.036 mg/mL for NISTmAb and 0.053 mg/mL for trastuzumab with average percent residuals of 17% and 26%, respectively.
Correlation plot slopes between the predicted mAb concentrations in the mock CM samples and the measured concentrations were 1.04 for NISTmAb and 0.94 for trastuzumab indicating minimal bias in the analyses (Figure 3D). Predicted values were calculated based on the results of the levels of endogenous mAb from the standard additions curves while measured values were determined using the direct-connect 2D ProA-SEC calibration curves (Figure 3B). Deviations from the ideal slope value of 1.00 can be due to the stability of the mAb in CM as well as interactions of the mAb with components of the CM, such as surfactants, DNA and RNA, and host-cell proteins, as well as variations in dilutions of the CM samples.
Conclusion
An effective and easy-to-execute direct-connect 2D Pro-SEC methodology using a standard UHPLC system is presented for analyzing clarified CHO cell culture samples. It supports both mAb titer and comparative evaluation of size variant (HMWS and LMWS) abundances. However, verification of recovery and method-induced HMWS should be considered within the scope of a molecule-specific program. The benefits of this approach are:
- Uncomplicated direct-connect 2D ProA-SEC setup for increased reliability versus 2D methods using switching-valves, dual-pumps, and holding loops.
- Reproducible titer and comparative HMWS abundances for mAbs.
- The capability to track and potentially quantify mAb LMWS that exhibit ProA affinity binding.
- Applicable to other constructs with ProA affinity such as fusion proteins and multispecific mAbs.
- A total analysis time of approximately 15 minutes per sample.
References
- Lemmerer, M., London, A.S., Panicucci, A., Gutierrez-Vargas, C., Lihon, M. and Dreier, P. Coupled Affinity and Sizing Chromatography: A Novel In-Process Analytical Tool to Measure Titer and Trend Fc-Protein Aggregation. Journal of Immunological Methods, 393(1–2), pp.81–85. 2013.
- Gjoka, X., Schofield, M., Cvetkovic, A. and Gantier, R. Combined Protein a and Size Exclusion High Performance Liquid Chromatography for the Single-Step Measurement of Mab, Aggregates and Host Cell Proteins. Journal of Chromatography B, 972, pp.48–52. 2014.
- Dunn, Z.D., Desai, J., Leme, G.M., Stoll, D.R. and Richardson, D.D. Rapid Two-Dimensional Protein-a Size Exclusion Chromatography of Monoclonal Antibodies for Titer and Aggregation Measurements From Harvested Cell Culture Fluid Samples. In MAbs (Vol. 12, No. 1, p. 1702263). Taylor & Francis. January, 2020.
- Lavelay Kizekai, Stephen J. Shiner, Matthew A. Lauber. Waters ACQUITY and XBridge Premier Protein SEC 250 Å Columns: A New Benchmark in Inert SEC Column Design. Waters Application Note. 720007493, January 2022.
KANJINTI is a registered trademark of Amgen Inc.
720008780, May 2025