Development of a Multiproduct Method for Analysis of Cholesterol-Lowering Drugs by UltraPerformance Convergence Chromatography (UPC2)
Abstract
In this work, we described the steps of a method development based on design of experiments approach using the ACQUITY UltraPerformance Convergence Chromatography (UPC²) System. The studied compounds belong to statin class, used for lowering high cholesterol blood serum levels. Ezetimibe was added due to its combination with statins in several drug formulations. Firstly, a set of five columns were evaluated in different modifiers and sample diluents. The ACQUITY UPC² column-designed Torus 1-aminoanthracene (1-AA) showed the best performance to separate all analytes. Subsequently, a central composite design (CCD) was employed to evaluate the influence of pressure, temperature, and modifier amount on the separation as fine-tuning parameters. A final chromatographic condition with Torus 1-AA Column, ethanol-water (95:5) as modifier, acetonitrile-ethanol (3:2) as diluent, flow rate of 1.80 mL min-1, temperature oven of 42 °C, backpressure regulator of 2175 psi and gradient run from 5% to 15.5% of modifier in 4 minutes provided the best separation with minimum resolution of 2.0 for the critical pairs. The method was validated according to the Brazilian regulatory agency (ANVISA), providing r > 0.99; accuracy ranged from 95% to 105% and precision was not greater than 4.4% (both intra- and inter-day), which was acceptable according to the concentration of the analytes.
Benefits
- A fast ACQUITY UPC2 method to analyze cholesterol-lowering drugs
- Analysis of acidic cholesterol-lowering drugs using a reduced amount of ethanol, an eco-friendly solvent, without the need for additives in the mobile phase
- The use of carbon dioxide as the primary mobile phase reduces organic solvent consumption
Introduction
A panel performed by World Health Organization in 2016 indicated that the main cause of death worldwide is the ischemic heart disease, followed by stroke, mostly in high-income countries.1 These diseases are related to an increased cholesterol level in blood serum. Statins are known to reduce cholesterol levels as they inhibit the action of hydroxymethylglutaryl coenzime-A (HMG-CoA) reductase into the syntheses of cholesterol in the hepatocytes.2 Thus, statins are widely used in treatment of hypercholesterolemia. Some therapies do not properly reduce cholesterol levels by inhibiting the action of HMG-CoA, therefore the association of a statin with ezetimibe, a drug that reduces the cholesterol uptake in the small intestine, has been successfully used.3
Usually, a method is developed for each statin or its association with ezetimibe.4–7 Reversed-Phase Liquid Chromatography (RP-LC) is mostly used for these pharmaceuticals with a large consumption of organic solvents (acetonitrile, methanol) and with the use of acidic additives. This work describes a fast method by Supercritical Fluid Chromatography (SFC) using sub-2-μm particles packed columns8 with lower solvent consumption and without the need of additives, in a multiproduct approach.9 The latter term refers to the development of a single method that may be used to several drugs regardless whether they are found in the same formulation or not.
SFC uses a supercritical fluid as mobile phase, normally carbon dioxide (CO2). The advantages of supercritical CO2 as mobile phase are low viscosity and high power of solvation, somewhere between gas and liquid phases, besides its greener claims.10 The improvement of delivering the pressurized CO2 and a robust pressure control to stabilize the supercritical fluid with an Automated Backpressure Regulator (ABPR) were milestones for the renaissance of supercritical fluid chromatography as a competitive analytical technique. The addition of organic solvents (modifiers) to CO2 changes its inherent non-polar character, allowing the elution of more polar compounds.11 This fact associated with the launch of SFC-designed columns, along with reduced extra-column volumes and sub-2-μm particles, provided faster and more sensitive analysis, with separation efficiency as high or higher than Ultra-High Performance Liquid Chromatography.8
In the modern analytical method development, the modeling of the chromatographic responses as functions of experimental variables is highly encouraged by means of DOE (Design of Experiments) tools12, especially within the framework of Analytical Quality by Design.13 In this study, the parameters stationary phase, mobile phase modifier and sample diluent were firstly evaluated by a Multilevel Categorical Design and results were related to the chemical structure of the analytes (Part I). These are primary variables that impact selectivity, peak shape, and efficiency SFC.14 Then the method was optimized using a Central Composite Design (CCD) to study the parameters temperature, pressure and percentage of the modifier, which influence the elution strength15 aiming at the separation of all compounds as a multiproduct method (Part II).
Experimental
Part I
|
System: |
ACQUITY UPC2 System |
|
Detection: |
PDA Detector (detection at 240 nm) |
|
Columns: |
ACQUITY UPC2: 1) Bridged-Ethylend Hybrid (BEH); 2) High-Strength Silica Octadecyl-bonded (HSS C18); 3) Charged-Surface Hybrid PentaFluoro-Phenyl (CSH PFP); 4) Torus 1-Amino-Anthracene (1-AA) and 5) Torus 2-Picolylamine (2-PIC) |
|
Mobile phase A: |
CO2 (tank, medical grade) |
|
Mobile phase B: |
Ethanol:H2O 95:5 (0 – 30 % (v/v)) |
|
Column temperature: |
40 °C |
|
ABPR: |
1500 psi |
|
SM temperature: |
Room temperature |
|
Sample diluent: |
ACN:EtOH 3:2 (v/v) |
|
Injection volume: |
1 µL |
|
Flow rate: |
1.50 mL/min |
|
Vials: |
Waters Amber Glass 12x32 mm Screw Neck Vial, 2 mL |
|
PDA scan range: |
210 to 400 nm |
|
Strong needle wash: |
Methanol |
|
Weak needle wash: |
2-Propanol:Methanol 1:1 |
|
Seal wash: |
Methanol |
Part II
|
System: |
ACQUITY UPC2 System |
|
Detection: |
PDA Detector (detection at 275 nm) |
|
Column: |
ACQUITY UPC2 Torus 1-AA 2.1x50 mm, 1.7 µm (p/n: 186007623) |
|
Mobile phase A: |
CO2 (tank, medical grade) |
|
Mobile phase B: |
Ethanol:H2O 95:5 (v/v), end of the gradient varied according to the Central Composite Design (15.5–27.5 % in CO2) |
|
Column temperature: |
Varied according to the Central Composite Design (25–50 °C) |
|
ABPR: |
Varied according to the Central Composite Design (10.5–16.3 MPa) |
|
SM temperature: |
Room temperature |
|
Sample diluent: |
ACN:EtOH 3:2 (v/v) |
|
Injection volume: |
1 µL |
|
Flow rate: |
1.80 mL/min |
|
Vials: |
Waters Amber Glass 12 x 32 mm Screw Neck Vial, 2 mL |
|
PDA scan range: |
210 to 400 nm |
|
Strong needle wash: |
Methanol |
|
Weak needle wash: |
2-Propanol:Methanol 1:1 |
|
Seal wash: |
Methanol |
The maximum analysis time was set at 10 min to enable the separation to be performed at a reasonable time.
Sample Description
Simvastatin, Lovastatin, Rosuvastatin calcium, Fluvastatin sodium, Atorvastatin calcium, and Ezetimibe were purchased as secondary pharmaceutical standards from Sigma-Aldrich (Missouri, EUA). Pravastatin sodium and Pitavastatin calcium were purchased from Cayman Chemicals (Michigan, EUA) with purity equals to or higher than 98%. For all experiments, a mixture of the standards was prepared in ACN:EtOH 3:2 v/v in a concentration of 0.5 mg/mL and filtered through a 0.22 μm syringe filter prior to the injection. Commercial products of Brazilian market were acquired in local drugstores.
Results and Discussion
Part I: Selection of the stationary phase and the organic modifier
The first step of the method development consisted in the selection of a suitable stationary phase. Apart of simvastatin, lovastatin, and ezetimibe, the other analytes are likely in the anionic form. It is due their pKa values are below 5 and CO2-based mobile phases with alcoholic modifier are said to present a apparent pH around 5 to 6.16
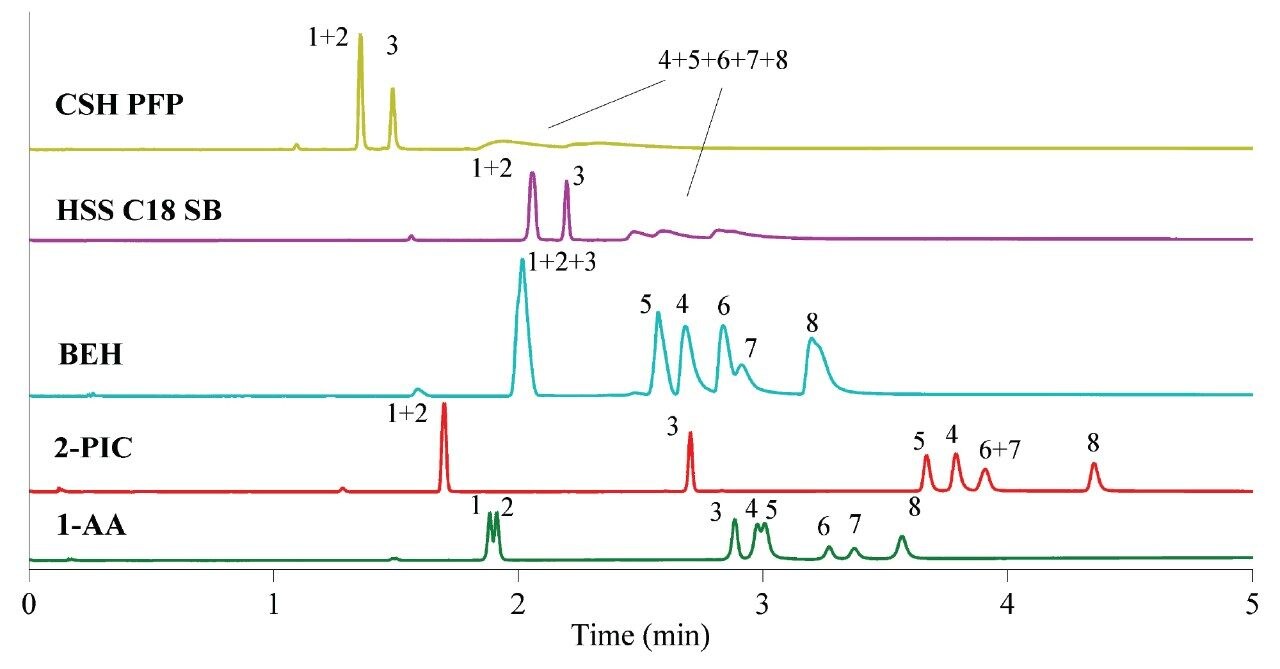
As shown in the Figure 1, ACQUITY UPC2 Torus 1-AA and Torus 2-PIC Columns performed well for the anionic and the neutral species simvastatin, lovastatin, and ezetimibe without the need of additives. Other columns did not elute anionic analytes with appropriate peak shapes, probably due to the repulsion to the silanol groups. These results were in accordance with a study of classification for stationary phases for SFC.16,17 Moreover, Torus 1-AA was the only column capable of providing a slight separation of simvastatin (1) and lovastatin (2).18 The complete separation is unlikely since the molecules differ in only one methyl group.
Initial screening was performed with gradient elution ranging from 0% to 30% of organic modifier in 5 minutes. The use of alcohols such as methanol, ethanol, and isopropanol showed minor changes on selectivity while acetonitrile as modifier was not adequate because of longer run times and immiscibility with supercritical CO2 in amounts as high as 30%. Ethanol was selected for further method development due to its lower toxicity. After that, the initial composition of the gradient elution was changed to 5% and the final composition was reached at 25% in 4 minutes in order to maintain the same gradient slope as in 0–30% gradient elution for 5 minutes. The higher concentration in the start of gradient elution decreases adsorption of mobile phase, thus increasing elution strength.
The injection volume was kept in 1.0 µL and solutions were prepared in ACN:EtOH 3:2 (v/v) as diluent. Weak solvents should be preferred as diluents to minimize solvent interaction towards stationary phase in supercritical fluid chromatography. This is the reason why a mixture of weaker solvent acetonitrile and ethanol was used instead of a stronger solvent, e.g., methanol. Besides, the acetonitrile/ethanol mixture provided a more stable solution for these analytes and was capable of solubilizing them at the same time.
The results of this step indicated the use of the following chromatographic conditions: Torus 1-AA Column, a starting gradient composition with 5% of modifier ethanol:water 95:5, 1.0 µL of injection volume and ACN:EtOH 3:2 (v/v) as the diluent.
Part II: Study of the density of the supercritical fluid by DoE
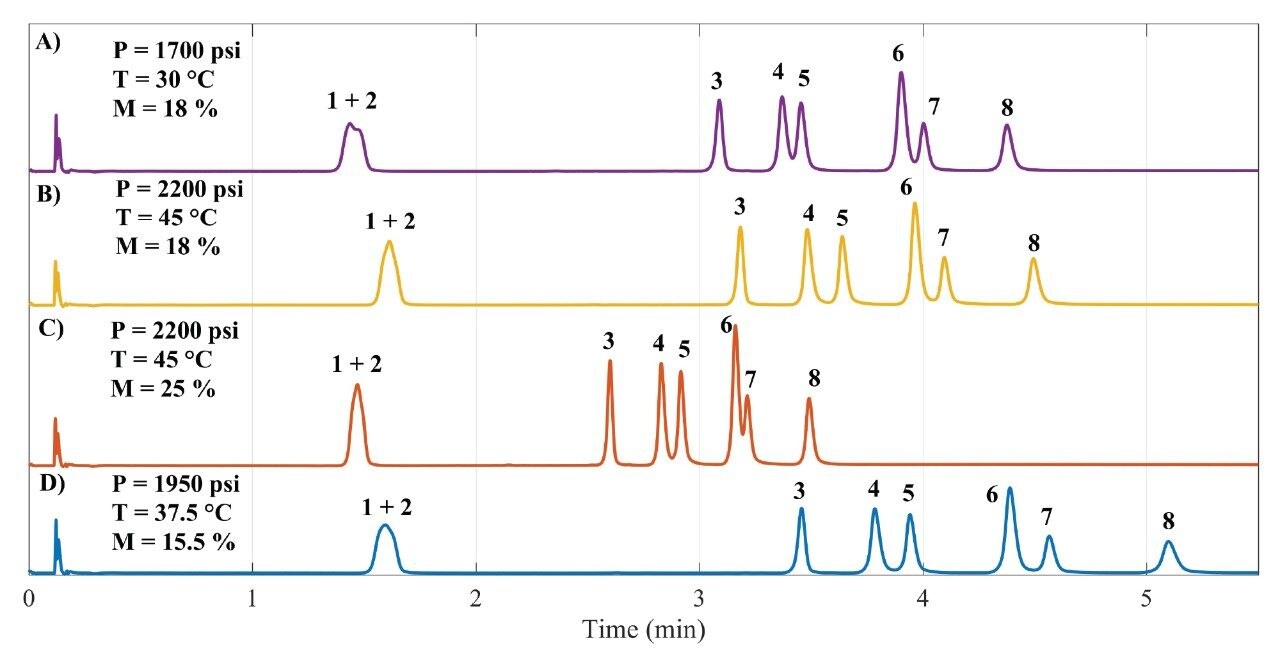
A Central Composite Design (CCD) was used to study the density of the supercritical fluid which is influenced by the parameters pressure, temperature and modifier percentage. Thus, a full factorial 2³ was employed along six axial points, plus center point (measured in five replicates). This setting enabled to expand the knowledge space with fewer experiments.19 Figure 2 shows four out of nineteen chromatograms illustrating the different profiles obtained by changing the factors. Figures 2A and 2B show slight differences between the elution profiles, however the separation shown in Figure 2B is superior. In both cases, the modifier content at the end of gradient elution was the same (18%), but results shown in Figure 2B were obtained in higher pressure (2200 psi) and temperature (45 °C) conditions, which allowed to achieve resolution between RSV/FLV and PRV/PTV higher than 1.5.
Furthermore, when modifier content was set to 25% (Figure 2C), the elution was faster but PRV and PTV strongly overlapped. In another condition, with average pressure and temperature (1950 psi and 37.5 °C, respectively) but in the lowest modifier content used (15.5%), resolution between the critical pairs RSV/FLV and PRV/PTV was as high as 2.0. The chromatograms described by Figure 2B and Figure 2D provided the best separation profiles. These chromatograms indicated that a robust method can be achieved in lower modifier content and higher pressure and temperature. The percentage of the modifier was the most influencing parameter, decreasing the retention times and providing higher solubility of the compounds in the mobile phase.
EZT and ATV presented adequate resolution regardless the condition; SMV and LOV were not separated in any condition due to their high similarity (one CH3 group, as mentioned before). Thus, CCD was focused in studying the separation between critical pairs RSV/FLV and PRV/PTV. Separation factor (α) was used as the response for modeling. In order to achieve resolution not less than 2.0, the separation factor needed was not less than 1.04 for the critical pairs. It is worth to mention that resolution greater or equal to 2.0 was used because the height ratio between PTV and PRV was around 2:1.20
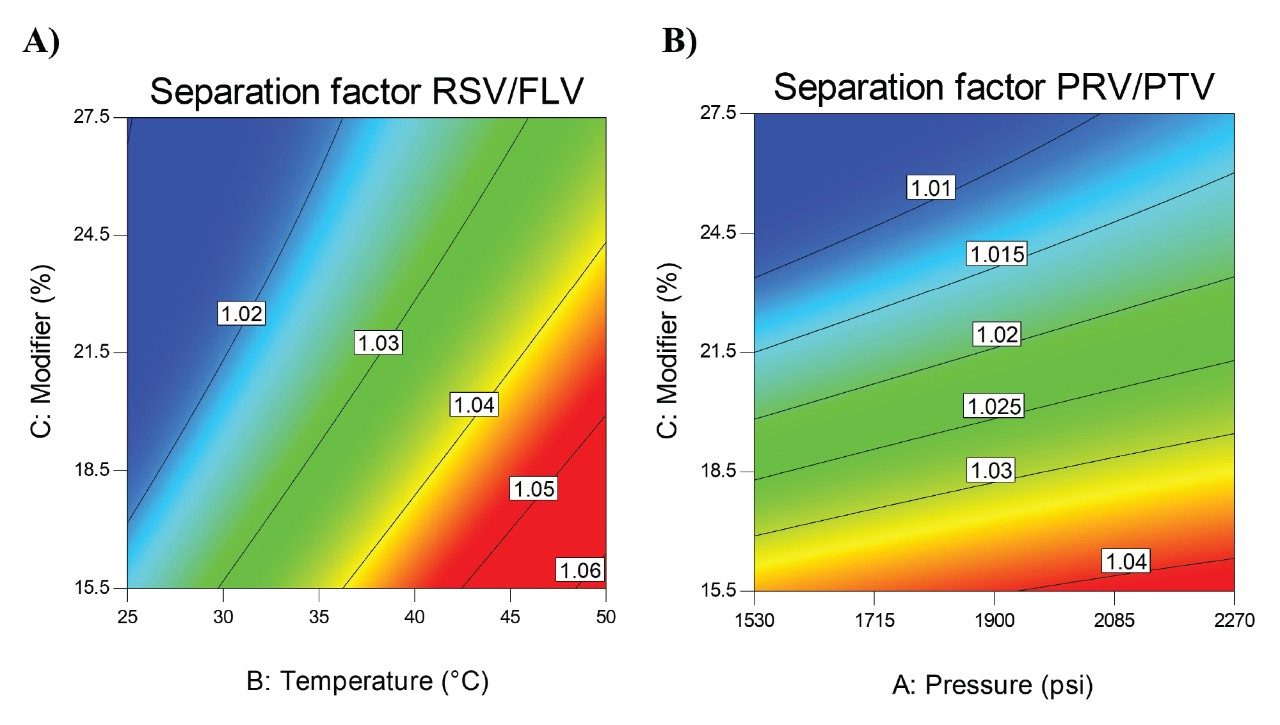
Interestingly, it was also observed that the separation between RSV and FLV was highly influenced by temperature (Figure 3A) whereas the separation between PRV and PTV was mostly influenced by pressure (Figure 3B), towards the red region. These influences were more pronounced in the lower content of the modifier when the mobile phase presents a higher content of CO2 and, therefore, the fluid is more compressible. In other words, it is expected higher influence of both temperature and pressure in the fluid parameters. This highlights the importance of using a multivariate approach to study the parameters that influence the separation properties under SFC conditions.
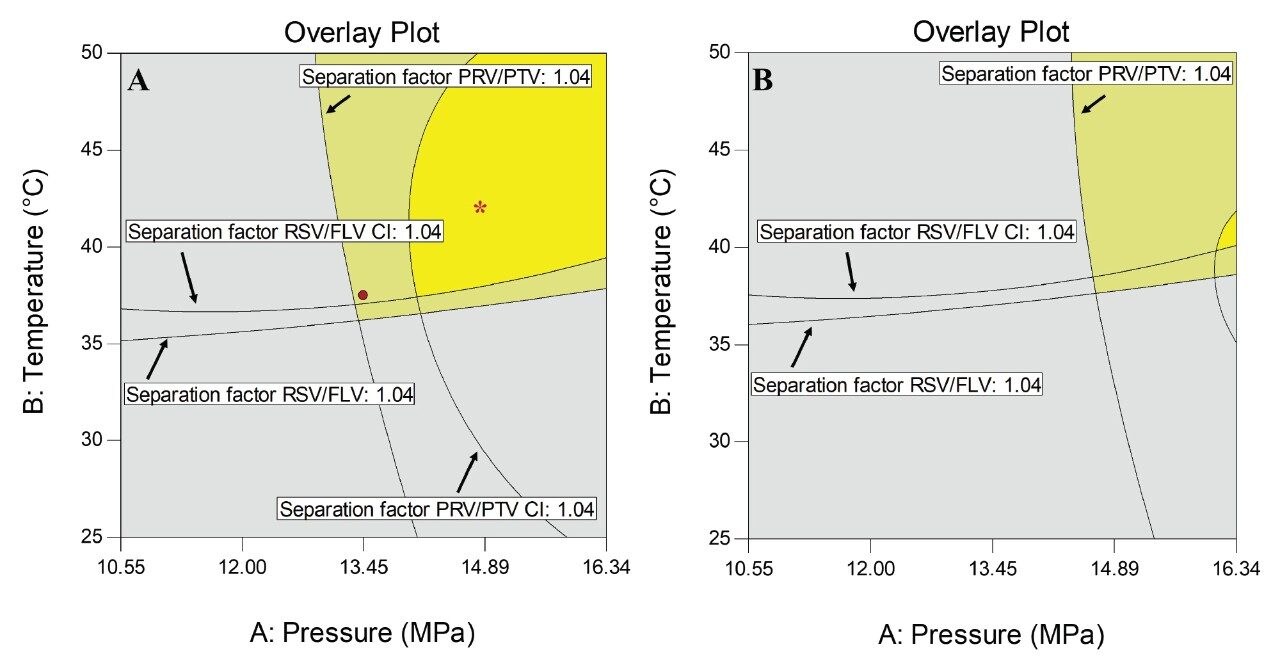
The overlay plot of the two critical pairs is shown in Figure 4 for 15.5% of organic modifier at the end of the gradient (Figure 4 A) and 16.0% (Figure 4B). The bright yellow region depicts the desired response region. The pale yellow region depicts the prediction uncertainty region (95% confidence intervals for the average predicted values). The regions colored in grey define unacceptable factor settings.
The selected method conditions for validation were temperature of 42 °C, pressure of 14.83 MPa, and gradient elution from 5% to 15.5% of modifier in 4 minutes, placed within the bright yellow region and indicated by an asterisk (*). The critical variable to achieve this separation is the percentage of the organic modifier in the mobile phase, as can be seen by comparing Figure 4A and 4B. This understanding was only possible by using the CCD modelling during method development.
In a final step, the flow rate was evaluated as an attempt to reduce the analysis time. A slight better resolution was observed between PTV and PRV peaks (Figure 5) because an increase in the flow rate also increases the overall pressure and, subsequently, a higher separation factor was obtained, as seen in Figures 3 and 4. Figure 5 shows the chromatograms of the initial flow rate (A, 1.50 mL min-1) and the selected flow rate (B, 1.80 mL min-1). A higher increase in the flow rate would be compromised by the pressure limit (upper limit of 41,4 MPa).
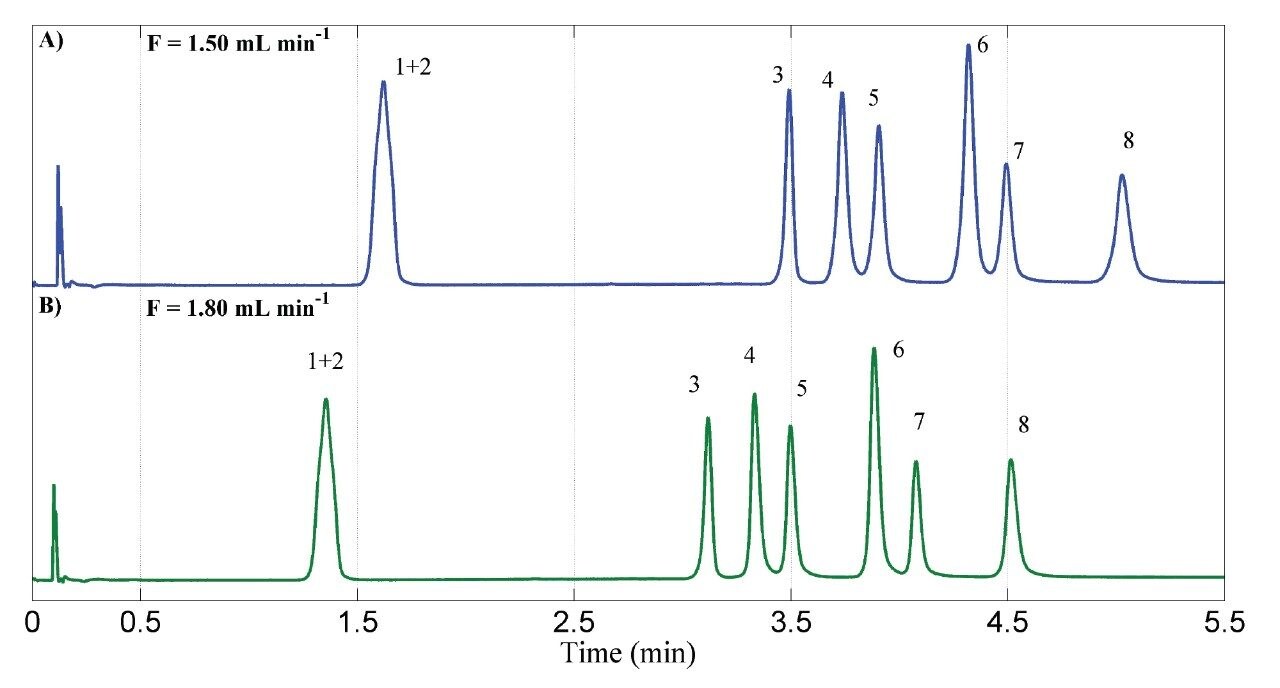
Therefore, the conditions of the optimized method were: Torus 1-AA Column, EtOH:H2O 95:5 v/v as modifier, flow rate of 1.80 mL min-1, pressure of 14.83 MPa, temperature of 42 °C, gradient elution from 5% to 15.5% of modifier for 4 minutes, keeping isocratic in 15.5% for additional 2 minutes and injection volume of 1.0 µL.18 In order to validate this method, pharmaceutical standards were used as discussed in the following section. Detection by PDA was set in the specific wavelength for each analyte, ranging from 231 nm to 244 nm.
Method Validation
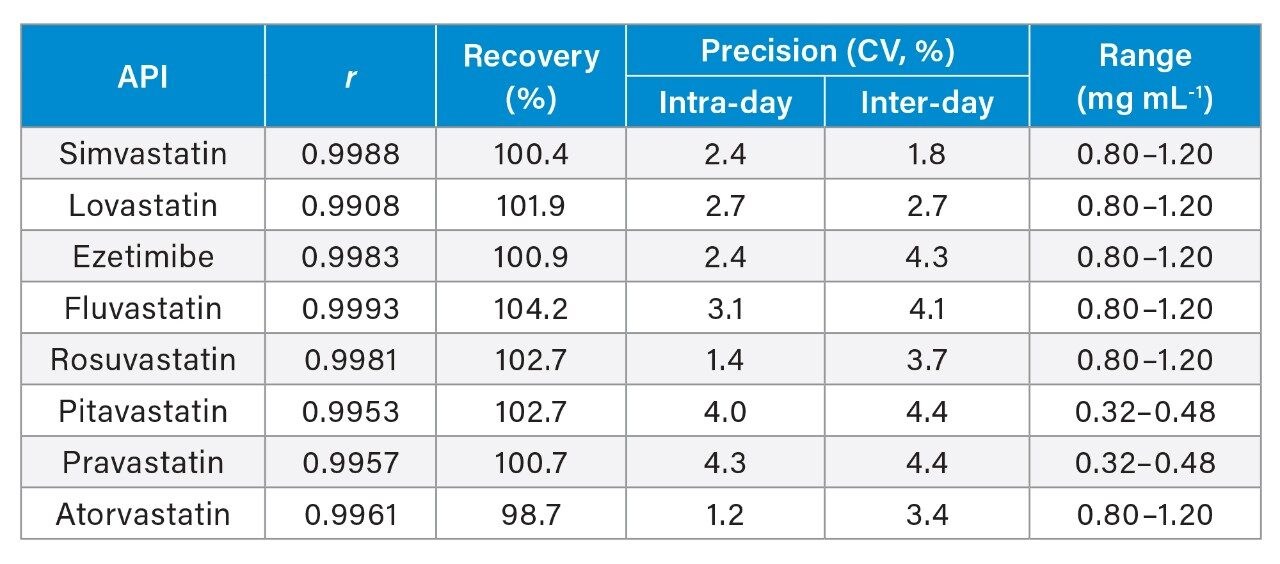
The method was validated according to the Brazilian most recent guideline.21 The first step was to evaluate the selectivity of the method by injecting solutions of the blank (diluent only), of placebo samples and standard solutions of the drugs. It was not observed any signal, except for the standards. Following that, the calibration curve was prepared by dilutions of three independently prepared stock solutions in five different levels. The concentration ranged from 0.80 mg mL-1 to 1.20 mg mL-1, except for PRV and PTV (from 0.32 mg mL-1 to 0.48 mg mL-1). Figures of merit evaluated for validation were linearity, accuracy in terms of recovery, and precision in terms of coefficient of variation for intra- and inter-day measurements. Limit of detection and limit of quantification were not evaluated since the method was only proposed for assay of the active pharmaceutical ingredient (API) in the final product.
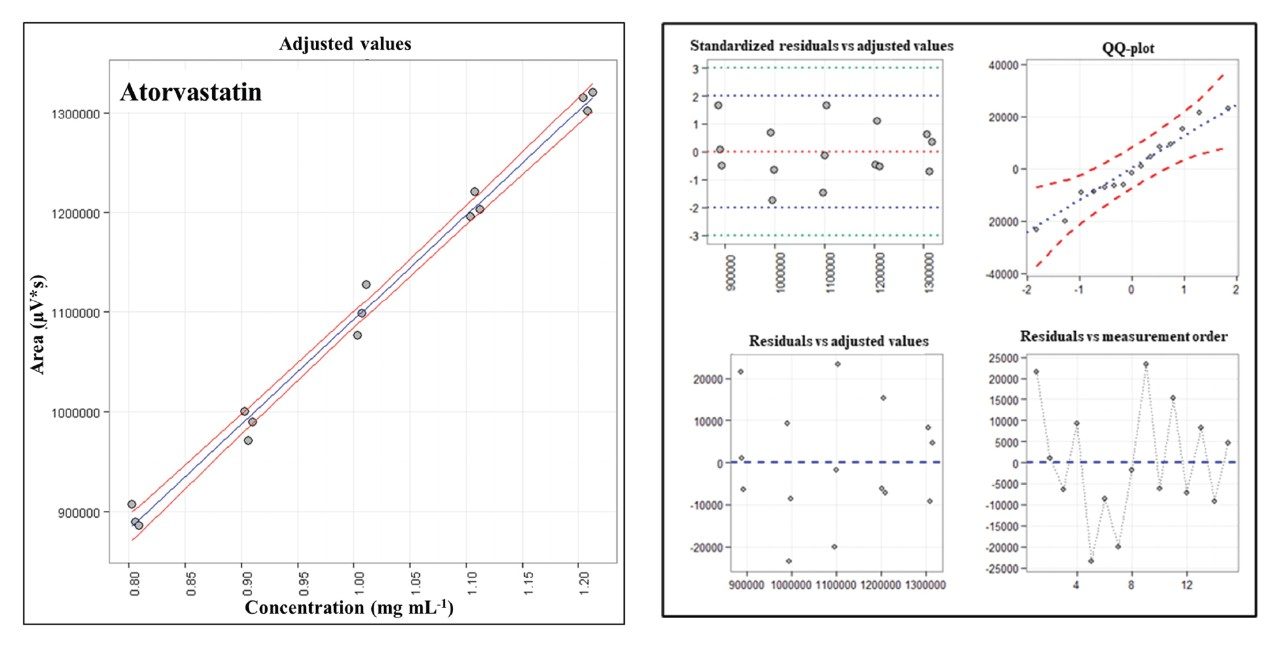
Linearity was measured as Pearson correlation coefficient (r), and the results were not lower than 0.99. Figure 6A shows the analytical curve for ATV as an example and Figure 6B shows the analysis of residuals for the corresponding regression. ATV was selected as representative since it represents Lipitor, the best-selling product in the history of pharmaceuticals. Table 1 summarizes the figures of merit obtained. Recovery and precision are shown only for 100% assay level. Based on Horwitz equation, a coefficient of variation is expected to be not higher than 5.4% for the concentration used. Recovery should be ranged from 95%–105%. All the levels tested were found within these ranges.
Conclusion
This work described the development and validation of an ACQUITY UPC2 method for the analysis of cholesterol-lowering drugs using the modern Torus 1-AA Column and a reduced amount of ethanol, an eco-friendly solvent, without the need for additives in the mobile phase. The sequential DoE approach provided decisive tools to reach the optimized method by understanding how the factors pressure, temperature and especially the modifier content influence the elution strength of a supercritical fluid and their effects on retention and separation of the analytes.
CCD results allowed understanding the effects of pressure, temperature, and percentage of organic modifier in the retention and separation of the analytes and selecting a robust working point for validation. The percentage of the organic modifier was the critical variable to be controlled to achieve the desired separation. The optimized method was validated according to the most recent Brazilian guideline for all the analytes. It was found to be accurate and precise, with r greater than 0.990, recoveries between 95%–105% and precision (intra- and inter-day) not greater than 4.4%. The assay analysis of eleven marketed products indicated that only one containing atorvastatin was out of USP specification. Therefore, ACQUITY UPC² was shown to be a greener alternative for the analysis of these pharmaceuticals.
References
- Global Health Estimates 2016: Deaths by Cause, Age, Sex, by Country and by Region 2000–2016, Geneva, World Heal. Organ. 2018.
- D.S. Kazi, J.M. Penko, K. Bibbins-Domingo, Statins for Primary Prevention of Cardiovascular Disease, Med. Clin. North Am. 101, 2017. 689–699. doi:10.1016/j.mcna.2017.03.001.
- S. Nodari, P. Rocca, A. Saporetti, L. Bettari, A.L. Foresti, E. Tanghetti, M. Metra, L. Dei Cas, The Combination of Ezetimibe and Statin: A New Treatment For Hypercholesterolemia, Heart Int. 3, 2007. 12. doi:10.4081/hi.2007.12.
- L. Nováková, D. Šatínský, P. Solich, HPLC Methods for the Determination of Simvastatin and Atorvastatin, Trends Anal. Chem. 27, 2008. 352–367. doi:10.1016/j.trac.2008.01.013.
- M.I. Beludari, K.V. Prakash, G.K. Mohan, RP-HPLC Method for Simultaneous Estimation of Rosuvastatin and Ezetimibe from their Combination Tablet Dosage Form, Int. J. Chem. Anal. Sci. 4, 2013. 205–209. doi:10.1016/j.ijcas.2013.04.006.
- M. Campos‐Lara, J.A. Mendoza‐Espinoza, Development of a Selective Extraction Method for Pravastatin Quantification in Tablets using HPLC with Ultraviolet Detection, J. Liq. Chromatogr. Relat. Technol. 31, 2008. 619–623. doi:10.1080/10826070701815288.
- T.D. Silva, M. a Oliveira, R.B. de Oliveira, C.D. Vianna-Soares, Development and Validation of a Simple and Fast HPLC Method for Determination of Lovastatin, Pravastatin, and Simvastatin, J.Chromatogr.Sci. 2012.
- L. Nováková, A. Grand-Guillaume Perrenoud, I. Francois, C. West, E. Lesellier, D. Guillarme, Modern Analytical Supercritical Fluid Chromatography Using Columns Packed With Sub-2-μm Particles: A tutorial, Anal. Chim. Acta. 824, 2014 18–35. doi:10.1016/j.aca.2014.03.034.
- L. Ferey, A. Raimbault, I. Rivals, K. Gaudin, UHPLC Method for Multiproduct Pharmaceutical Analysis by Quality-by-Design, J. Pharm. Biomed. Anal. 148 (2018) 361–368. doi:10.1016/j.jpba.2017.10.014.
- A. Grand-Guillaume Perrenoud, J.L. Veuthey, D. Guillarme, Comparison of Ultra-High Performance Supercritical Fluid Chromatography and Ultra-High Performance Liquid Chromatography for the Analysis of Pharmaceutical Compounds, J. Chromatogr. A. 1266, 2012. 158–167. doi:10.1016/j.chroma.2012.10.005.
- A. Tarafder, Metamorphosis of Supercritical Fluid Chromatography to SFC: An Overview, Trends Anal. Chem. 81, (2016) 3–10. doi:10.1016/j.trac.2016.01.002.
- D.B. Hibbert, Experimental Design in Chromatography: A Tutorial Review, J. Chromatogr. B. 910, 2012. 2–13. doi:10.1016/j.jchromb.2012.01.020.
- A. Dispas, P. Lebrun, B. Andri, E. Rozet, P. Hubert, Robust Method Optimization Strategy – A Useful Tool for Method Transfer: The Case of SFC, J. Pharm. Biomed. Anal. 88, 2014. 519–524. doi:10.1016/j.jpba.2013.09.030.
- V. Abrahamsson, M. Sandahl, Impact of Injection Solvents on Efficiency in Supercritical Fluid Chromatography, J. Chromatogr. A. 1306, 2013. 80–88.
- E. Lesellier, C. West, The many faces of packed column supercritical fluid chromatography - A critical review, J. Chromatogr. A. 1382, 2015. 2–46. doi:10.1016/j.chroma.2014.12.083.
- C. West, E. Lemasson, S. Bertin, P. Hennig, E. Lesellier, An Improved Classification of Stationary Phases for Ultra-High Performance Supercritical Fluid Chromatography, J. Chrtitomatography A. 1440, 2016. 212–228. doi:10.1016/j.chroma.2016.02.052.
- C. West, E. Lesellier, Characterisation of Stationary Phases in Subcritical Fluid Chromatography With the Solvation Parameter Model: III. Polar Stationary Phases, J. Chromatogr. A. 1110, 2006. 200–213. doi:10.1016/j.chroma.2006.01.109.
- I. M. Santana, I. C. S. F. Jardim, M. C. Breitkreitz, Sequential Design of Experiments Approach for the Multiproduct Analysis of Cholesterol-Lowering Drugs by Ultra-High-Performance Supercritical Fluid Chromatography, J. Sep. Sci., 43, 2020, 4234–4242. doi: 10.1002/jssc.202000702.
- P.K. Sahu, N.R. Ramisetti, T. Cecchi, S. Swain, C.S. Patro, J. Panda, An Overview of Experimental Designs in HPLC Method Development and Validation, J. Pharm. Biomed. Anal. 147, 2018. 590–611. doi:10.1016/j.jpba.2017.05.006.
- L.R. Snyder, J.J. Kirkland, J.L. Glajch, Practical HPLC Method Development, John Wiley & Sons, Inc., Hoboken, NJ, USA, 1997. doi:10.1002/9781118592014.
- Agência Nacional de Vigilância Sanitária, Resolução RDC 166. 2017.
Featured Products
720007390, November 2021