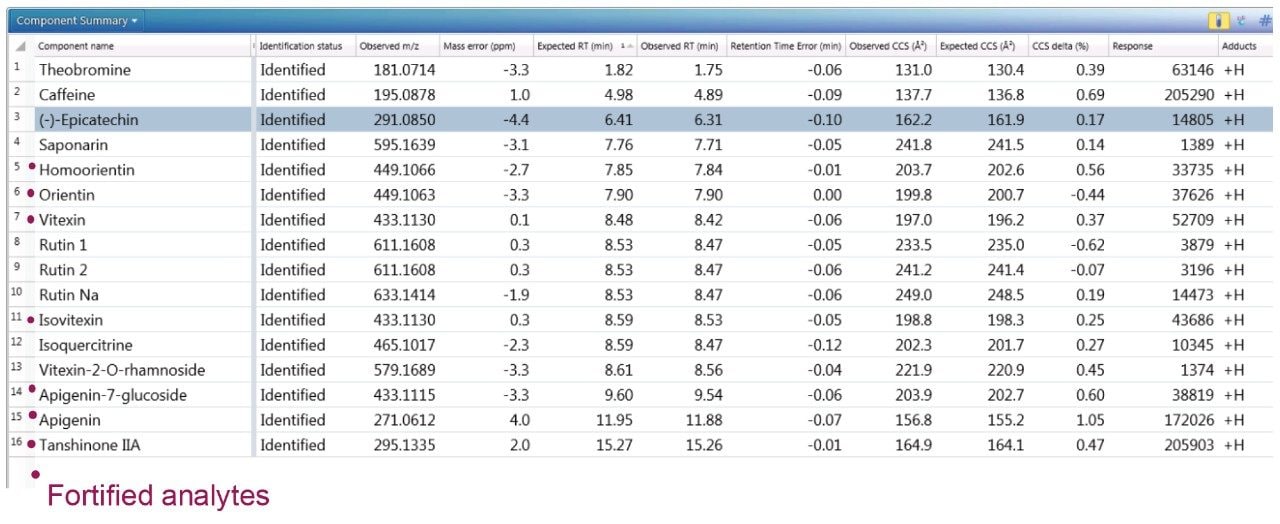
The use of the ion mobility mass spectrometry (MS) collision cross sections (CCS) as an additional cumulative metric has been discussed previously.1-5 CCS measurements have been shown to be robust and reproducible.6 The use of CCS for small molecule analysis has increased across multiple research areas including pharmaceutical (e.g., metabolism, metabolomics, lipidomics) and food safety (e.g., veterinary drugs, mycotoxins, steroids, steviol glycosides, natural product screening, natural toxins). In these research areas, generation of CCS searchable libraries allows the application of a CCS metric which can increase the specificity of identification, and consequently can be used to decrease the false detection rate.
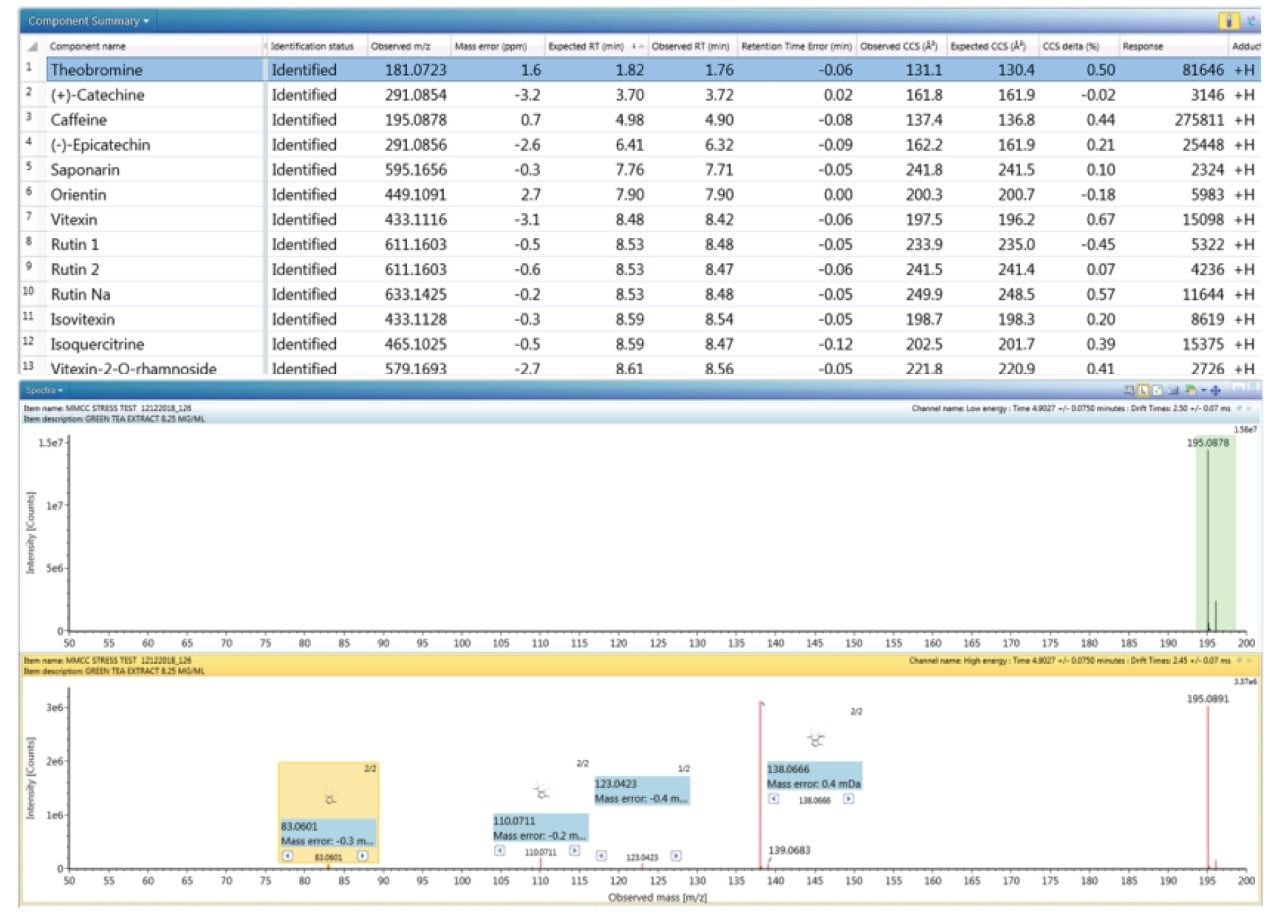
A strategy has been developed to facilitate the efficient and robust generation of mass spectrometry libraries that incorporate precursor/product ions, adduct ions, retention times, and CCS values. Briefly, the library building strategy utilizes analytical standards, which are screened in triplicate, using both positive and negative ion electrospray ionization. Average CCS values (including those of adducts) and product ions are extracted from the processed data to produce analyte-specific, MS library information.7
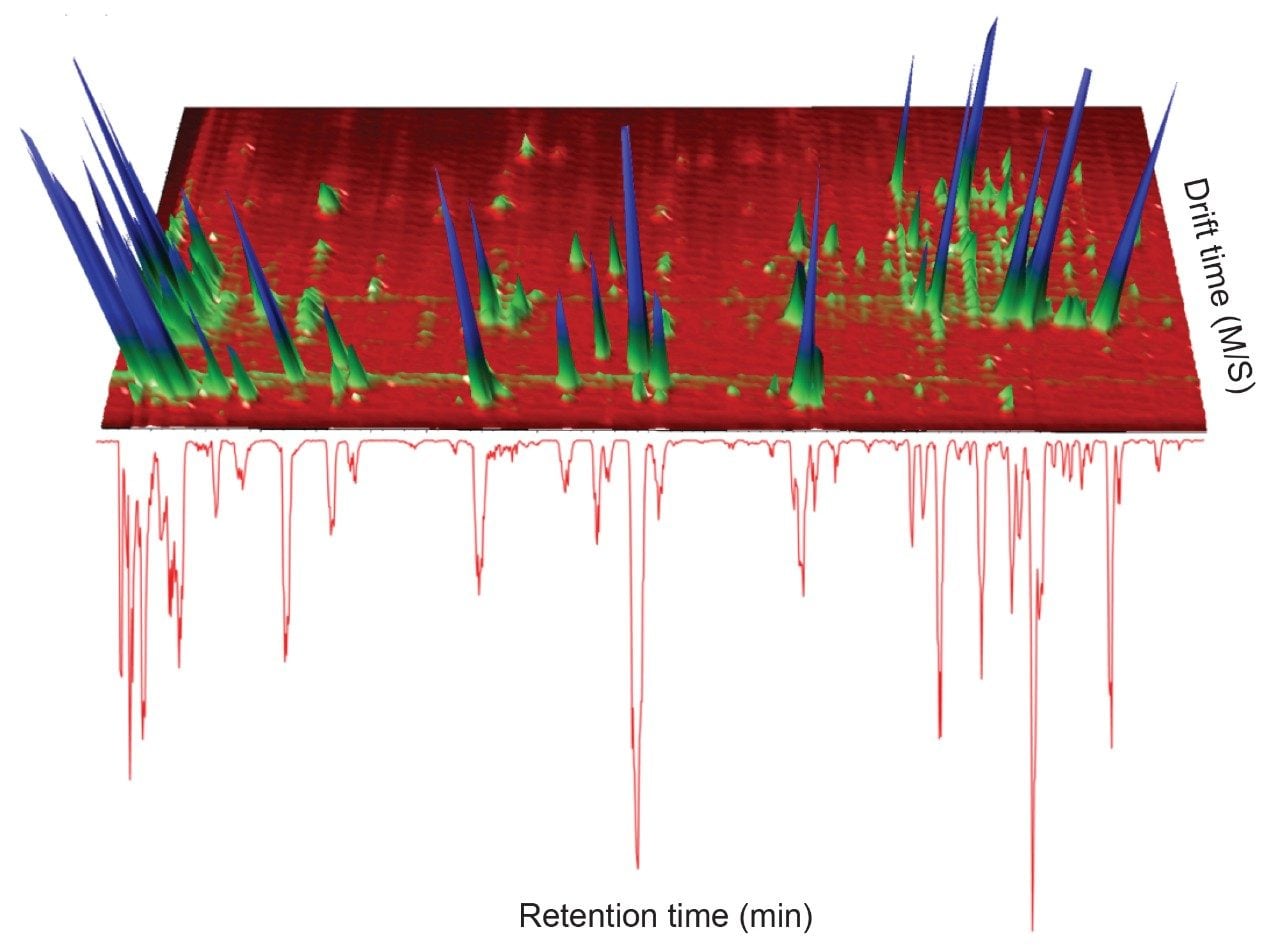
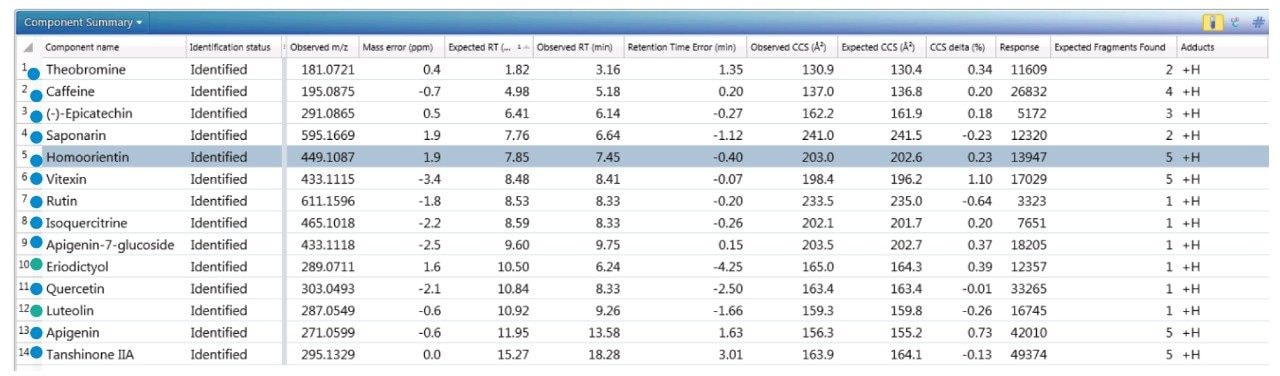
This application note presents an electrospray (ESI), positive mode, natural products library. The increased use of LC-MS-based methods to profile medicinal plants/herbal remedies and complex samples has become more pivotal in phytochemical profiling; but remains a challenge due to sample complexity.4