• Note d'application

Screening for Melamine, Cyanuric Acid, and Dicyandiamide in Powdered Milk and Infant Formula Using Mass Detection

Screening for Melamine, Cyanuric Acid, and Dicyandiamide in Powdered Milk and Infant Formula Using Mass Detection

  • Mark E. Benvenuti
  • Michael S. Young
  • Gareth E. Cleland
  • Jennifer A. Burgess
  • Waters Corporation

Abstract

In this application note we show a method using Waters ACQUITY QDa Mass Detector coupled to the ACQUITY UPLC H-Class System for consistent and simple quantification of melamine, cyanuric acid, and dicyandiamide. Recoveries for the three analytes studied were in the range of 75% to 123% for the five spiked matrices studied.

Benefits

  • Separation of melamine, cyanuric acid, and dicyandiamide (DCD) in less than three minutes.
  • Economical alternative to existing LC-MS/MS methods.
  • Easily integrate mass detection into existing LC workflows.
  • Quantitation of compounds with weak UV activity.
  • Simple sample preparation procedure without the added cost of internal standards.
  • Excellent recovery and repeatability.

Introduction

Melamine and cyanuric acid (Figure 1) are low mass, nitrogen-rich compounds that have been linked to protein adulteration in various foodstuffs in the past.1 While melamine and cyanuric acid are not individually toxic, in combination they can sometimes form an adduct compound through hydrogen bonding, melamine cyanurate, that produce sharp crystals which can cause internal organ failure and possible death.2 A similar compound, dicyandiamide (DCD), which is used to minimize the environmental impact of grazing livestock was found in small amounts in dairy products in New Zealand.3 Published limits on melamine in infant formula are 1 mg/kg, and 2.5 mg/kg in other foods and animal feed. These values are based on the TDI (tolerable daily intake) of melamine and its analogues of 0.64 mg/kg body weight (bw).4 Recently a more stringent TDI for melamine and its analogs of 0.2 mg/kg body weight was established.5 For DCD, the European Food Safety Agency has established a TDI of 1 mg/kg body weight.6 As these compounds are quite polar, reverse-phase methods do not typically work well for these analytes. Current methods employ HILIC chemistry or ion pair mechanisms,7 often with MS/MS detection.

In this application note we show a method using Waters ACQUITY QDa Mass Detector coupled to the ACQUITY UPLC H-Class System for consistent and simple quantification of melamine, cyanuric acid, and dicyandiamide.

Figure 1. Structures of melamine, cyanuric acid, and dicyandiamide.

Experimental

LC conditions

LC system:

ACQUITY UPLC H-Class

CDS data system:

Empower 3

Run time:

14.0 min

Column:

ACQUITY UPLC BEH Amide 1.7 μm, 2.1 x 150 mm

Column temp.:

35 °C

Mobile phase A:

50:50 water:acetonitrile, 10 mM ammonium formate, 0.125% formic acid

Mobile phase B:

10:90 water:acetonitrile, 10 mM ammonium formate, 0.125% formic acid

Flow rate:

0.6 mL/min

Injection volume:

5 μL

Gradient

Sr. No

Time (min)

Flow rate (mL/min)

%A

%B

1

Initial

0.6

2

98

2

3.0

0.6

2

98

3

3.5

0.6

98

2

4

4.0

0.6

98

2

5

4.1

0.6

2

98

6

14.0

0.6

2

98

Standard preparation

Individual 1000 mg/L standards of melamine, cyanuric acid, and dicyandiamide were prepared in water. From these, an intermediate mix of 2 mg/L melamine, 100 mg/L cyanuric acid, and 100 mg/L DCD was prepared in water. This standard was diluted 1:100 in 10:90 water:acetonitrile to produce a standard of 20 µg/L melamine, 1000 µg/L cyanuric acid, and 1000 µg/L DCD. Nine dilutions of this standard were made in 10:90 water:acetonitrile to produce calibration curves for the analytes with values listed in Table 1.

MS conditions

MS system:

ACQUITY QDa (Performance)

Ionization mode:

ESI+/-

Capillary voltage:

0.8 kV positive ion, 0.6 kV negative ion

Probe temp.:

Default (600 °C )

Source temp.:

Default (120 °C)

Melamine

SIR:

m/z 127.1, positive ion

Cone voltage:

15 V

Cyanuric acid

SIR:

m/z 128.0, negative ion

Cone voltage:

10 V

Dicyandiamide (DCD)

IR:

m/z 85.1 positive ion

Cone voltage:

10 V

Acquisition rate:

5 Hz

Full scan acquisition:

m/z 50 to 300

Cone voltage:

15 V

Positive and negative ion, centroid

Table 1. Concentration of standards in µg/L used to create calibration curves.

Sample preparation

1 g of powdered milk or infant formula was dissolved in 10 mL of 2% aqueous formic acid. For the liquid infant formula, 1 mL was added to 9 mL of 2% aqueous formic acid. 1 mL of this solution was added to 9 mL of acetonitrile and mixed well. The proteinaceous precipitate was allowed to settle for 20 minutes, then centrifuged for 20 minutes at rcf of 2233 g. 1 mL of the resulting supernatant was loaded onto a Certified Sep-Pak 6-cc Silica Cartridge (p/n 186004616), previously conditioned with 6 mL of 10:90 water:acetonitrile. The cartridge was eluted with 4 mL of 10:90 water:acetonitrile, and the resulting eluent injected. Five examples of powdered milk and infant formula (powder and liquid, dairy, and soy-based) samples were studied.

A spiking experiment was performed to determine recovery. One g (1 mL for liquid infant formula) was spiked with 1 mg/L of melamine, and 20 mg/L cyanuric acid, and dicyandiamide. This was done for the five examples mentioned above. Each sample was carried through the sample preparation protocol described above. Recovery values are listed in Table 2.

Table 2. Percentage recovery for each of the analytes spiked into five different matrices. Spiking level for melamine was 1 mg/L. Spiking amount for cyanuric acid and DCD was 20 mg/L.

Results and Discussion

Method development

For separating the three analytes in this application, HILIC is the ideal technique. Two different HILIC columns were investigated for  this application, the BEH HILIC Column, and the BEH Amide Column. Figure 2 shows a comparison of the retention of the analytes on both columns, along with acenaphthene, which was used as a marker of no retention for both chemistries. As can be seen in Figure 2A, cyanuric acid and dicyandiamide showed little retention on the unbonded BEH particle deployed in the HILIC column. The tri-functional carbomoyl ligand of the ACQUITY UPLC BEH Amide Column provided vastly improved retention of the analytes of interest (Figure 2B), and was therefore selected as the better column. As shown in Figure 2B, excellent separation was achieved between the three analytes. Melamine is the most highly retentive of the three and eluted within three minutes.

Figure 2A. SIR chromatograms of melamine, cyanuric acid, and dicyandiamide using the ACQUITY UPLC BEH HILIC Column. The first chromatogram shows the UV chromatogram at 280 nm for acenaphthene, which does not retain on this column, and therefore indicates the void volume of the column. Figure 2B. SIR chromatograms of melamine, cyanuric acid, and dicyandiamide using the ACQUITY UPLC BEH Amide Column. The first chromatogram shows the UV chromatogram at 280 nm for acenaphthene, which does not retain on this column and therefore indicates the void volume of the column.

Figure 3 shows an overlay of the UV max plot* of standard 1 with the SIR channels of each analyte (20 µg/L melamine, 1000 µg/L each, of cyanuric acid and dicyandiamide). In Figure 3, only dicyandiamide is weakly visible in the UV trace, while all three analytes showed a strong signal in their respective SIR channels, demonstrating the added sensitivity of using mass detection for these analytes. 

Figure 3. Overlay of UV Max Plot* with SIR channels for melamine, cyanuric acid, and dicyandiamide for standard 1.
*UV max plot is a 2D chromatogram plot derived from the 3D PDA data in which each data point is plotted at its maximum absorbance.

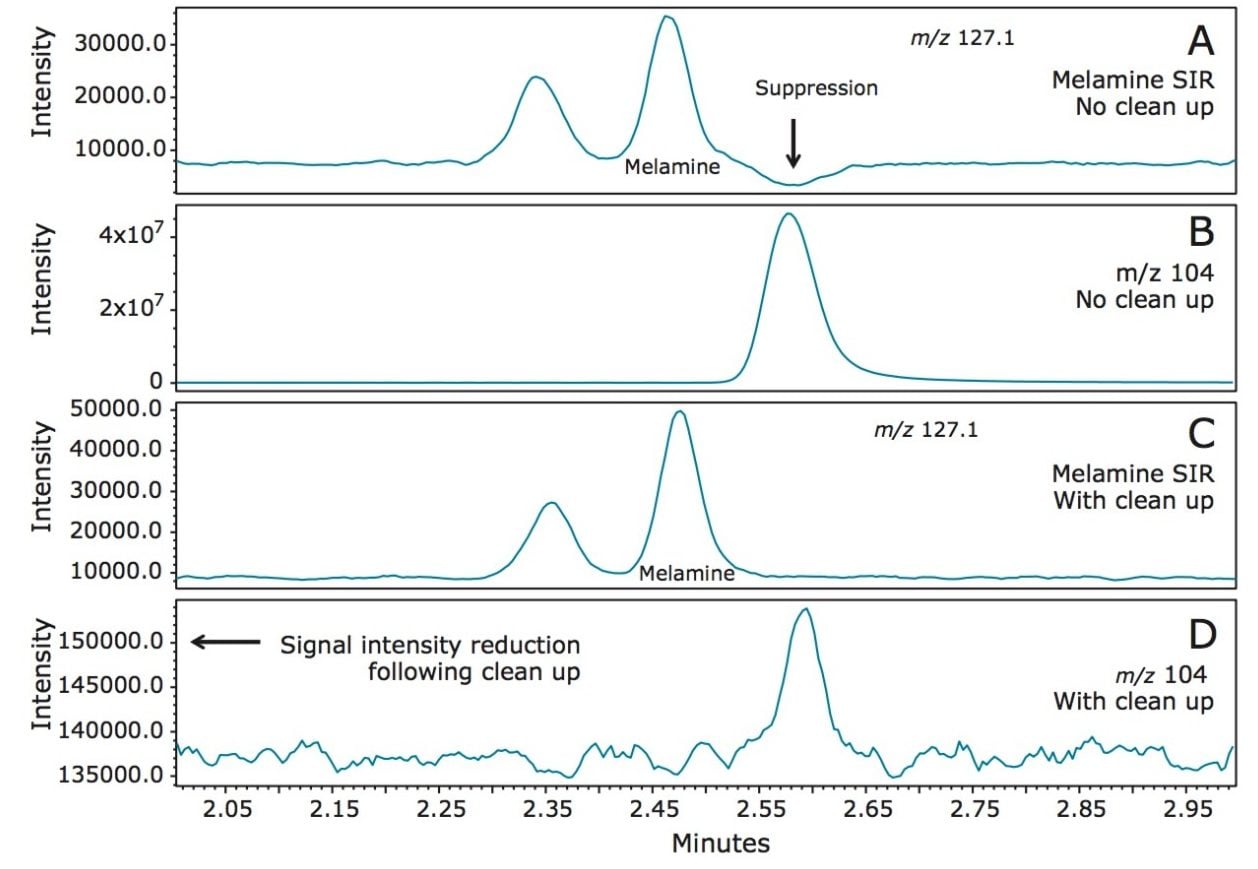
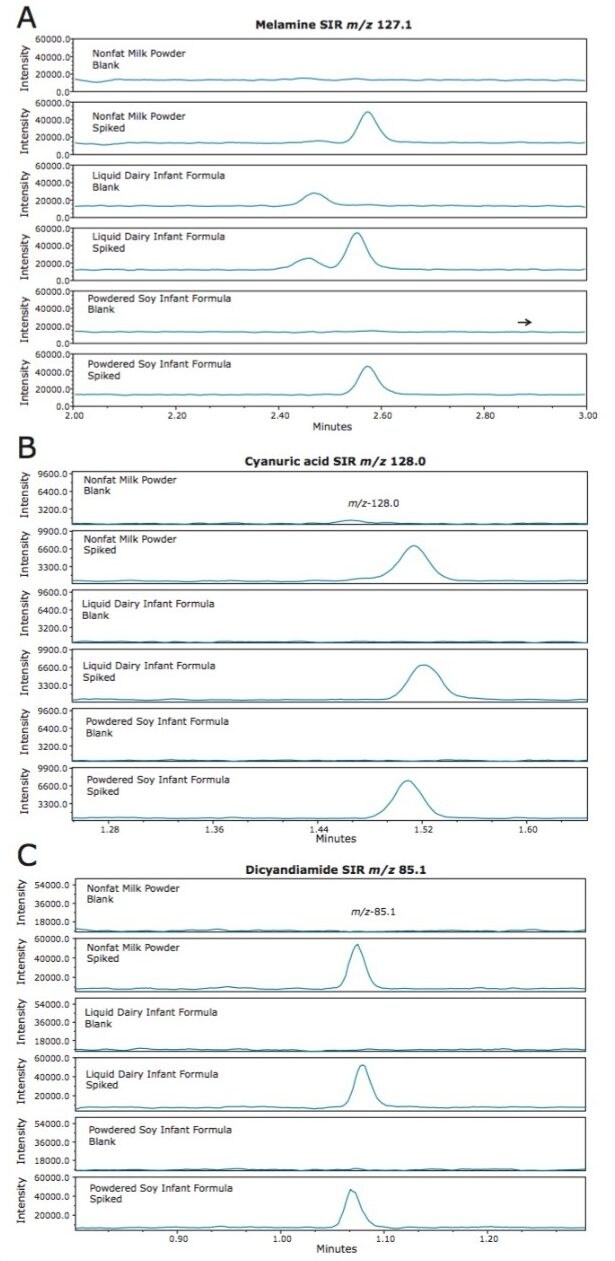
To assess the chromatographic method with example sample matrices, five different samples, (nonfat dry milk, dairy-based powdered infant formula, soy-based powdered infant formula, dairy-based liquid infant formula, and soy-based liquid infant formula) were purchased from a local store. After analyzing these samples, it became apparent that an unknown compound within the samples eluted at a similar retention time to melamine. This compound resulted in a depression in the SIR chromatogram shortly following the elution of melamine. Full-scan MS data, acquired, along with the SIR chromatograms enabled further investigation of the cause. The compound was shown to have m/z 104.1 (data not shown), and was found to be present in all matrices that were tested. In order to avoid any suppression of the melamine response, a pass through cleanup using Certified Sep-Pak Silica Cartridges was deployed. The effectiveness of this method is illustrated in Figure 4, where a spiked infant formula is compared with and without the Sep-Pak Cartridge cleanup.

In Figure 4A, the SIR trace of melamine in the spiked infant formula with no cleanup is shown. The depression in the baseline following the elution of melamine suggests significant suppression of the signal, as previously mentioned. The extracted ion chromatogram of m/z 104.1 in Figure 4B shows the corresponding peak causing the suppression. The intensity of the chromatogram in Figure 4B also indicates that this compound is present at much higher levels than the analytes of interest.

Figure 4. Comparison of melamine spiked infant formula with and without Certified Sep-Pak Silica Cartridge clean up.

As shown in Figure 4C, following the cleanup the baseline of the melamine SIR chromatogram is no longer affected. Figure 4D shows the extracted ion chromatogram of m/z 104.1 after cleanup.

The response of m/z 104.1 is approximately 250 lower than the sample without cleanup. This method development investigation and improvement was made possible by the use of simultaneous full-scan acquisition with the selected SIR traces of the analytes of interest.  

SIR analysis delivers high sensitivity quantification at the lowest concentrations needed to screen for the analytes of interest. The full-scan MS data provided valuable information for method development and changes in the matrix background.

Sample analysis

Calibration plots for the analytes are shown in Figures 5A–C. The calibration range was selected in order to use the linear portion of the calibration curve, which was a different range for the three compounds, as shown in Figure 5. The regression was <0.996 for all analytes with residuals <20%. 

Figure 5. Calibration curves for A. melamine, B. cyanuric acid, and C. dicyandiamide.

The comparison of spiked and unspiked nonfat milk powder, liquid dairy based infant formula, and powdered soy-based infant formula are shown in Figure 6. Melamine was spiked at 1 mg/L and is shown in Figure 6A. Cyanuric acid (Figure 6B), and DCD (Figure 6C) were spiked at 20 mg/L (within the calibration range shown in Figure 5). A low level peak prior to the melamine peak (retention time 2.5 mins, Figure 6A) was apparent in the dairy infant formula samples, but did not interfere with the integration of the melamine peak.

Figure 6. Comparison of SIRs in nonfat milk powder, liquid dairy infant formula and powdered soy-based infant formula blanks and spikes (1 mg/L melamine, 20 mg/L cyanuric acid, 20 mg/L dicyandiamide). (A) SIR chromatogram at m/z 127.1 (melamine). (B) SIR at m/z 128.0 (cyanuric acid), (C) SIR at m/z 85.1 (dicyandiamide).

To assess the method recovery, spiked amounts were compared to the amount quantified using the calibration curves in Figure 5. The resulting recoveries are listed in Table 2 for the five different matrices that were spiked at the levels previously mentioned. Recoveries ranged from 75% to 123% for all analytes. Repeatability was assessed for 7 injections of a spiked liquid soybased infant formula and the percentage RSD for both retention time and amount are shown in Table 2 for each of the analytes.

Conclusion

A rapid screening method for melamine, cyanuric acid, and dicyandiamide in infant formula has been developed. Recoveries for the three analytes studied were in the range of 75% to 123% for the five spiked matrices studied. The use of the ACQUITY UPLC H-Class System with the ACQUITY QDa Detector and BEH Amide Column Chemistry provided:

  • Retention of these difficult, highly polar analytes.
  • Rapid baseline separation of these analytes in under three minutes.
  • A simple pass through cleanup.
  • Selectivity and sensitivity of mass detection, without the requirement of extensive mass spectrometry training.

References

  1. Import alert #99–29, “Detention without physical examination of all vegetable protein products from China for animal or human food use due to the presence of melamine and/or melamine analogs”. U.S. Food and Drug Administration. 27 April 2007.
  2. Culprit in pet food deaths may be combination of contaminants. Michigan State University. November 29, 2007.
  3. Government downplays DCD risk. News NZ. January 27, 2013.
  4. US FDA, Interim Melamine and Analogues Safety/ Risk Assessment May 25, 2007, http//www.cfsan.fda.gov/~dms/melamra.html
  5. The EFSA Journal 2010, 8, 1573.
  6. The EFSA Journal (2004) 36, 1–6.
  7. Draher J et al. Validation of a rapid method of analysis using ultrahigh-performance liquid chromatography – tandem mass spectrometry for nitrogen-rich adulterants in nutritional food ingredients Journal of Chromatography A. 1373:106–113; 2014.

720005397, October 2017

Haut de la page Haut de la page