Scaling to prep (geometric scaling)
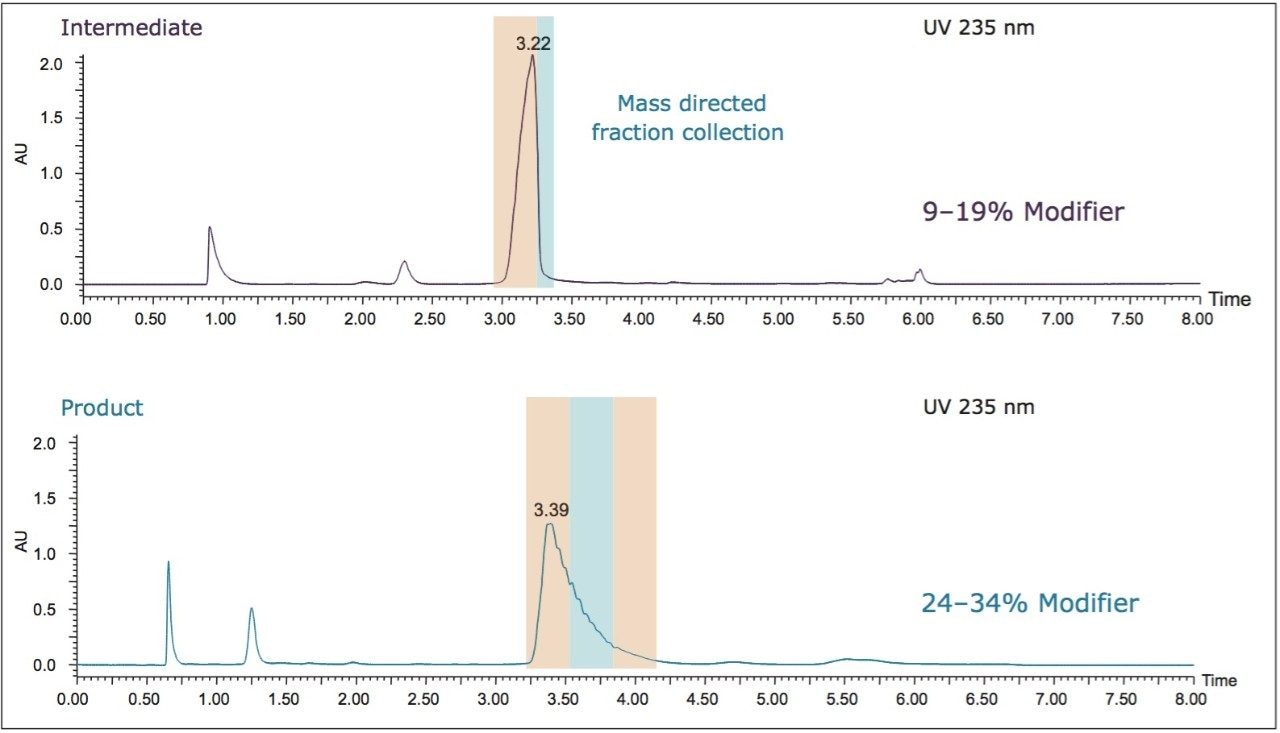
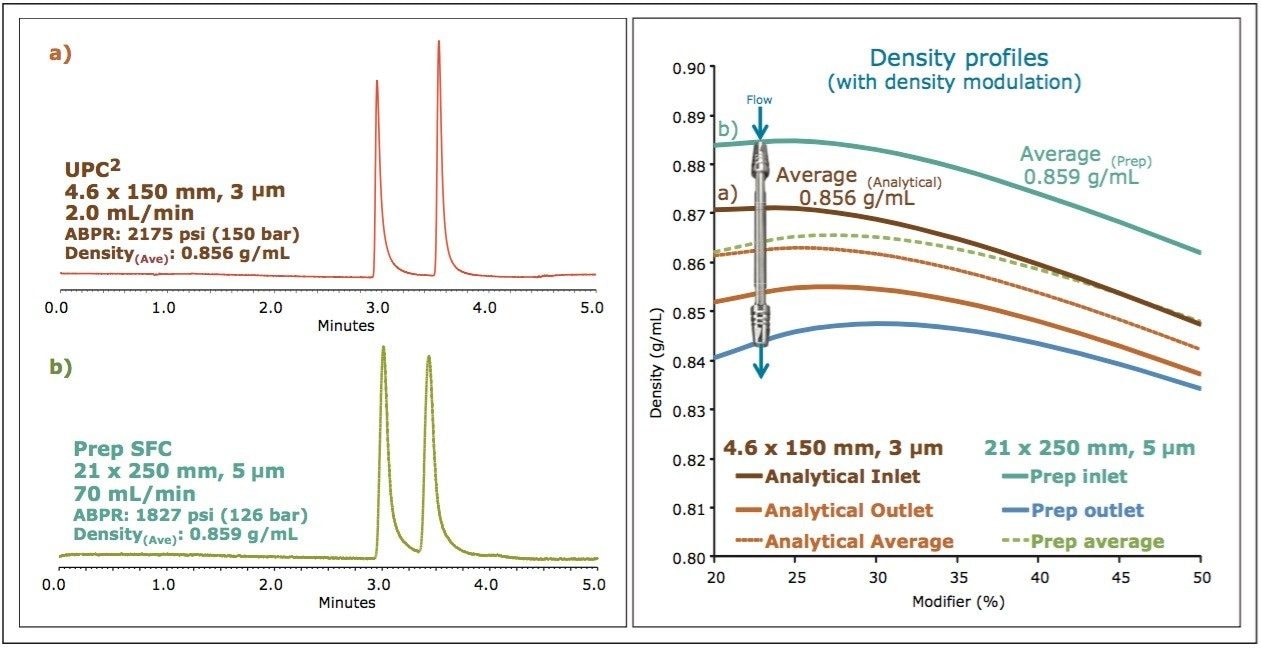
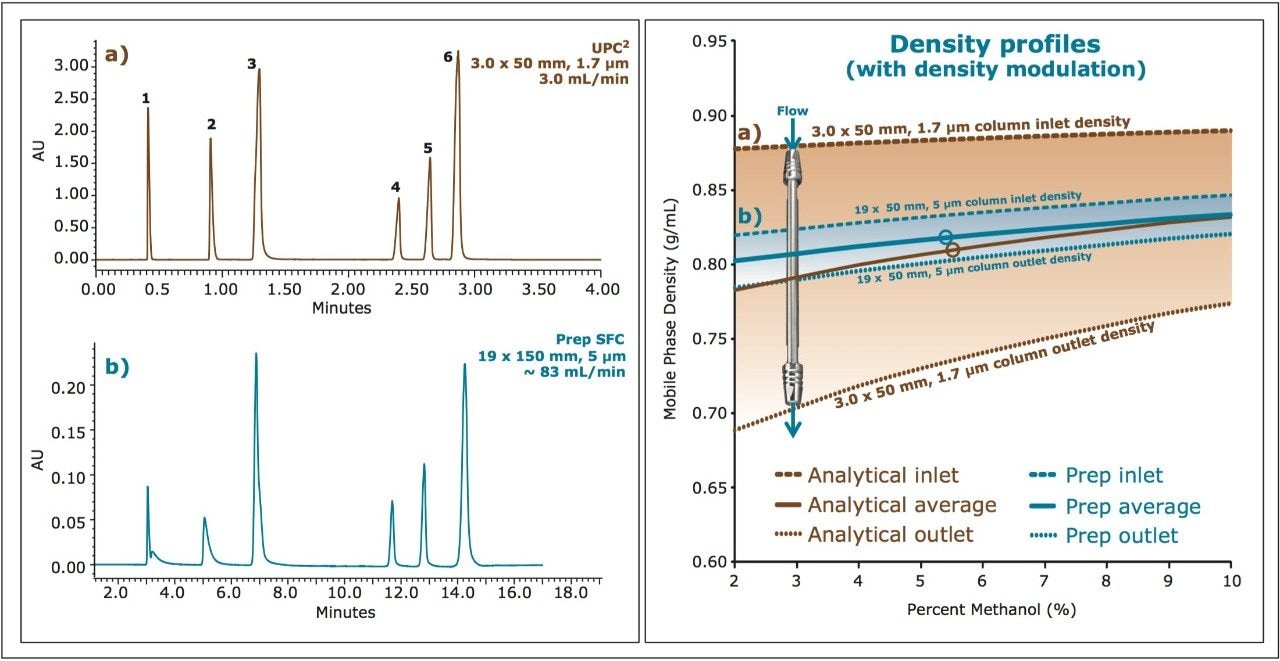
As previously discussed, to scale SFC separations in a predictable manner, it is critical to understand the density profiles for the individual separations. For the selected screening gradient shown in Figure 3(f), the density was simulated for both the column inlet and outlet at multiple points during the gradient, as the modifier transitioned from 4% to 40%. From these values, the average mobile phase density that would be experienced by an analyte during the separation was calculated to be 0.857 g/mL. For scaling to the preparative scale, the strategy of maintaining the same ratio of column length to particle size (L/dp) was employed. Based on the 1.7 μm, 50 mm analytical column dimension, a preparative column was chosen in a 5 μm, 19 x 150 mm configuration. The method was scaled geometrically for separation on a Prep 100q SFC System equipped with both UV and MS detection. A preparative flow rate of 80 mL/min was chosen based on the optimum performance of the system at that flow rate. The gradient time (tg) was scaled from the analytical conditions such that the total number of column volumes (CV) for each gradient were the same (~26 CV), resulting in a preparative gradient of 9.2 minutes. The gradient modifier concentrations were the same as for the analytical separation (4-40%). Chromatograms for both the intermediate [I] and product [P] were collected, at concentrations of 10 mg/mL, with the preparative method. As was performed for the analytical separation, the density profiles were calculated for the preparative column inlet and outlet at multiple points during the separation, taking into account the changing density of the mobile phase with changing concentration of the modifier. From those simulations, the average density for the preparative separation was calculated to be 0.847 mg/mL. The density simulations for the analytical and preparative scale, along with the resulting chromatography are shown below in Figure 4.
Based on the geometric scaling used for the method, with the column configurations chosen to maintain L/dp, the resulting average densities calculated for the two separations were very similar, resulting in similar chromatography without the need for additional density modulation (see Figure 4a and 4b). While this is true for this particular example, maintaining L/dp may not always yield similar average densities, due to differences in flow rates. Only through the density simulations can this be confirmed.
![Evaluation of the intermediate [I] and product [P] from the synthesis of Imatanib.](/content/dam/waters/en/app-notes/2014/720005064/720005064en-f4.jpg.82.resize/img.jpg)
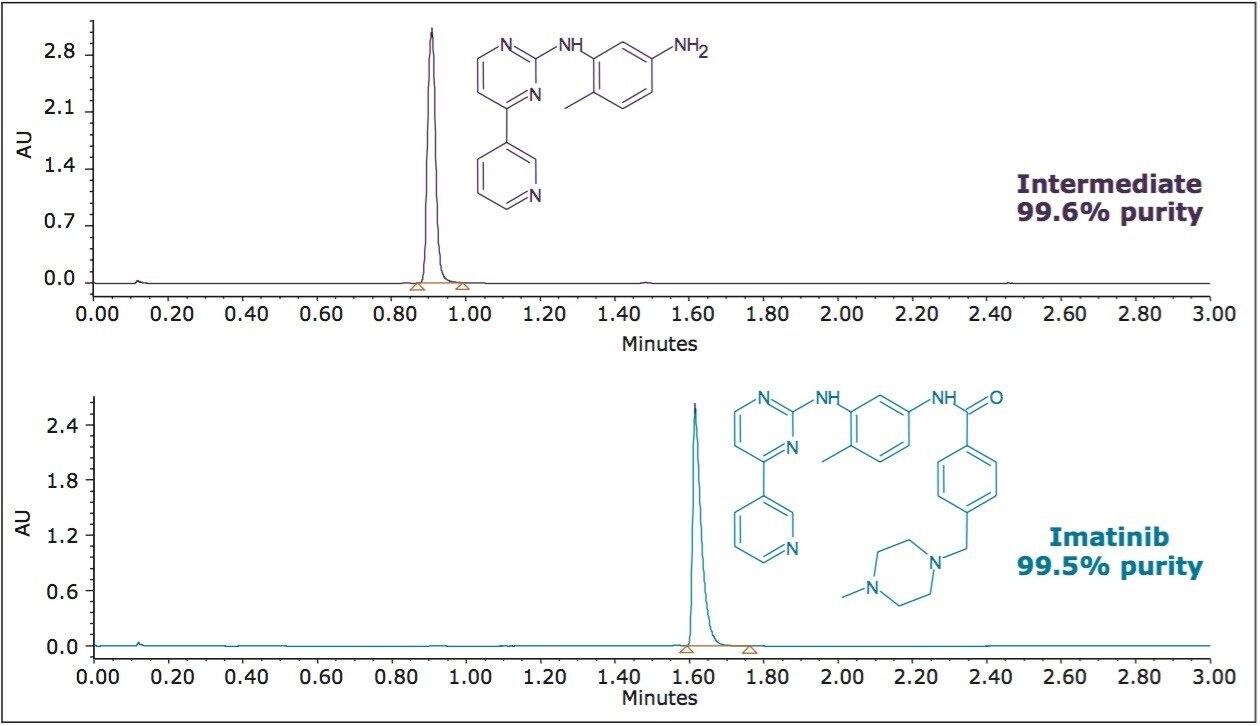
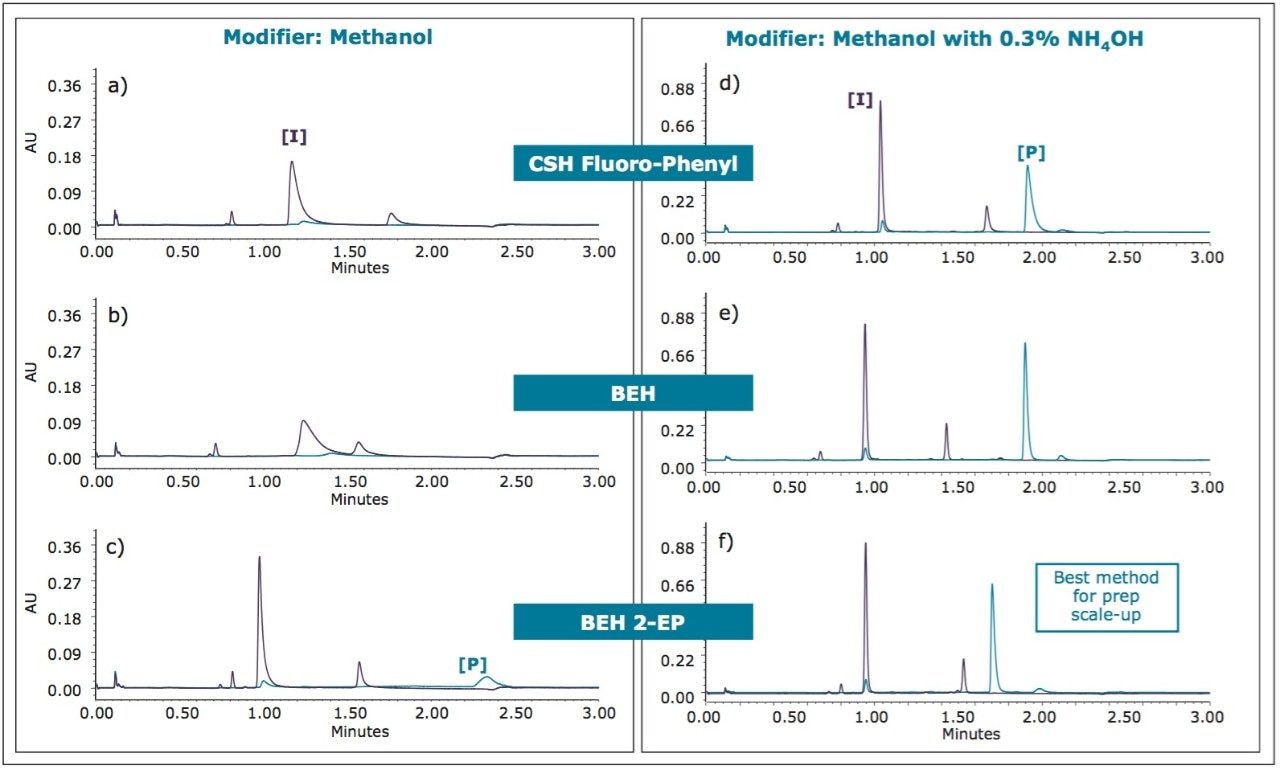
![Evaluation of the intermediate [I] and product [P] by UPC2 on an ACQUITY UPC2 BEH 2-EP, 1.7 μm, 2.1 x 50 mm Column.](/content/dam/waters/en/app-notes/2014/720005064/720005064en-f5.jpg.82.resize/img.jpg)