• Note d'application

Enhancement of UV Detection Sensitivity in SFC Using Reference Wavelength Compensation

Enhancement of UV Detection Sensitivity in SFC Using Reference Wavelength Compensation

  • Lakshmi Subbarao
  • Jacquelyn Cole
  • Rui Chen
  • Waters Corporation

Abstract

In this application note, we demonstrate the enhancement of UV detection sensitivity in SFC by using reference wavelength compensation, a built-in feature of the 2998 PDA Detector under both MassLynx and Empower software.

Benefits

  • Using the built-in feature of Waters 2998 PDA Detector, reference wavelength compensation, an average 3- to 5-fold increase in S/N was achieved for all tested compounds. 
  • The reported LOD and LOQ results indicate that SFC is an enabling analytical technique and suitable for use in the analysis of impurities, enantiomeric excess (EE) determinations, and QA/QC.

Introduction

Regulatory requirements for the identification, quantification, and control of impurities in drug substances and their formulated products are increasingly being explicitly defined, particularly through the International Conference of Harmonization (ICH). According to ICH, the threshold for identification and qualification of organic impurities is 0.10% for the majority of compounds, which implies a limit of quantification (LOQ) of 0.05% will be required for the involved analytical technology. With an increasing number of single enantiomers and stereoisomers being developed as drug candidates, detection and quantitation of chiral impurities to the 0.10% level are of great importance. Supercritical fluid chromatography (SFC) is a superior chromatographic technique for chiral separation; however, traditionally SFC UV has not been considered a highly sensitive technique.

While much effort has been applied to hardware improvement, using appropriate reference wavelength(s) compensation in data acquisition, a common built-in feature of photodiode array (PDA) detectors and the like, offers a facile means to effectively reduce most non-wavelength-dependent noise; thereby, increasing the overall signal/noise ratio (S/N). Reference wavelength compensation collects wide-band absorbance data in a region where the analytes have minimal or no absorption. The detector calculates the compensation value by averaging the absorbance values within the selected range of wavelengths. The averaged value is then subtracted from the absorbance value. Since the main absorbance includes the reference bands, noises from common sources including pump and back pressure regulator can be effectively reduced. The closer the reference bands are to the λmax of the analyte of interest, the more effective the noise reduction. 

Experimental

All experiments were carried out using a Waters Resolution SFC MS System. The system consists of a Fluid Delivery Module (FDM), Alias Autosampler, Column Oven, Automated Back Pressure Regulator (ABPR), 3100 Mass Detector, and 2998 PDA Detector. MassLynx Software was used for data acquisition and analysis. In all experiments, the sampling rate for the 2998 PDA Detector was five point/sand the resolution was 3.6 nm.

For the experiments of hydrocortisone and caffeine, a 4.6 x 50 mm silica column was used. Key experimental parameters were as follows:

  • Flow rate: 3 mL/min
  • System pressure: 150 bar
  • Temp.: 40 °C
  • Injection volume: 5 μL (full loop)
  • Isocratic method: 25% methanol
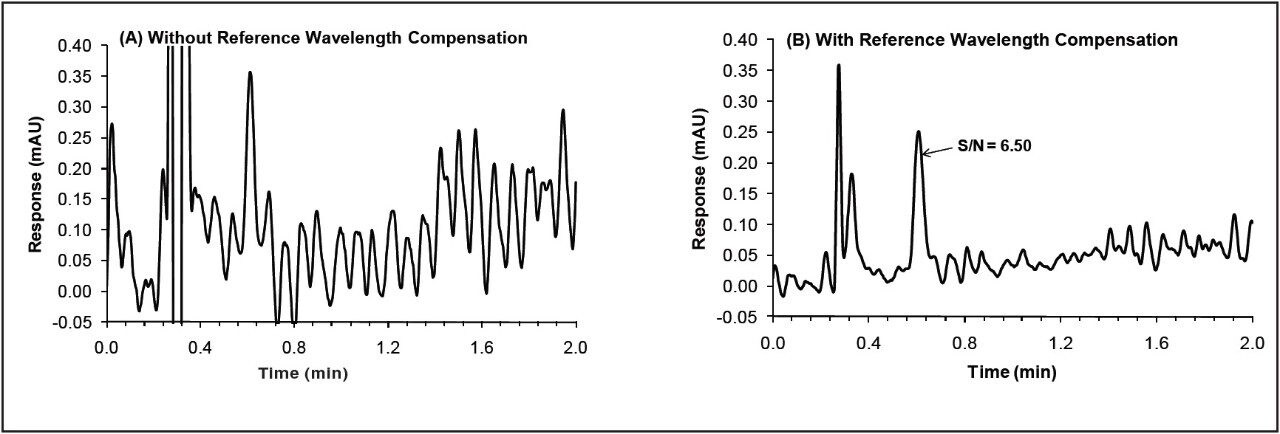
  • Compensated wavelengths: 290 to 330 nm for hydrocortisone and 310 to 350 nm for caffeine

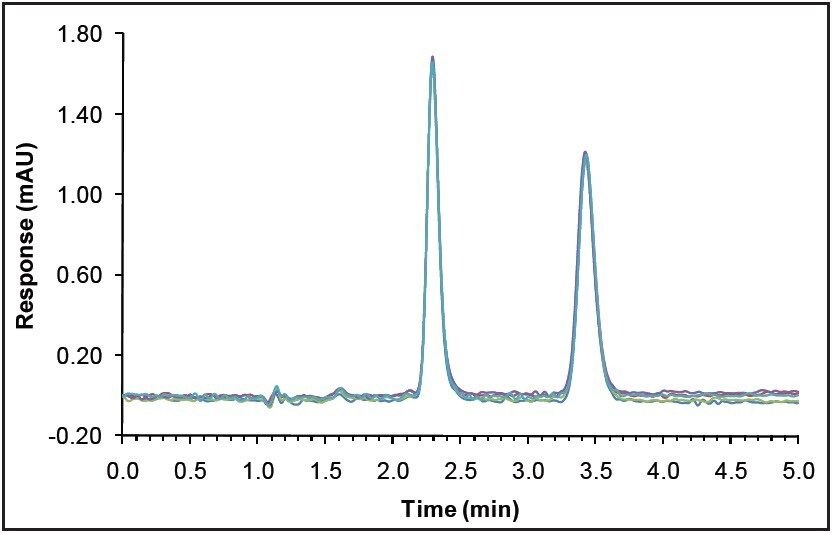
For the warfarin experiments, a 4.6 x 250 mm OD-H column was used. Key experimental parameters were as follows:

  • Flow rate: 3 mL/min
  • System pressure: 150 bar
  • Temp.: 40 °
  • Injection volume: 5 μL (full loop)
  • Isocratic method: 30.0% methanol with 0.4% N,N-dimethylethylamine (DMEA)
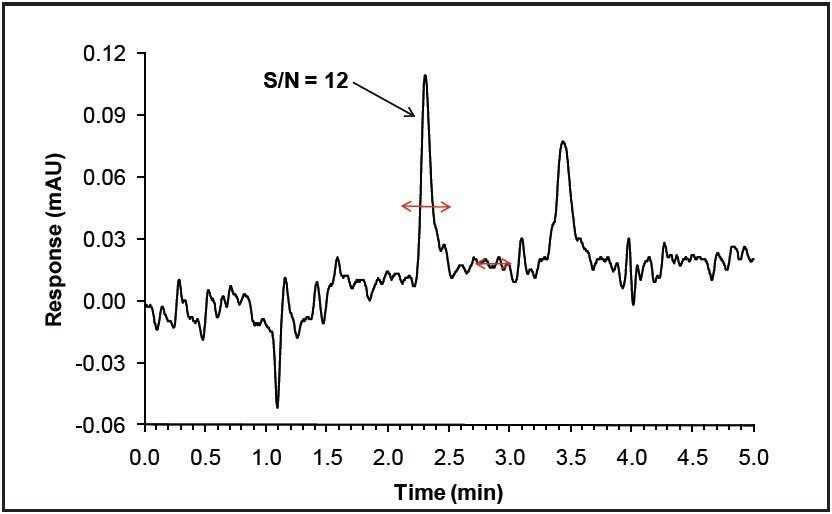
  • Compensated wavelengths: 330 to 370 nm

All samples were dissolved in methanol. The concentrations for each compound were as follows: warfarin (5.0 mg/mL, or 2.5 mg/mL for each enantiomer); hydrocortisone (2.5 mg/mL); caffeine (2.0 mg/mL).

Results and Discussion

Figure 1 shows a comparison of two hydrocortisone chromatograms at 0.125 μg/mL. Figure 1A represents a standard chromatogram at λmax, whereas figure 1B shows a chromatogram acquired using reference wavelength compensation. While the peaks at 0.6 min have similar heights, the S/N of 1B is almost four times higher than 1A, suggesting that reference wavelength compensation provides a four-fold reduction in noise. On average, a minimum 3- to 5-fold increase in S/N was obtained in all compounds tested. Another example of reference wavelength compensation is shown in Figure 2 with caffeine at a concentration close to its LOD (0.025 μg/mL).

Figure 1. SFC UV chromatograms of hydrocortisone at 0.000125 mg/mL: (A) without reference wavelength compensation and (B) with reference wavelength compensation.
Figure 2. SFC UV chromatogram of caffeine at 0.00125% of the nominal concentration.

Next, we demonstrate the quantitative analysis of warfarin by SFC UV. Figure 3 shows the overlay of SFC UV chromatograms from five replicate injections of warfarin at 0.1% of the nominal concentration. Excellent reproducibility was achieved on both retention time and peak area as shown in Table I. At this concentration, the average S/N is above 100. Figure 4 shows the SFC UV chromatogram of warfarin at 0.005% of the nominal concentration. This concentration represents 0.000625 μg (0.625 ng) of each enantiomer on the column. Even at this low concentration, the S/N is still above 10 for peak 1, and slightly lower than 10 for peak 2.

Figure 3. Overlay of the SFC UV chromatograms from five replicate injections of warfarin at 0.100% of the nominal concentration.
Table 1. Statistics for the analyses of warfarin by SFC UV.
Figure 4. SFC UV chromatograms of warfarin at 0.005% of the nominal concentration.

Figure 5 shows the calibration curves for both peak 1 and peak 2, with a correlation coefficient of > 0.99999 for both curves. The linearity range expands from 0.005% to 100%, over four orders of magnitude of the nominal concentration. The curves for the two enantiomers also displayed excellent agreement between each other. It is noted, however, that in order to truly gauge the linearity encompassing such a wide concentration range, two calibration curves (one for low concentrations and one for high concentrations) are typically required.

Figure 5. Calibration curve for the analyses of warfarin by SFC UV.

Conclusion

Using reference wavelength compensation featured in the 2998 PDA Detector, an average 3- to 5-fold increase in S/N was achieved for all tested compounds, indicating a 3- to 5-fold reduction in noise. Reference wavelength compensation produced an LOQ of 0.125 μg/mL (0.625 ng on the column) of each enantiomer of warfarin and over four orders of magnitude of linearity, the best sensitivity and widest dynamic range ever reported in SFC. These results indicate SFC is ready for prime time and suitable for use in the analysis of impurities, enantiomeric excess (EE) determinations, and QA/QC.

720003534, May 2010

Haut de la page Haut de la page