Quantification of Diagnostic Markers and Pathway Analysis for Gaucher Disease by Means of LC/MS
Abstract
Benefits
- Quantitative label-free nanoscale LC/MSE analysis has been applied to the serum analysis of Gaucher disease patients to identify and quantify disease markers and indicators
- Absolute and relative LC/MSE quantification analysis were utilized to assess treatment effects and enzyme activities
- Clustering approaches will be presented at the peptide (accurate mass-retention time cluster) and protein level to assess data quality and treatment effects, respectively
- The use of peptide intensity profiling will be demonstrated to conduct pathway analysis
Introduction
Themost frequently encountered inherent lysosomalstorage disorder is Gaucher disease, which is marked by deficiency in glucocerebrosidase activity that catabolizes glycosylceramide to ceramide and glucose. The latter leads to problems in biomolecular component recycling. The clinical presentation is heterogeneous with respect to age, nature, and symptom progression.
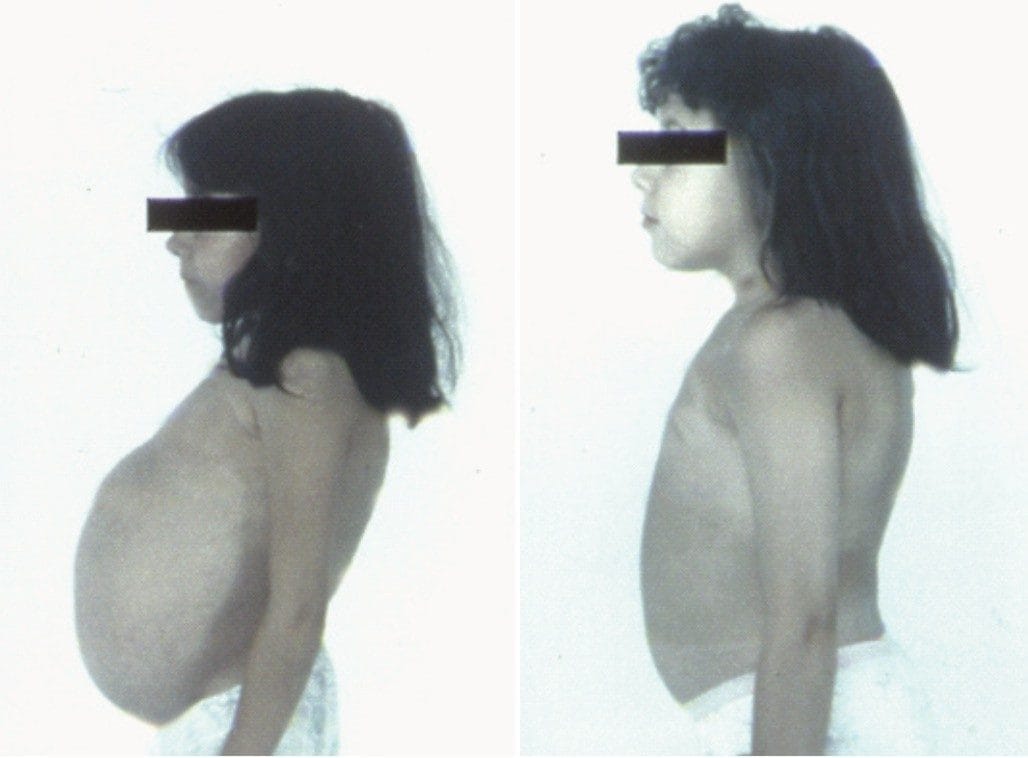
Manifestations are usually accompanied by abnormalities in serum composition. These are normally not attractive marker candidates since their prevalence varies. Patients are treated using enzyme supplementation therapy to alleviate symptoms, Figure 1. Recently, an enzyme has been discovered that is elevated in serum and is a sensitive indicator of Gaucher disease and a tool to monitor treatment efficacy.
Patient digest serum samples were analyzed by means of LC/MS. The tandem mass spectrometer acquired data in a special mode of acquisition where the collision energy within the collision energy within the gas cell is continuously switched from low to elevated energy, with no precursor selection by the first mass analyzer.
Absolute protein concentration determination results for Chitotriosidase – a specific biomarker of Gaucher disease for symptomatic type I patients – will be presented. The effect of enzyme replacement therapy was monitored by looking at the serum protein composition as a whole. Both undepleted and depleted quantitative LC/MS serum analyses were utilized for the latter as they complement each other in terms of addressing the dynamic concentration range within serum.
Various clustering approaches will be demonstrated to characterize the investigated stages of treatment. Protein level clustering will be demonstrated to assess condition similarity and treatment effects. Peptide intensity profiling – with associated protein identifications – will be used to identify pathway associated proteins.
Experimental
Sample Preparation
Patient serum samples – control, pre- and post-treatment – were diluted prior to depletion with a 10 cm x 4.6 mm multi-affinity removal system column which removes the six most abundant serum proteins. Serum samples – both depleted and undepleted – were subsequently denatured with RapiGest™ SF surfactant (0.1%) reduced (10 mM DTT), alkylated (10 mM IAA), and enzymatically digested with trypsin, 1:50 (w/w) enzyme/protein ratio.
RapiGest was removed by the addition of 2 µL conc. HCl – followed by centrifugation – and the supernatant collected. Samples were diluted with 0.1% formic acid to an appropriate final working concentration prior to analysis – corresponding to an 0.5 µg of protein digest on-column.
LC Conditions
LC/MS quantification experiments were conducted using a 1.5 hr reversed-phase gradient at 250 nL/min (5 to 40% acetonitrile over 90 min) on the Waters® IdentityE High Definition Proteomics™ System, using as an inlet the nanoACQUITY UPLC® System and an Atlantis® 3 µm C18 NanoEase™ 75 µm x 15 cm nanoscale LC Column. Samples were run in triplicate.
MS Conditions
The IdentityE System also included the Q-Tof Premier™ Mass Spectrometer, which was programmed to step between normal (5 eV) and elevated (15 to 35 eV) collision energies on the gas cell, using a scan time of 1.5 s per function over m/z 50 to 1990.
Data Processing and Protein Identification
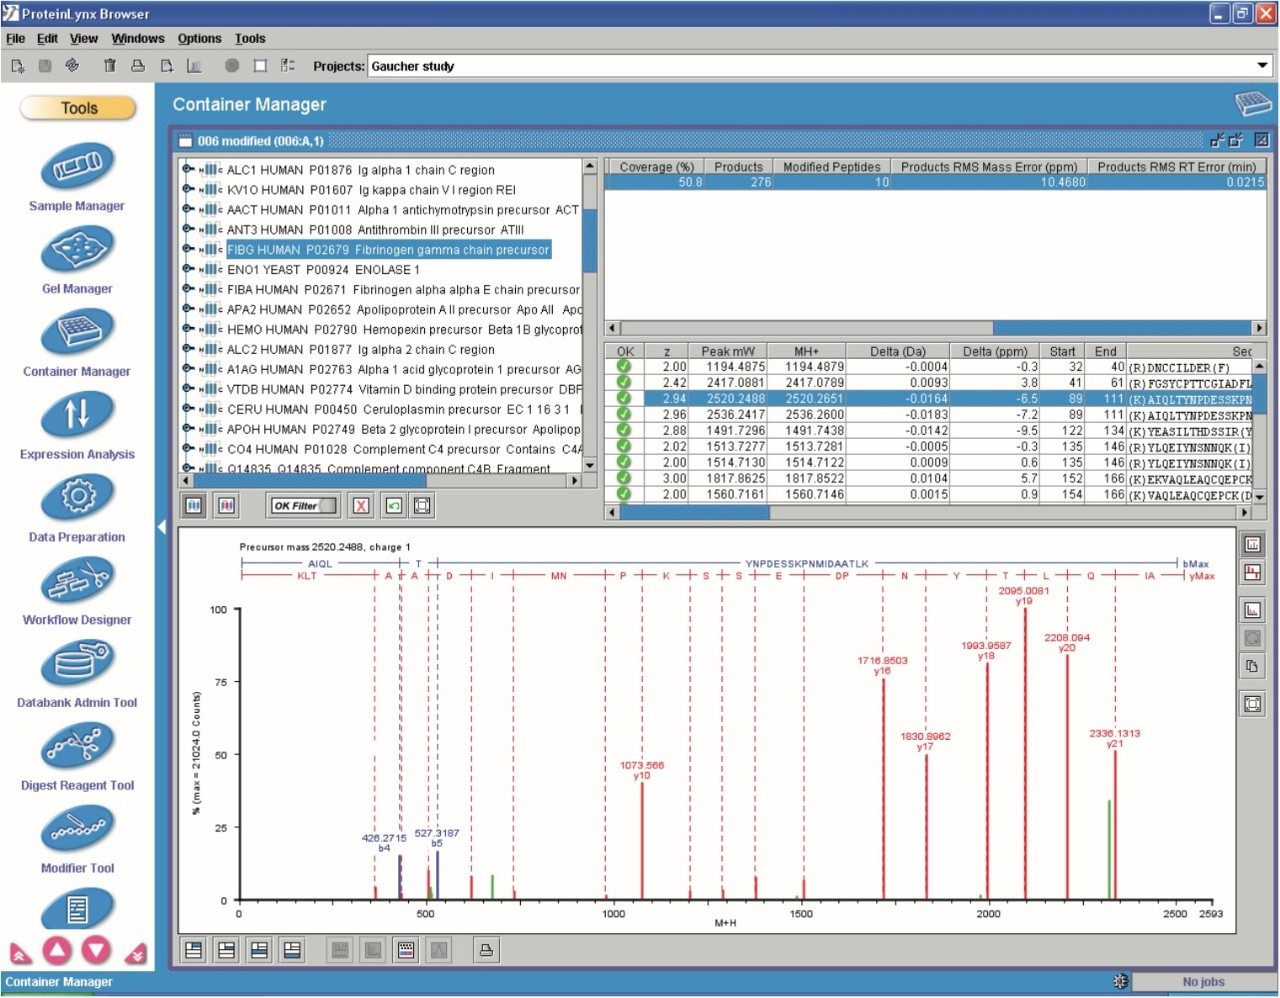
Protein identifications, data alignment, and quantitative information were generated by the use of dedicated algorithms, including the comprehensive peptide ion accounting informatics included with the IdentityE System, and by searching various human specific databases, Figure 2. Additional statistical and clustering data analysis, based on the comma-separated values output from the ExpressionE informatics software, was performed with Decisionsite (Spotfire), Excel (Microsoft), and Simca-P+ (Umetrics).
Results and Discussion
Relative Quantification
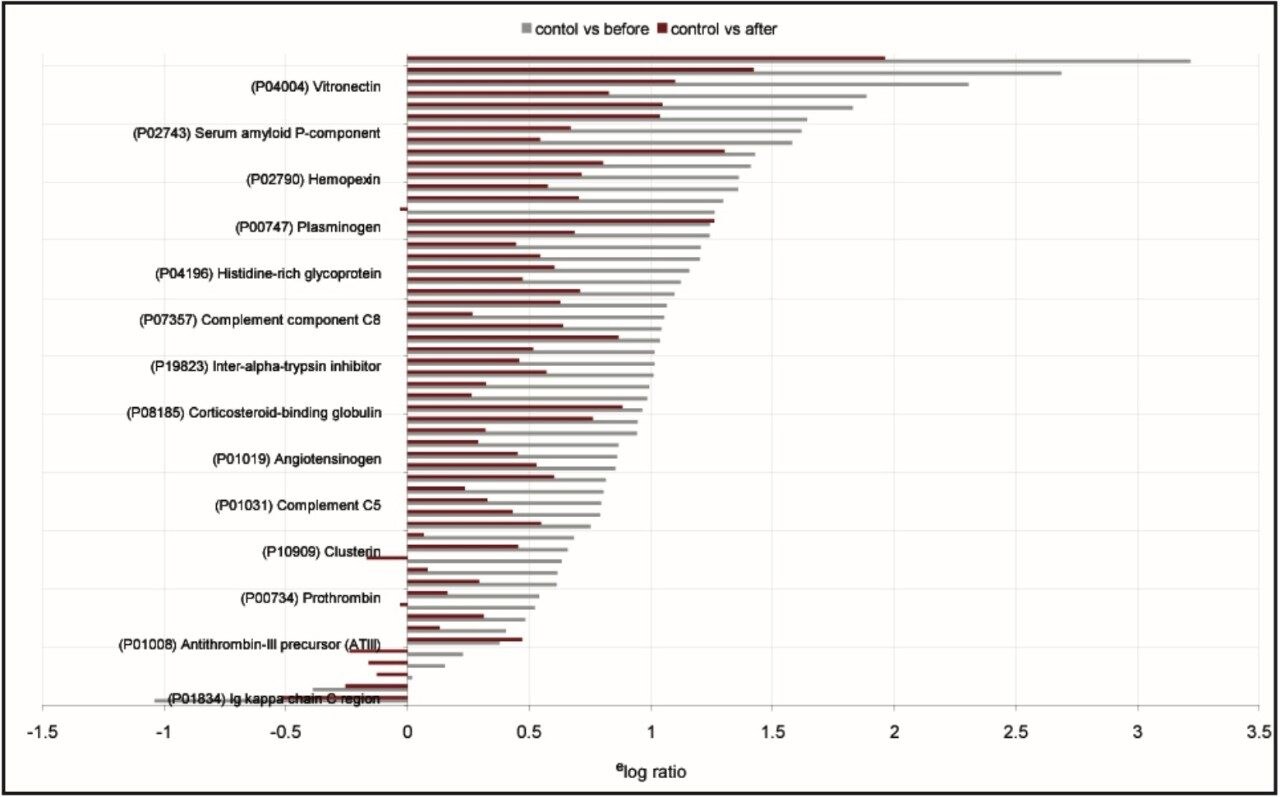
The low-energy data are used for quantification of the proteins, whereas the high-energy information is utilized for qualitative identification purposes. The total number of identified proteins was 108. 46 proteins were identified in common, 20 were found to be unique to the undepleted serum, and 42 proteins were uniquely identified in the depleted serum samples. Approximately 50 percent of the proteins uniquely identified to both depleted and undepleted serum were found to be regulated. Figure 3 illustrates the relative quantification result for depleted serum.
Absolute Quantification
Chitotriosidase is a known biomarker for symptomatic Gaucher disease patients and was positively identified in all pre-treatment serum samples. The absolute concentration and enzyme activity of Chitotriosidase was determined by means of a recently published absolute concentration formula:

The absolute concentration of detected Chitotriosidase was found to be equal to 1.6 fmol/µL in the presence of 0.5 µg of depleted serum, corresponding to an estimated enzyme activity of 39,500 nmol/ mL.h. The activity measured by means of the enzymatic assay was 31,800 nmol/mL.h.
Data Clustering – Multivariate Analysis
The results of the use of principal component analysis (PCA) at the protein level are shown in Figure 4. The protein identification results for the depleted and undepleted serum samples were annotated with absolute determined amounts injected on-column. However, PCA can be skewed by the presence of unique proteins in the case of a comparison between the depleted and undepleted serum samples. Therefore, only the cross-section of the proteins that were identified in all injections – within all conditions – was used for PLS-DA. From the results shown in Figure 4, the first two main principal components can be easily identified as treatment and depletion, respectively.
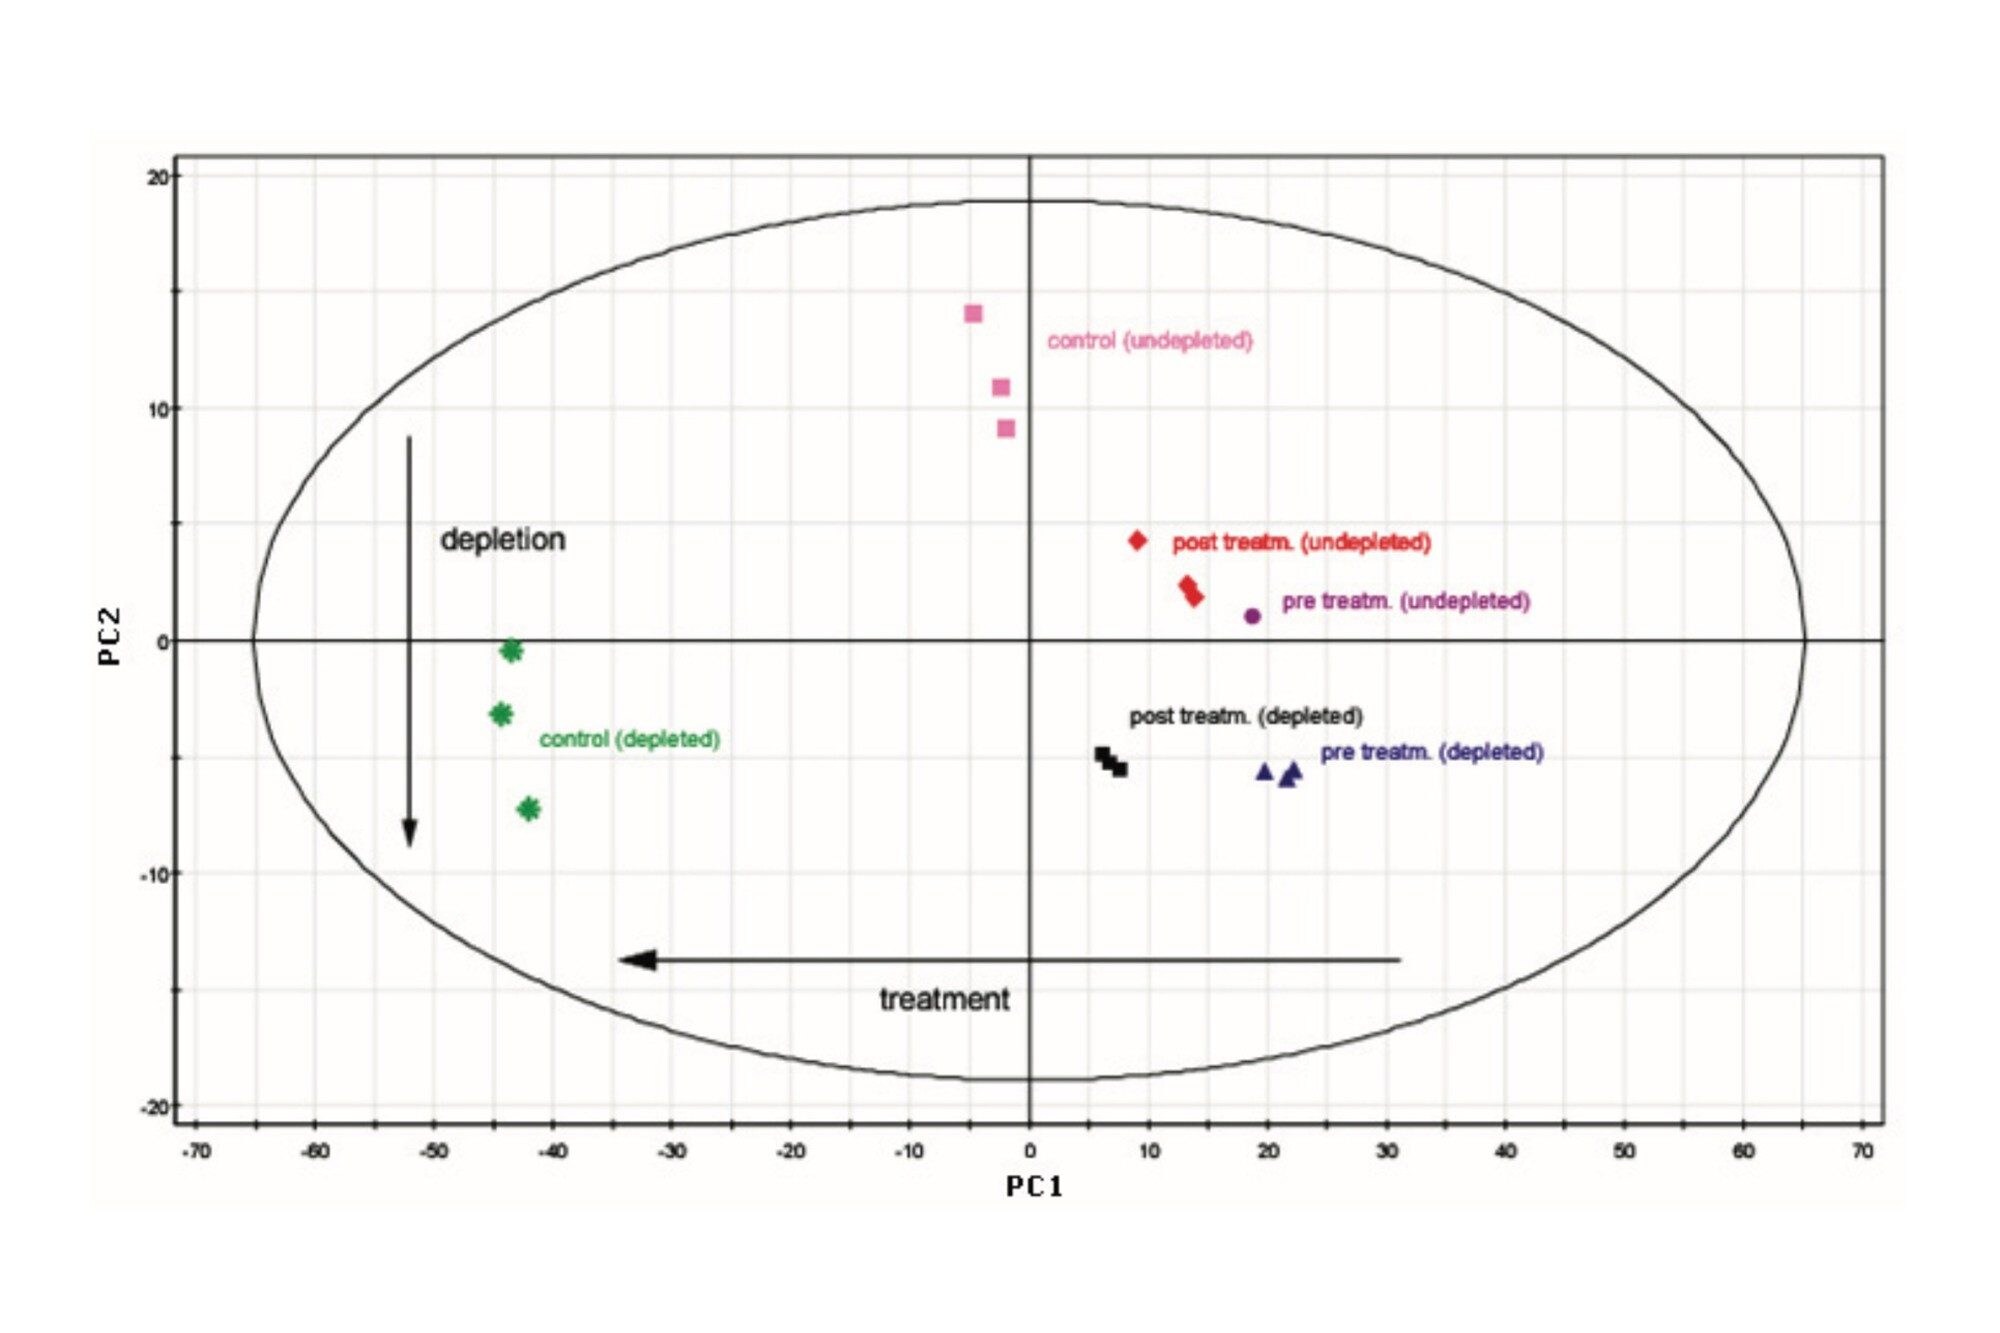
Figure 5 illustrates the clustering of the peptide intensities by their pattern, allowing protein identification of proteins involved in the same biological process – hence, allowing pathway analysis.
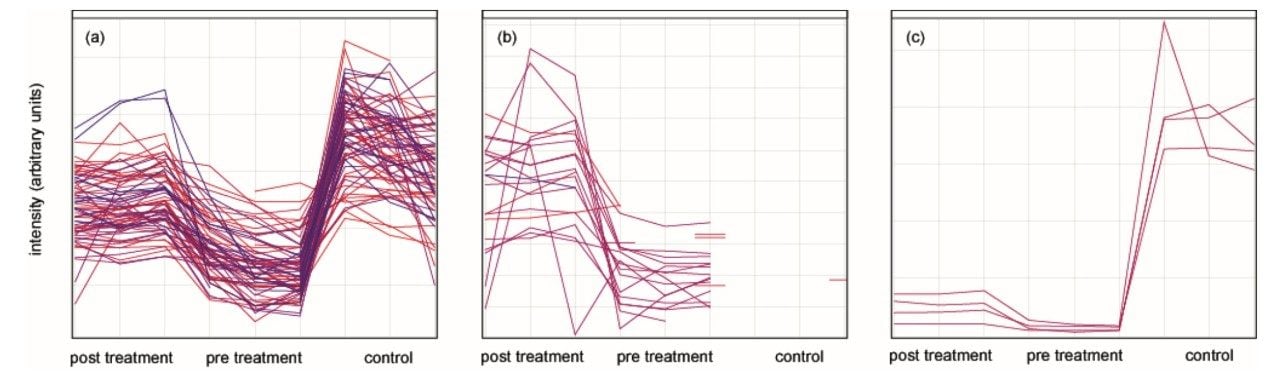
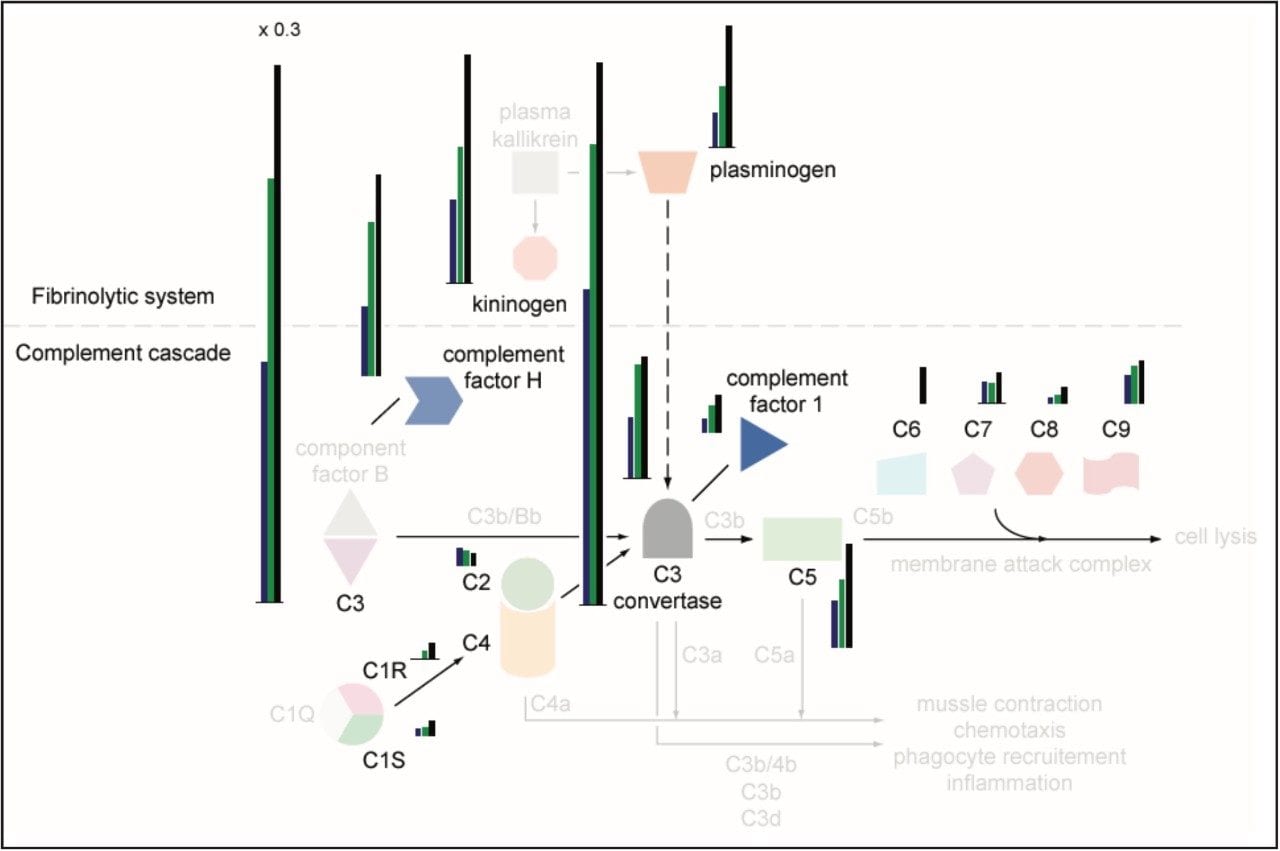
For example, the left panel (a) shows a cluster that was low in intensity pre-treatmentand increased in intensity post-treatmentand also in the control sample. The three left columns correspond to the triplicate injections of post-treatment, the middle three to pre-treatment and the right three to control serum samples. The profiled peptides can be mapped to their parent proteins. For example, 15 proteins contributed with at least three peptides to the profile cluster (a) in Figure 5, of which six are part of the complement and coagulation cascades. A similar lower intensity profile identified an additional eight proteins that are part of the same pathway. Hence, all proteins identified in the complement pathway show the same regulation trends, as shown in Figure 6.
The profile cluster in Figure 5 (b) represents proteinsthatareabundant in the pre- and post-treatment sample and are not identified in the control. These correspond to Fibrinogen alpha chain, Fibrinogen beta chain, and Fibrinogen gamma chain. The serum of Gaucher patients is typically characterized by severe abnormalities in the coagulation system, contributing to the tendency of Gaucher patients to bleed. This is compensated by the fibrinolytic system. The third cluster represents peptides from Apolipoprotein A1, a protein-down-regulated pre-treatment that is only marginally normalizing upon therapy. Apolipoprotein A1 is a component of the HDL serum content, which is extremely low and known to be poorly normalized following enzyme replacement therapy.
In addition to the presented clustering approaches, cluster-driven gene ontology searches can be performed to determine the correlation between the molecular functions of the identified peptides, and potentially, the associated proteins. For instance, for the cluster shown in Figure 6 (a), the molecular function distribution based on retrieved genes was 42% binding, 11% catalytic activity, 25% enzyme regulator activity, 11% signal transducer activity, 11% transporter activity by annotating the cluster with gene indexes.
Conclusion
- Enzyme replacement treatment efficacy has been demonstrated by means of uni- and multi-variance LC/MS analysis of depleted and undepleted serum
- A specific Gaucher disease biomarker – Chitotriosidase – has been positively identified, quantified, and its enzyme activity determined
- Principal component analysis (PCA) can be applied to both the low and elevated energy data sets to rapidly assess data quality and identify trends.
- Clustering gene ontology-driven searchesprovidesaconvenient means for classification of the peptides and proteins that exhibit a similar profile change from a complex data set to identify pathway associated proteins.
- The results obtained with the presented label-free quantitative MS methods are consistent with biochemical findings.
References
- J.C. Silva, R. Denny, C.A. Dorschel, M.V. Gorenstein, I.J. Kass, G.-Z. Li, T. McKenna, M.J. Nold, K. Richardson, P. Young and S.J. Geromanos. Quantitative Proteomic Analysis by Accurate Mass Retention Time Pairs. Anal. Chem. 2005, 77, 2187–2200.
- J.C. Silva, M.V. Gorenstein, G.-Z. Li, J.P.C. Vissers, and S.J. Geromanos. Absolute Quantification of Proteins by LC-MSE; a Virtue of Parallel MS Acquisition. Mol. Cell. Proteomics 2006, 5, 144–156.
- M.A. Huges, J.C. Silva, S.J. Geromanos, and C.G. Townsend. Qunatitaitve Proteomic Analysis of Drug-Induced Changes in Mycobacteris. J. Proteome Res 2006, 5, 54–63.
- J.C. Silva, R. Denny, C. Dorschel, M.V. Gorenstein, G.-Z. Li, K. Richardson, D. Wall, and S. J. Geromanos. Simultaneous Qualitative and Quantitative Analysis of the Escherichia coli Proteome: A Sweet Tale. Mol. Cell. Proteomics 2006, 5, 589–607.
Featured Products
720002038, August 2007