This is an Application Brief and does not contain a detailed Experimental section.
The data presented in this application brief illustrates typical mass accuracy and dynamic range that can easily be acquired using the Q-Tof Premier.
The use of time-of-flight (Tof) technology to provide information-rich data continues to expand through all areas of industry, including metabolite, impurity, environmental, and natural product profiling. In these and many other application areas, it is increasingly important to have a mass spectrometer capable of full-spectrum acquisition with excellent sensitivity, especially when dealing with unknowns. Moreover, as regulatory requirements continue to evolve, full-spectrum acquisition is also utilized to prove the absence of a compound. The ability to acquire routine, accurately mass-measured data below 3 ppm enables complex data sets to be rapidly converted to solutions.
Full-spectrum acquisition also eliminates data acquisition limitations. If an unknown is determined to be present in a data set, MS/MS combined with accurate mass measurement allows the elemental composition of product ions to be determined, drastically reducing the time-consuming step of structural elucidation when only nominal mass MS/MS data is acquired.
The Waters Q-Tof Premier Mass Spectrometer further extends the advantages of Tof technology. Enhanced instrument stability enables accurate mass measurements below 3 ppm to be obtained over extended periods of time, without the need for instrument recalibration. The benefits of Tof technology can also be used for quantitative studies, since technology advances now enable 4 orders of linear dynamic range to be acquired routinely. Such performance advances have been brought about through the use of the cutting-edge ion optics, power management, and electronics. Further enhancements to software not only make the Q-Tof Premier easy to use, but also facilitate more efficient data mining, providing answers faster and improving laboratory productivity.
The Q-Tof Premier's programmable Dynamic Range Enhancement (pDRE) extends the working range of the instrument and simplifies data processing as shown in Figure 1. The data presented in this note illustrates typical mass accuracy and dynamic range that can easily be acquired using the Q-Tof Premier. Using temazepam (500 pg/μL), the mass measurement performance was tested over extended, continuous periods in both V-and W-mode resolution geometries. In addition, temazepam was used to test the linear dynamic range in both MS and MS/MS modes.
LC system: |
Waters ACQUITY UPLC System |
Column: |
ACQUITY UPLC BEH C18 2.1 x 100 mm, 1.7 μm |
Mobile phase: |
A: H2O (0.1% HCOOH) B: MeCN |
Isocratic: |
50% A/50% B |
Column temp.: |
45 °C |
Flow: |
0.4 mL/min |
Analyte: |
Temazepam |
MS system: |
Waters Q-Tof Premier Mass Spectrometer |
Ionization mode: |
ESI+at 3 kV |
Cone voltage: |
30 V |
Collision energy: |
18 eV |
Reference mass: |
Leucine enkephalin, [M+H]+ = 556.2771 |
Acquisition parameters: |
100–900 m/z, 0.1 sec/spectrum, 0.05 sec inter-scan delay, and Resolution = >8,000 FWHM (V-mode), 15,000 FWHM (W-mode) |
Longevity/Linearity parameters: |
Calibrated once in V-mode and W-mode, 8-Day experiment, Injection volume = 10 μL,Temazepam conc. = 500 pg/μL,Temazepam linearity series from 0.5 pg/μL to 5000 pg/μL, with triplicate injections |
Data processing: |
MassLynx Software with QuanLynx and MetaboLynx Application Managers (for mass measurement error determination), MS = m/z 301.074 extracted ion chromatogram, and MS/MS = m/z 301.074, 283.062, and 255.067, combined extracted ion chromatograms |
In Figure 2, the total ion chromatogram and m/z 301.074 extracted exact mass chromatogram for temazepam in plasma is shown, with the corresponding exact mass spectrum in Figure 3.
The mass measurement errors for 500 consecutive injections of temazepam using the Q-Tof Premier in V-and W-mode were determined, and the results obtained along with the RMS error are presented in Figures 4 and 5, respectively.
Presented in Figures 6 and 7 are the respective demonstrations of four orders of linearity utilizing full-spectrum acquisition MS and MS/MS for temazepam in plasma, along with the corresponding correlation coefficients obtained.
From Figure 8, the MS/MS exact mass spectrum acquired for temazepam illustrates the mass accuracy obtained for the product ions formed.
A typical monthly 1-minute calibration with residuals of 0.042 mDa is shown in Figure 9. This is the calibration that was used to acquire the results in this note.
A series of experiments was designed to test the long-term performance of the Q-Tof Premier. The tests utilized temazepam in plasma in order to generate representative “real world” results. The results obtained indicate the typical mass accuracy and dynamic range values that can be obtained with the Q-Tof Premier. Using temazepam (500 pg/μL), the mass measurement performance of the Q-Tof Premier was tested over extended, continuous periods in both V-and W-mode resolution geometries. In addition, temazepam was used to test the linear dynamic range in both MS and MS/MS modes.
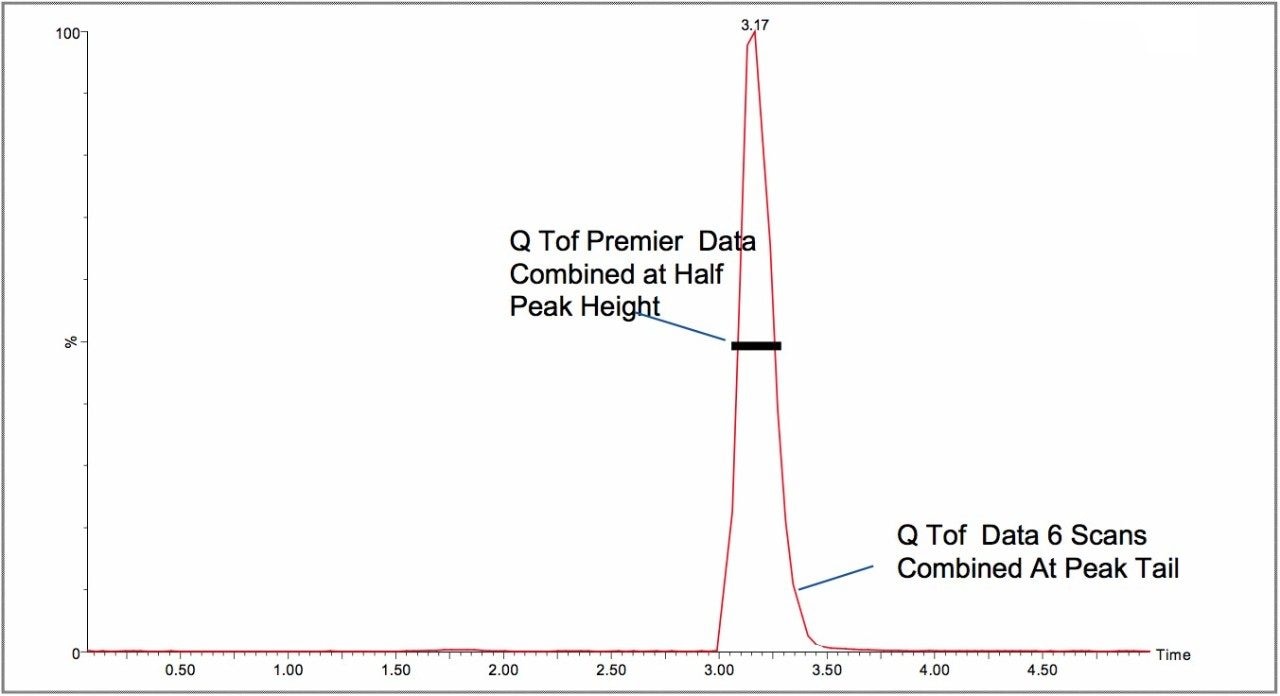
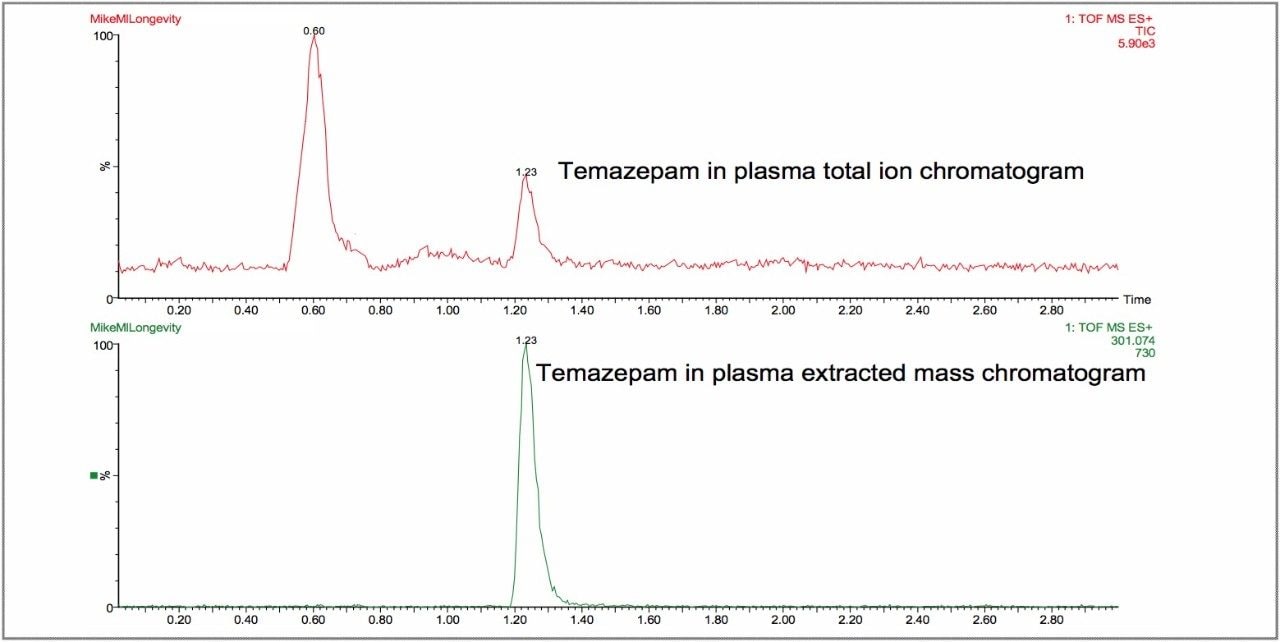
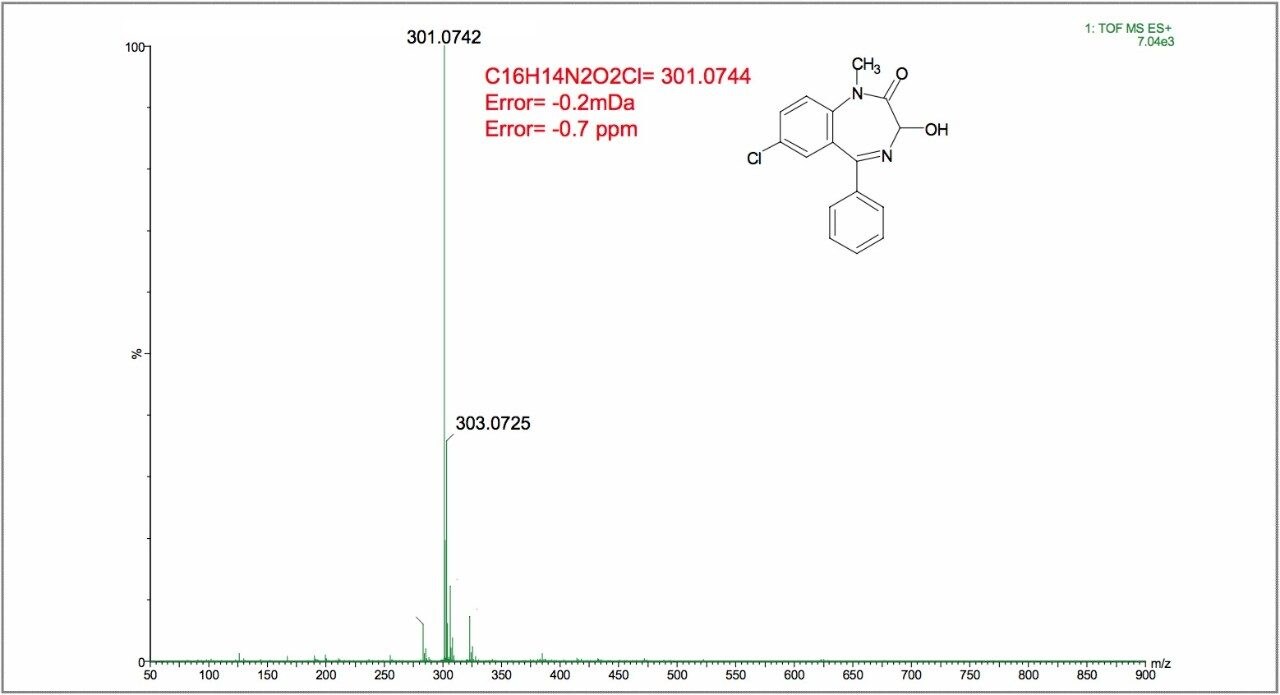
An example of the data acquired for temazepam in plasma are presented in Figure 2, where the total ion chromatogram and the m/z 301.074 extracted exact mass chromatogram are shown. For the corresponding exact mass spectrum in Figure 3, the data were generated by simply combining the data across the extracted ion chromatogram at half-height to generate an accurate mass spectrum with only a –0.7 ppm error. With pDRE, it is no longer necessary to be selective in the choice of data in order to generate an accurate mass spectrum.
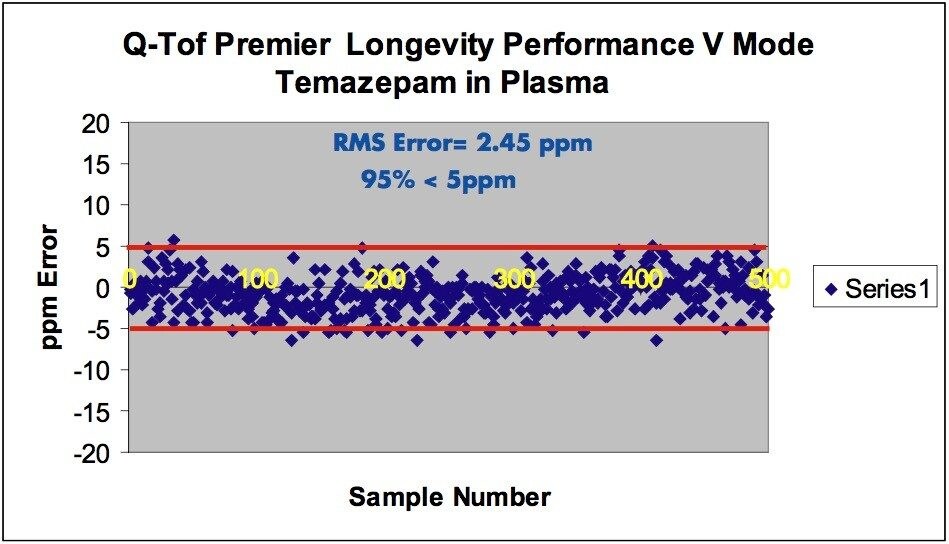
Isocratic conditions were chosen to deliberately increase the retention of temazepam on-column, so that Q-Tof Premier performance could be tested over an extended period of time. Initially, the mass measurement performance was tested in V-mode, where 95% of the mass measurements made were within a 5 ppm error. After 500 consecutive injections in V-mode, an overall RMS error of 2.45 ppm was obtained (Figure 4).
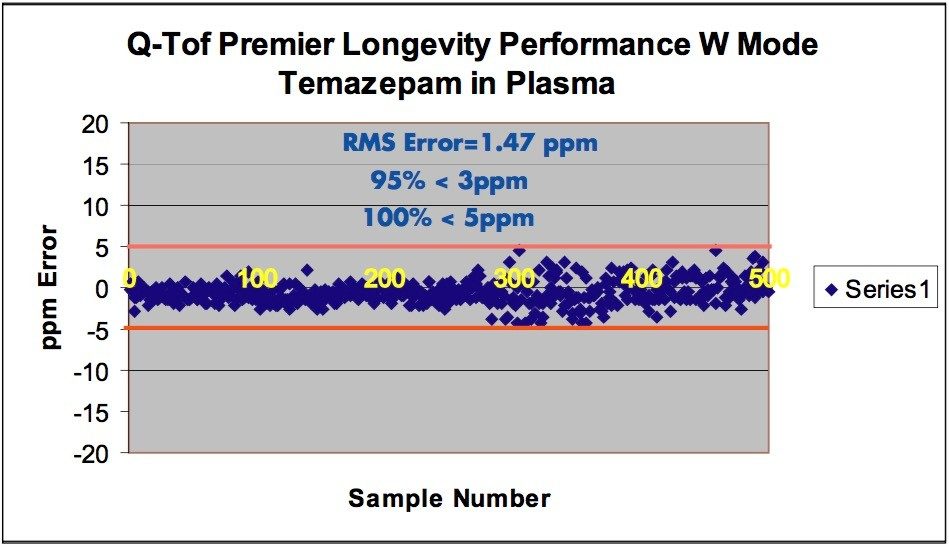
The mass measurement performance test was continued with W-mode geometry and another 500 consecutive injections were made. The resulting data was automatically processed with MetaboLynx. Overall, 100% of the mass measurements made in W-mode were obtained within a <5 ppm error and 95% were obtained at <3 ppm. An RMS error of 1.47 ppm was obtained for the 500 consecutive injections in W-mode (Figure 5). The Q-Tof Premier was calibrated once in V-mode and W-mode, and operated continuously 24 hours a day for eight days before the experiment was completed. The results obtained were acquired using leucineenkephalin as a reference mass, with the Q-Tof Premier’s LockSpray interface. As can be seen from the mass measurement errors obtained, LockSpray “on-the-fly” mass correction is an extremely robust technique and clearly compensates for the environmental fluctuations in a typical laboratory.
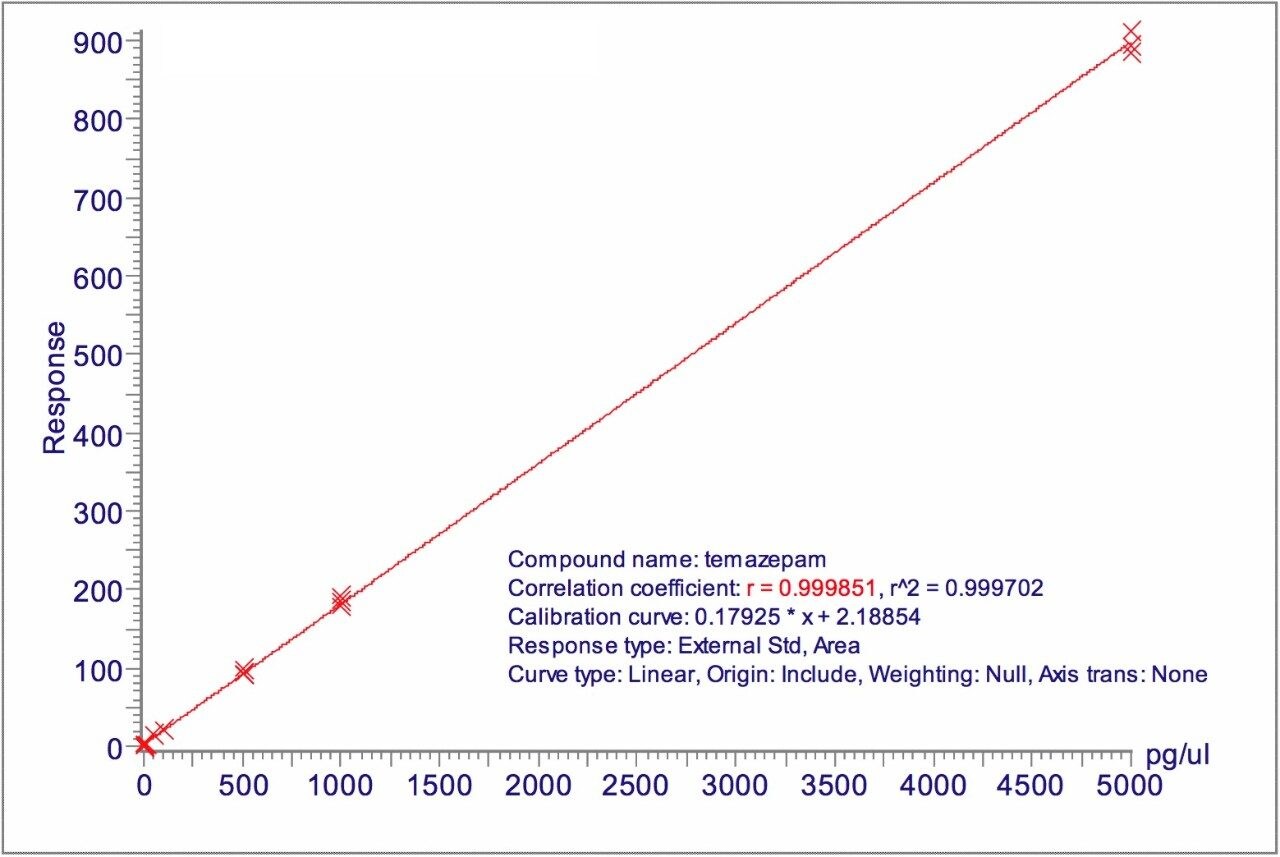
pDRE extends the operating range of the Q-Tof Premier to four orders of magnitude. As a result, both quantitative and qualitative studies can be performed, with the benefits of full-spectrum acquisition and accurate mass measurement. In MS mode, a correlation coefficient of r=0.999851 was obtained for temazepam in plasma from 0.5 to 5000 pg/μL (Figure 6). For the corresponding MS/MS linearity plot, a correlation coefficient of r=0.9997 was obtained (Figure 7).
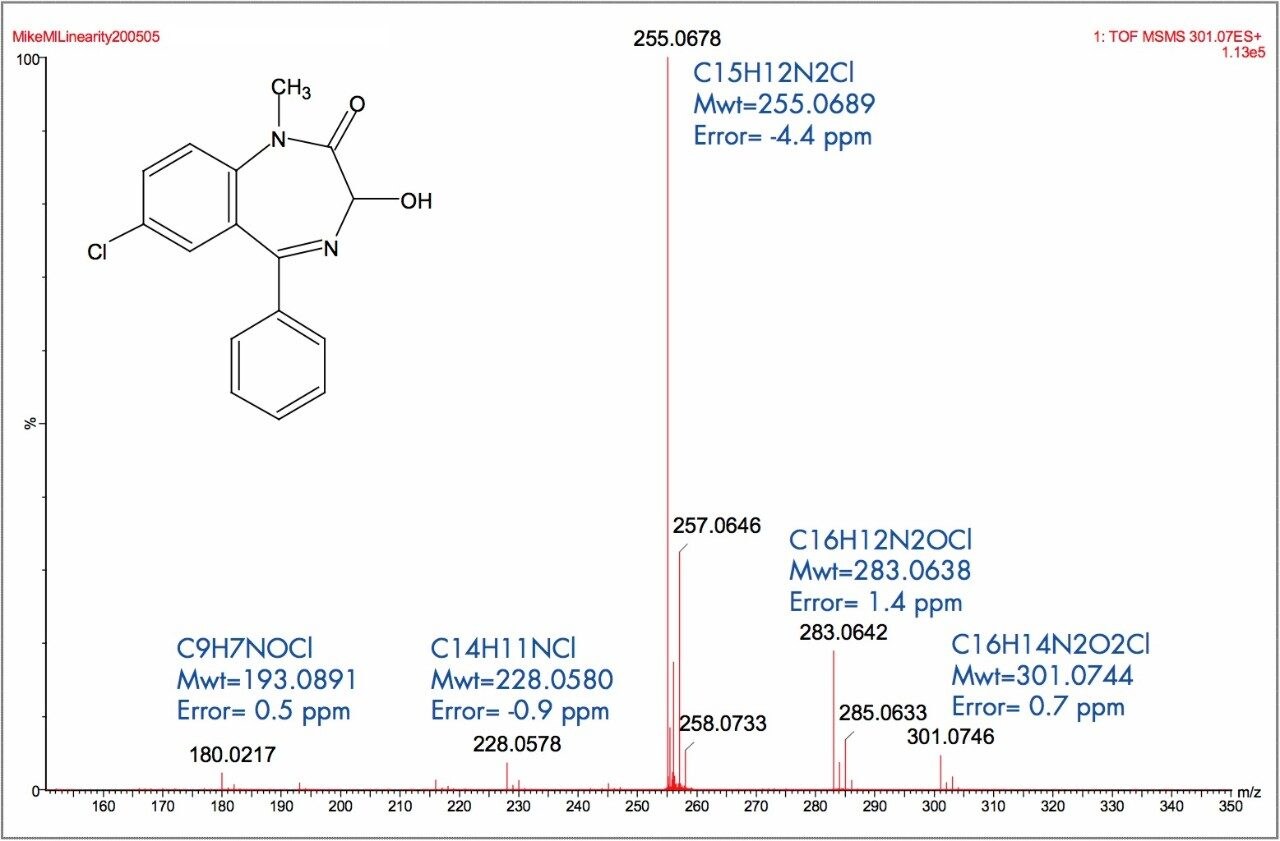
In MS/MS mode, the combined peak areas of the product ions m/z 283.062 and 255.067 and the remaining parent m/z 301.074 were used to determine the response obtained. An example of the MS/MS exact mass spectrum acquired for temazepam at 500 pg/μL is shown, where all of the mass measurements were determined with a <5 ppm error. From the exact mass spectrum shown in Figure 8, it can be seen that accurate mass measurement enables the elemental composition of the product ions to be determined along with the full isotope pattern, which in itself helps to facilitate rapid structural elucidation. The results illustrate that excellent accurate mass measurement was obtained.
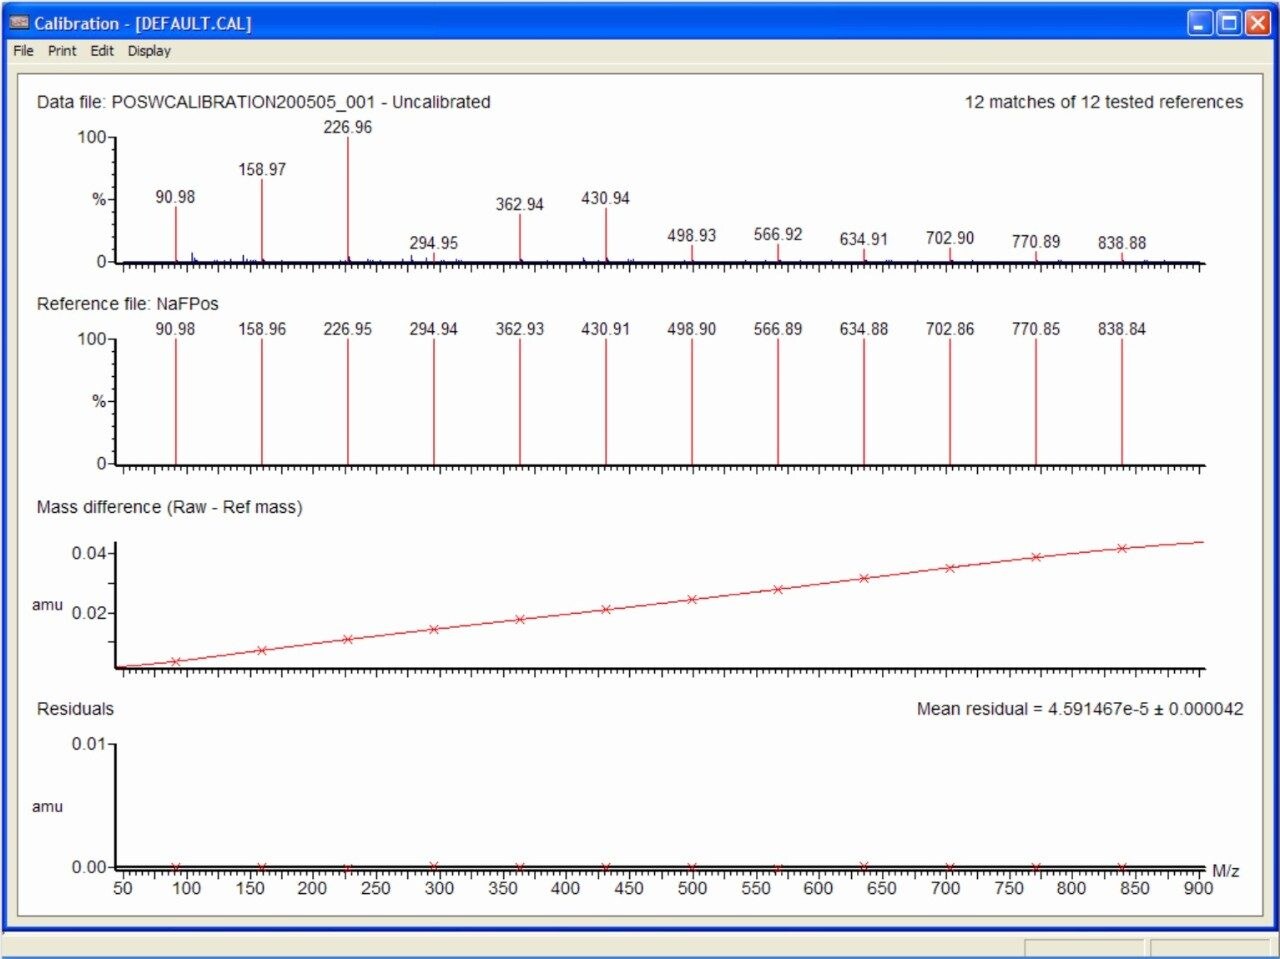
As displayed in Figure 9, a typical monthly 1-minute calibration has residuals of just 0.042 mDa – a result of the latest innovations in electronics, power supply design and ion optics enhancements incorporated into the Q-Tof Premier instrument design. This, in turn, facilitates the routine acquisition of data with <3 ppm error as standard for busy laboratory environments.
The Q-Tof Premier Mass Spectrometer was demonstrated to operate routinely and reliably under conditions that would be experienced in a typical laboratory environment.
- Straightforward and robust calibration, reliable over extended periods
- LockSpray lock mass innovation removes environmental variation issues
- Simplified data processing and selection
- >1000 spiked plasma samples analyzed
- RMS error V-mode=2.45 ppm
- RMS error W-mode=1.47 ppm
720001596, March 2006